Firms formally registered when operations started measures the share of firms that were formally registered at the time they began operating. The World Bank series contains 180 latest non-empty observations, including 62 from 2025, 48 from 2024, and 45 from 2023. Because the full set does not share one reference year, the 2025 same-year comparison is separated from the complete latest-observation list.
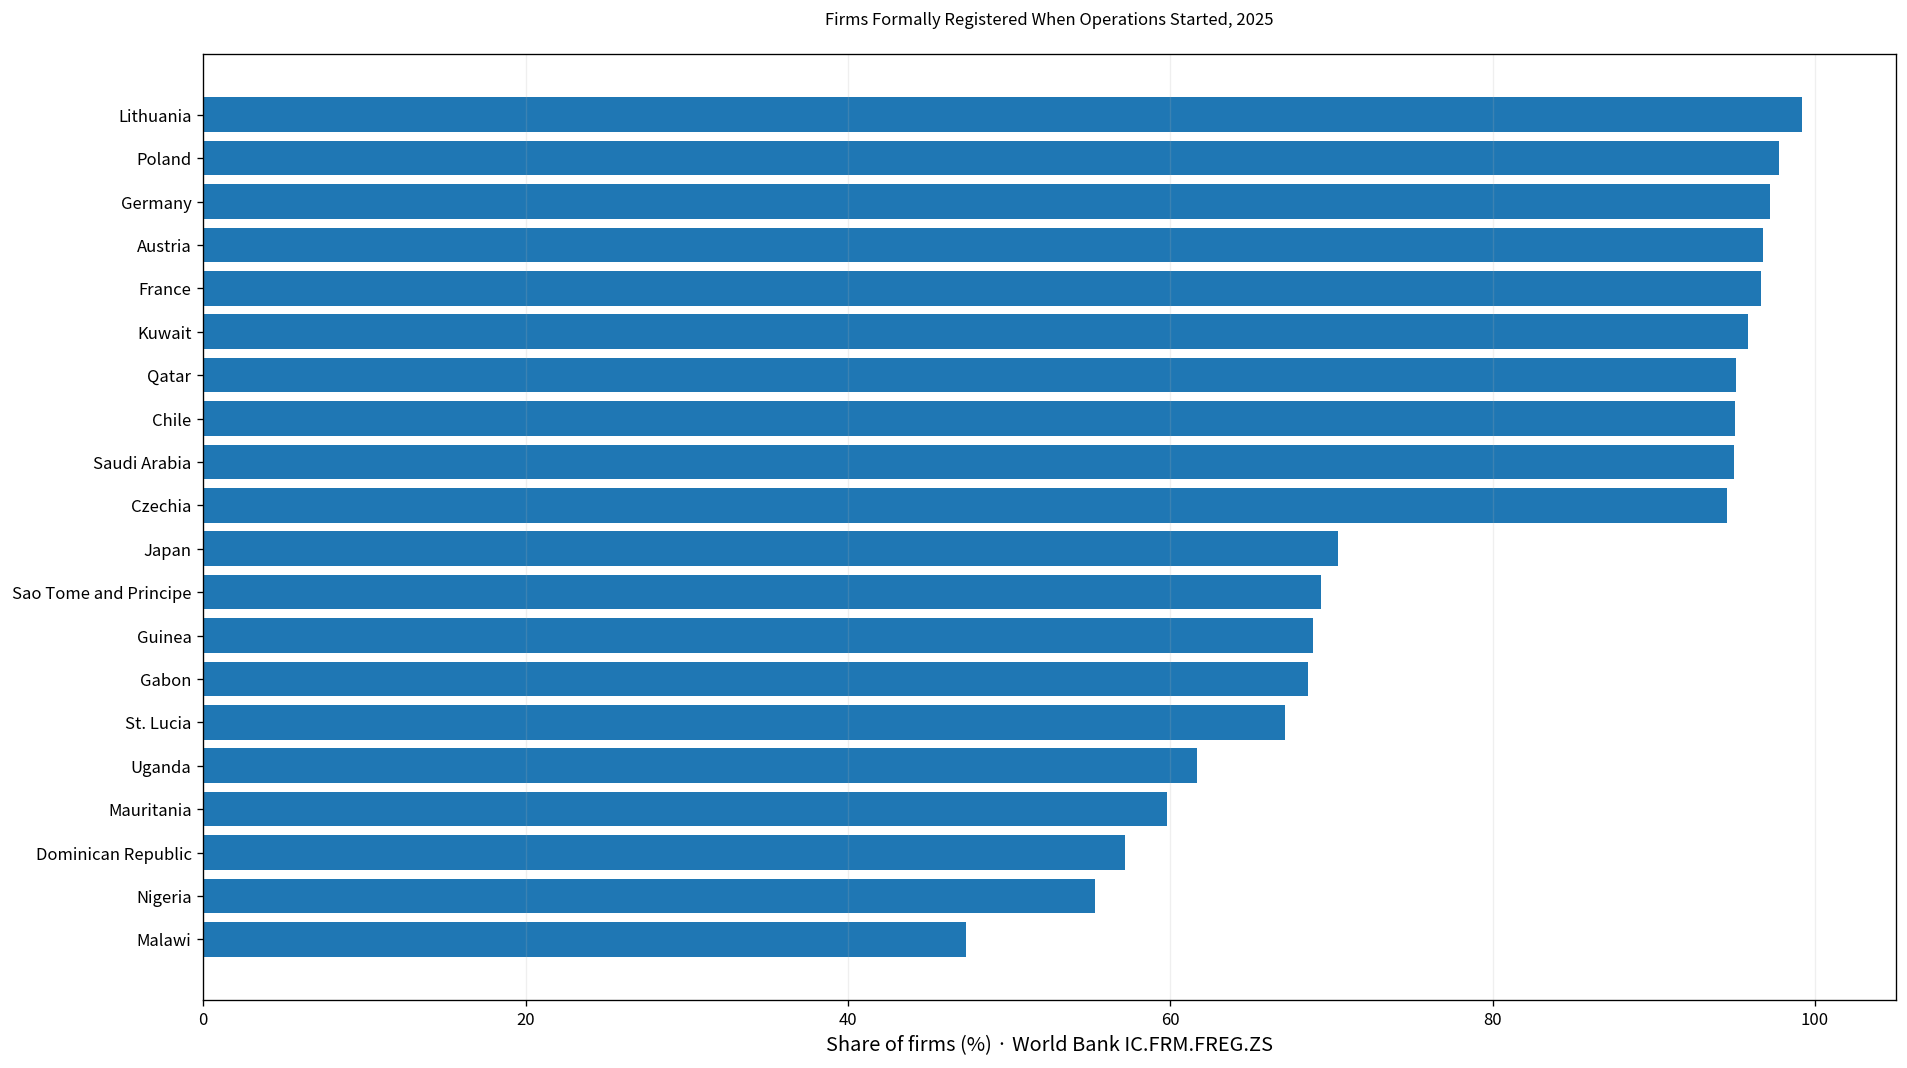
Table of Contents
This indicator is not a current firm-registration rate
The key phrase is ‘when operations started.’ A value of 90% means that about nine in ten firms represented by the indicator were formally registered when they began operating. It does not directly measure the current share of all firms that are registered, nor does it count how many new businesses were registered during the year.
The measure therefore answers a different question from current business-register statistics, the size of informal employment, or annual new-business registrations. It focuses on formal status at the start of operations. A firm that began informally and registered later can have a different history from one that was registered from day one, even if both are formal today.
The 180 latest observations span 2007 to 2025
Among the 180 latest observations, 62 are dated 2025, 48 are from 2024, and 45 are from 2023. There are 4 observations from 2022 and smaller groups from earlier years. The oldest latest value in the data is from 2007.
| Observation year | Economies/territories | Share of 180 |
|---|---|---|
| 2025 | 62 | 34.4% |
| 2024 | 48 | 26.7% |
| 2023 | 45 | 25.0% |
| 2022 | 4 | 2.2% |
| 2021 | 1 | 0.6% |
| 2020 | 2 | 1.1% |
| 2019 | 3 | 1.7% |
| 2018 | 1 | 0.6% |
| 2017 | 1 | 0.6% |
| 2016 | 3 | 1.7% |
| 2014 | 1 | 0.6% |
| 2013 | 1 | 0.6% |
| 2010 | 5 | 2.8% |
| 2009 | 2 | 1.1% |
| 2007 | 1 | 0.6% |
The mixed-year collection has a mean of 83.84% and a median of 88.05%, with a range from 43.87% to 100.00%. Because observations from different periods are combined, these statistics should not be presented as a current global average.
The 2025 mean is 82.12% and the median is 85.91%
The 2025 subset contains 62 economies. Its mean is 82.12% and its median 85.91%. The first quartile is 74.75% and the third quartile 90.03%, so the middle half of observations lies roughly between 74.8% and 90.0%.
37 observations are at least 80%, 17 are at least 90%, and 9 are at least 95%. At the lower end, 9 are below 70% and 4 are below 60%. Formal registration at startup is common in much of the 2025 subset, but the distance between the upper and lower tails is large.
Lithuania is highest in 2025 at 99.20%
Lithuania records 99.20%, followed by Poland at 97.76%, Germany at 97.19%, Austria at 96.77%, and France at 96.68%. Kuwait reaches 95.85%, Qatar 95.09%, Chile 95.04%, Saudi Arabia 95.00%, and Czechia 94.56%.
| 2025 rank | Economy/territory | Formally registered when operations started |
|---|---|---|
| 1 | Lithuania | 99.20% |
| 2 | Poland | 97.76% |
| 3 | Germany | 97.19% |
| 4 | Austria | 96.77% |
| 5 | France | 96.68% |
| 6 | Kuwait | 95.85% |
| 7 | Qatar | 95.09% |
| 8 | Chile | 95.04% |
| 9 | Saudi Arabia | 95.00% |
| 10 | Czechia | 94.56% |
| 11 | Finland | 92.95% |
| 12 | Brunei Darussalam | 91.71% |
| 13 | Netherlands | 91.39% |
| 14 | Brazil | 91.27% |
| 15 | Egypt, Arab Rep. | 90.94% |
A high value means that most firms represented by the indicator were formally registered from the beginning of operations. It does not prove that starting a business is easy or inexpensive. Registration requirements, the types of firms represented, firm size, sector composition, enforcement, and the wider business environment can all matter.
Malawi is lowest in 2025 at 47.31%
Malawi records 47.31%, followed by Nigeria at 55.35%, Dominican Republic at 57.21%, and Mauritania at 59.82%. Uganda records 61.65%, while St. Lucia, Gabon, Guinea, and Sao Tome and Principe are also below 70%.
| Low-order position in 2025 | Economy/territory | Formally registered when operations started |
|---|---|---|
| 1 | Malawi | 47.31% |
| 2 | Nigeria | 55.35% |
| 3 | Dominican Republic | 57.21% |
| 4 | Mauritania | 59.82% |
| 5 | Uganda | 61.65% |
| 6 | St. Lucia | 67.12% |
| 7 | Gabon | 68.57% |
| 8 | Guinea | 68.83% |
| 9 | Sao Tome and Principe | 69.38% |
| 10 | Japan | 70.42% |
| 11 | Zimbabwe | 70.73% |
| 12 | Liberia | 72.35% |
| 13 | Albania | 73.54% |
| 14 | Belize | 74.47% |
| 15 | Suriname | 74.63% |
A low value indicates that a larger share of firms did not begin operations in formally registered status. It should not automatically be interpreted as the current size of the informal economy or as proof of regulatory failure. Some firms can formalize later, and the firms represented by the indicator should not be assumed to equal every business operating in the economy.
The 2024 and 2023 medians are also above 80%
The 2024 subset contains 48 observations, with a mean of 86.13% and a median of 91.52%. The 2023 subset contains 45, with a mean of 82.41% and a median of 86.92%. These annual groups contain different economies, so their averages should not be read as a global time trend.
In 2024, Bhutan records 97.66%, Kazakhstan 96.60%, Armenia 96.35%, Moldova 96.19%, and Malaysia 96.05%. The lower end includes Burkina Faso at 43.87%, Mali at 53.99%, Congo, Dem. Rep. at 55.96%, Congo, Rep. at 61.49%, and Equatorial Guinea at 63.19%.
| 2024 high-order position | Economy/territory | Share |
|---|---|---|
| 1 | Bhutan | 97.66% |
| 2 | Turkiye | 97.13% |
| 3 | Serbia | 96.93% |
| 4 | Kazakhstan | 96.60% |
| 5 | Slovenia | 96.57% |
| 6 | Armenia | 96.35% |
| 7 | Moldova | 96.19% |
| 8 | Malaysia | 96.05% |
| 9 | China | 96.02% |
| 10 | Tonga | 95.32% |
| 2024 low-order position | Economy/territory | Share |
|---|---|---|
| 1 | Burkina Faso | 43.87% |
| 2 | Mali | 53.99% |
| 3 | Congo, Dem. Rep. | 55.96% |
| 4 | Congo, Rep. | 61.49% |
| 5 | Equatorial Guinea | 63.19% |
| 6 | Lao PDR | 65.38% |
| 7 | Angola | 72.49% |
| 8 | Cameroon | 73.96% |
| 9 | Ecuador | 75.84% |
| 10 | Israel | 80.81% |
The 2023 distribution also reflects a different set of economies
There are 45 observations dated 2023. The upper end includes Slovenia, Georgia, Hong Kong SAR, China, and Bulgaria around or above the mid-90s, while Central African Republic and Cote d’Ivoire are among the lowest. These values are useful for context, but they are not the same economies as the 2025 group.
| 2023 high-order position | Economy/territory | Share |
|---|---|---|
| 1 | Romania | 97.92% |
| 2 | Georgia | 97.17% |
| 3 | Viet Nam | 97.03% |
| 4 | Singapore | 96.84% |
| 5 | Hong Kong SAR, China | 96.24% |
| 6 | Portugal | 96.21% |
| 7 | Bulgaria | 96.11% |
| 8 | Costa Rica | 94.97% |
| 9 | Kyrgyz Republic | 94.05% |
| 10 | Hungary | 93.78% |
| 2023 low-order position | Economy/territory | Share |
|---|---|---|
| 1 | Chad | 44.56% |
| 2 | Sierra Leone | 45.45% |
| 3 | Central African Republic | 45.77% |
| 4 | Cote d’Ivoire | 47.86% |
| 5 | West Bank and Gaza | 65.77% |
| 6 | Indonesia | 66.04% |
| 7 | Tanzania | 67.98% |
| 8 | Rwanda | 72.52% |
| 9 | Morocco | 73.21% |
| 10 | Gambia, The | 76.58% |
A high share does not summarize the entire business environment
Registration status at startup is one dimension of business formalization. It does not directly measure the time or cost required to register, tax burdens, access to finance, contract enforcement, electricity reliability, labor regulation, or the number of procedures required to establish a firm.
An economy can have a high startup-registration share and still have costly procedures. Another can have a lower share because informal startup is common among certain sectors or small firms. A broader business-environment assessment needs registration-process data, new-business density, firm size, finance, and other institutional indicators.
It is also different from the current share of formal firms
Because the indicator looks back to the start of operations, it is not equivalent to current formal status. A firm that started informally and registered later would not have been formally registered at startup, even if it is formal today. The indicator also does not show whether firms that were registered at startup are still operating.
For the present size of the formal business sector, current registration records, tax registration, establishment surveys, and measures of formal employment are more appropriate. This indicator is better understood as a description of how firms entered economic activity.
Complete list of the 180 latest observations
The table below lists the latest non-empty observation for each economy and territory in alphabetical order. Rows not dated 2025 retain their original year. For a strict same-year comparison, use only the 2025 observations.
| Economy/territory | Observation year | Formally registered when operations started |
|---|---|---|
| Afghanistan | 2025 | 80.11% |
| Albania | 2025 | 73.54% |
| Algeria | 2007 | 98.30% |
| Angola | 2024 | 72.49% |
| Antigua and Barbuda | 2025 | 78.70% |
| Argentina | 2017 | 92.31% |
| Armenia | 2024 | 96.35% |
| Australia | 2025 | 88.04% |
| Austria | 2025 | 96.77% |
| Azerbaijan | 2024 | 82.57% |
| Bahamas, The | 2010 | 92.82% |
| Bahrain | 2024 | 93.36% |
| Bangladesh | 2022 | 61.38% |
| Barbados | 2023 | 79.23% |
| Belarus | 2018 | 98.11% |
| Belgium | 2025 | 89.92% |
| Belize | 2025 | 74.47% |
| Benin | 2024 | 86.58% |
| Bhutan | 2024 | 97.66% |
| Bolivia | 2025 | 75.95% |
| Bosnia and Herzegovina | 2023 | 88.30% |
| Botswana | 2023 | 92.22% |
| Brazil | 2025 | 91.27% |
| Brunei Darussalam | 2025 | 91.71% |
| Bulgaria | 2023 | 96.11% |
| Burkina Faso | 2024 | 43.87% |
| Burundi | 2025 | 74.98% |
| Cabo Verde | 2024 | 88.61% |
| Cambodia | 2023 | 77.00% |
| Cameroon | 2024 | 73.96% |
| Canada | 2024 | 89.91% |
| Central African Republic | 2023 | 45.77% |
| Chad | 2023 | 44.56% |
| Chile | 2025 | 95.04% |
| China | 2024 | 96.02% |
| Colombia | 2023 | 87.94% |
| Comoros | 2025 | 78.58% |
| Congo, Dem. Rep. | 2024 | 55.96% |
| Congo, Rep. | 2024 | 61.49% |
| Costa Rica | 2023 | 94.97% |
| Cote d’Ivoire | 2023 | 47.86% |
| Croatia | 2023 | 90.95% |
| Cyprus | 2024 | 94.30% |
| Czechia | 2025 | 94.56% |
| Denmark | 2025 | 90.04% |
| Djibouti | 2025 | 90.00% |
| Dominica | 2010 | 97.40% |
| Dominican Republic | 2025 | 57.21% |
| Ecuador | 2024 | 75.84% |
| Egypt, Arab Rep. | 2025 | 90.94% |
| El Salvador | 2023 | 81.82% |
| Equatorial Guinea | 2024 | 63.19% |
| Eritrea | 2009 | 100.00% |
| Estonia | 2023 | 92.89% |
| Eswatini | 2024 | 90.31% |
| Ethiopia | 2025 | 89.06% |
| Fiji | 2025 | 82.47% |
| Finland | 2025 | 92.95% |
| France | 2025 | 96.68% |
| Gabon | 2025 | 68.57% |
| Gambia, The | 2023 | 76.58% |
| Georgia | 2023 | 97.17% |
| Germany | 2025 | 97.19% |
| Ghana | 2023 | 78.47% |
| Greece | 2023 | 90.07% |
| Grenada | 2025 | 81.11% |
| Guatemala | 2025 | 87.51% |
| Guinea | 2025 | 68.83% |
| Guinea-Bissau | 2025 | 77.34% |
| Guyana | 2010 | 81.68% |
| Honduras | 2016 | 85.51% |
| Hong Kong SAR, China | 2023 | 96.24% |
| Hungary | 2023 | 93.78% |
| Iceland | 2024 | 81.17% |
| India | 2025 | 88.05% |
| Indonesia | 2023 | 66.04% |
| Iraq | 2022 | 62.81% |
| Ireland | 2024 | 82.31% |
| Israel | 2024 | 80.81% |
| Italy | 2024 | 92.28% |
| Jamaica | 2024 | 91.66% |
| Japan | 2025 | 70.42% |
| Jordan | 2024 | 91.40% |
| Kazakhstan | 2024 | 96.60% |
| Kenya | 2025 | 88.03% |
| Kiribati | 2025 | 83.08% |
| Korea, Rep. | 2024 | 95.30% |
| Kosovo | 2025 | 89.08% |
| Kuwait | 2025 | 95.85% |
| Kyrgyz Republic | 2023 | 94.05% |
| Lao PDR | 2024 | 65.38% |
| Latvia | 2024 | 94.85% |
| Lebanon | 2019 | 87.19% |
| Lesotho | 2023 | 78.95% |
| Liberia | 2025 | 72.35% |
| Lithuania | 2025 | 99.20% |
| Luxembourg | 2020 | 94.66% |
| Madagascar | 2022 | 73.07% |
| Malawi | 2025 | 47.31% |
| Malaysia | 2024 | 96.05% |
| Maldives | 2025 | 89.27% |
| Mali | 2024 | 53.99% |
| Malta | 2024 | 91.67% |
| Mauritania | 2025 | 59.82% |
| Mauritius | 2023 | 81.70% |
| Mexico | 2023 | 76.60% |
| Micronesia, Fed. Sts. | 2009 | 96.87% |
| Moldova | 2024 | 96.19% |
| Mongolia | 2025 | 85.22% |
| Montenegro | 2023 | 86.48% |
| Morocco | 2023 | 73.21% |
| Mozambique | 2025 | 74.68% |
| Myanmar | 2016 | 79.06% |
| Namibia | 2024 | 85.28% |
| Nepal | 2023 | 85.36% |
| Netherlands | 2025 | 91.39% |
| New Zealand | 2023 | 90.85% |
| Nicaragua | 2016 | 83.53% |
| Niger | 2025 | 75.65% |
| Nigeria | 2025 | 55.35% |
| North Macedonia | 2023 | 93.12% |
| Norway | 2025 | 88.24% |
| Pakistan | 2022 | 58.36% |
| Panama | 2025 | 86.60% |
| Papua New Guinea | 2024 | 88.97% |
| Paraguay | 2023 | 86.01% |
| Peru | 2023 | 88.91% |
| Philippines | 2023 | 89.20% |
| Poland | 2025 | 97.76% |
| Portugal | 2023 | 96.21% |
| Qatar | 2025 | 95.09% |
| Romania | 2023 | 97.92% |
| Russian Federation | 2019 | 91.43% |
| Rwanda | 2023 | 72.52% |
| Samoa | 2023 | 88.76% |
| Sao Tome and Principe | 2025 | 69.38% |
| Saudi Arabia | 2025 | 95.00% |
| Senegal | 2024 | 90.45% |
| Serbia | 2024 | 96.93% |
| Seychelles | 2023 | 82.51% |
| Sierra Leone | 2023 | 45.45% |
| Singapore | 2023 | 96.84% |
| Slovak Republic | 2023 | 86.92% |
| Slovenia | 2024 | 96.57% |
| Solomon Islands | 2025 | 88.57% |
| Somalia, Fed. Rep. | 2025 | 75.26% |
| South Africa | 2020 | 95.78% |
| South Sudan | 2024 | 81.83% |
| Spain | 2024 | 94.61% |
| Sri Lanka | 2025 | 78.41% |
| St. Kitts and Nevis | 2010 | 84.38% |
| St. Lucia | 2025 | 67.12% |
| St. Vincent and the Grenadines | 2025 | 78.05% |
| Sudan | 2014 | 97.02% |
| Suriname | 2025 | 74.63% |
| Sweden | 2024 | 85.49% |
| Switzerland | 2025 | 87.20% |
| Tajikistan | 2024 | 91.64% |
| Tanzania | 2023 | 67.98% |
| Thailand | 2025 | 88.22% |
| Timor-Leste | 2021 | 86.96% |
| Togo | 2023 | 80.18% |
| Tonga | 2024 | 95.32% |
| Trinidad and Tobago | 2025 | 86.82% |
| Tunisia | 2024 | 93.36% |
| Turkiye | 2024 | 97.13% |
| Turkmenistan | 2024 | 93.04% |
| Uganda | 2025 | 61.65% |
| Ukraine | 2019 | 92.80% |
| United Kingdom | 2024 | 89.12% |
| United States | 2024 | 93.37% |
| Uruguay | 2024 | 94.98% |
| Uzbekistan | 2024 | 94.21% |
| Vanuatu | 2023 | 88.16% |
| Venezuela, RB | 2010 | 95.61% |
| Viet Nam | 2023 | 97.03% |
| West Bank and Gaza | 2023 | 65.77% |
| Yemen, Rep. | 2013 | 68.83% |
| Zambia | 2025 | 84.38% |
| Zimbabwe | 2025 | 70.73% |
How to interpret the comparison
First, the 180 latest observations do not all share one year. Second, the indicator measures formal registration at the start of operations rather than the current registration rate. Third, a high value does not by itself prove a favorable overall business environment. Fourth, comparing annual averages as a time trend requires the same economies to be observed across years.
Country-level interpretation should therefore be combined with information on registration procedures, business demographics, finance, taxation, informality, and the composition of firms. National business-register statistics can also provide a more current view of present formalization.
Source and calculation
The source is World Bank World Development Indicators IC.FRM.FREG.ZS, Firms formally registered when operations started (% of firms). The 2025 mean, median, quartiles, threshold counts, and rankings are calculated from the 62 observations dated 2025.
Frequently Asked Questions
Is this the same as the current share of registered firms?
No. It measures whether firms were formally registered when they began operations, not the current registration status of all firms.
What is the 2025 median?
The median across the 62 observations dated 2025 is 85.91%, while the mean is 82.12%.
Does a high share mean the business environment is good overall?
Not necessarily. Startup registration is one dimension; registration costs, procedures, finance, taxation, and other business conditions require separate evidence.
Related Articles
Green Map creates custom-edited map images using open geographic data sources such as geoBoundaries, Natural Earth, OpenStreetMap, and government open data. These maps are edited visual materials, not raw data files, and are provided for education, documents, presentations, and graphic reference.