The World Bank bribery-incidence indicator measures the percentage of firms that report experiencing at least one bribe payment request across six public transactions involving utility access, permits, licenses, and taxes. The IC.FRM.BRIB.ZS file contains 181 latest non-empty observations. Recent coverage is substantial: 62 observations are from 2025, 48 from 2024, and 45 from 2023. The main comparison therefore uses the 62 economies observed in 2025.
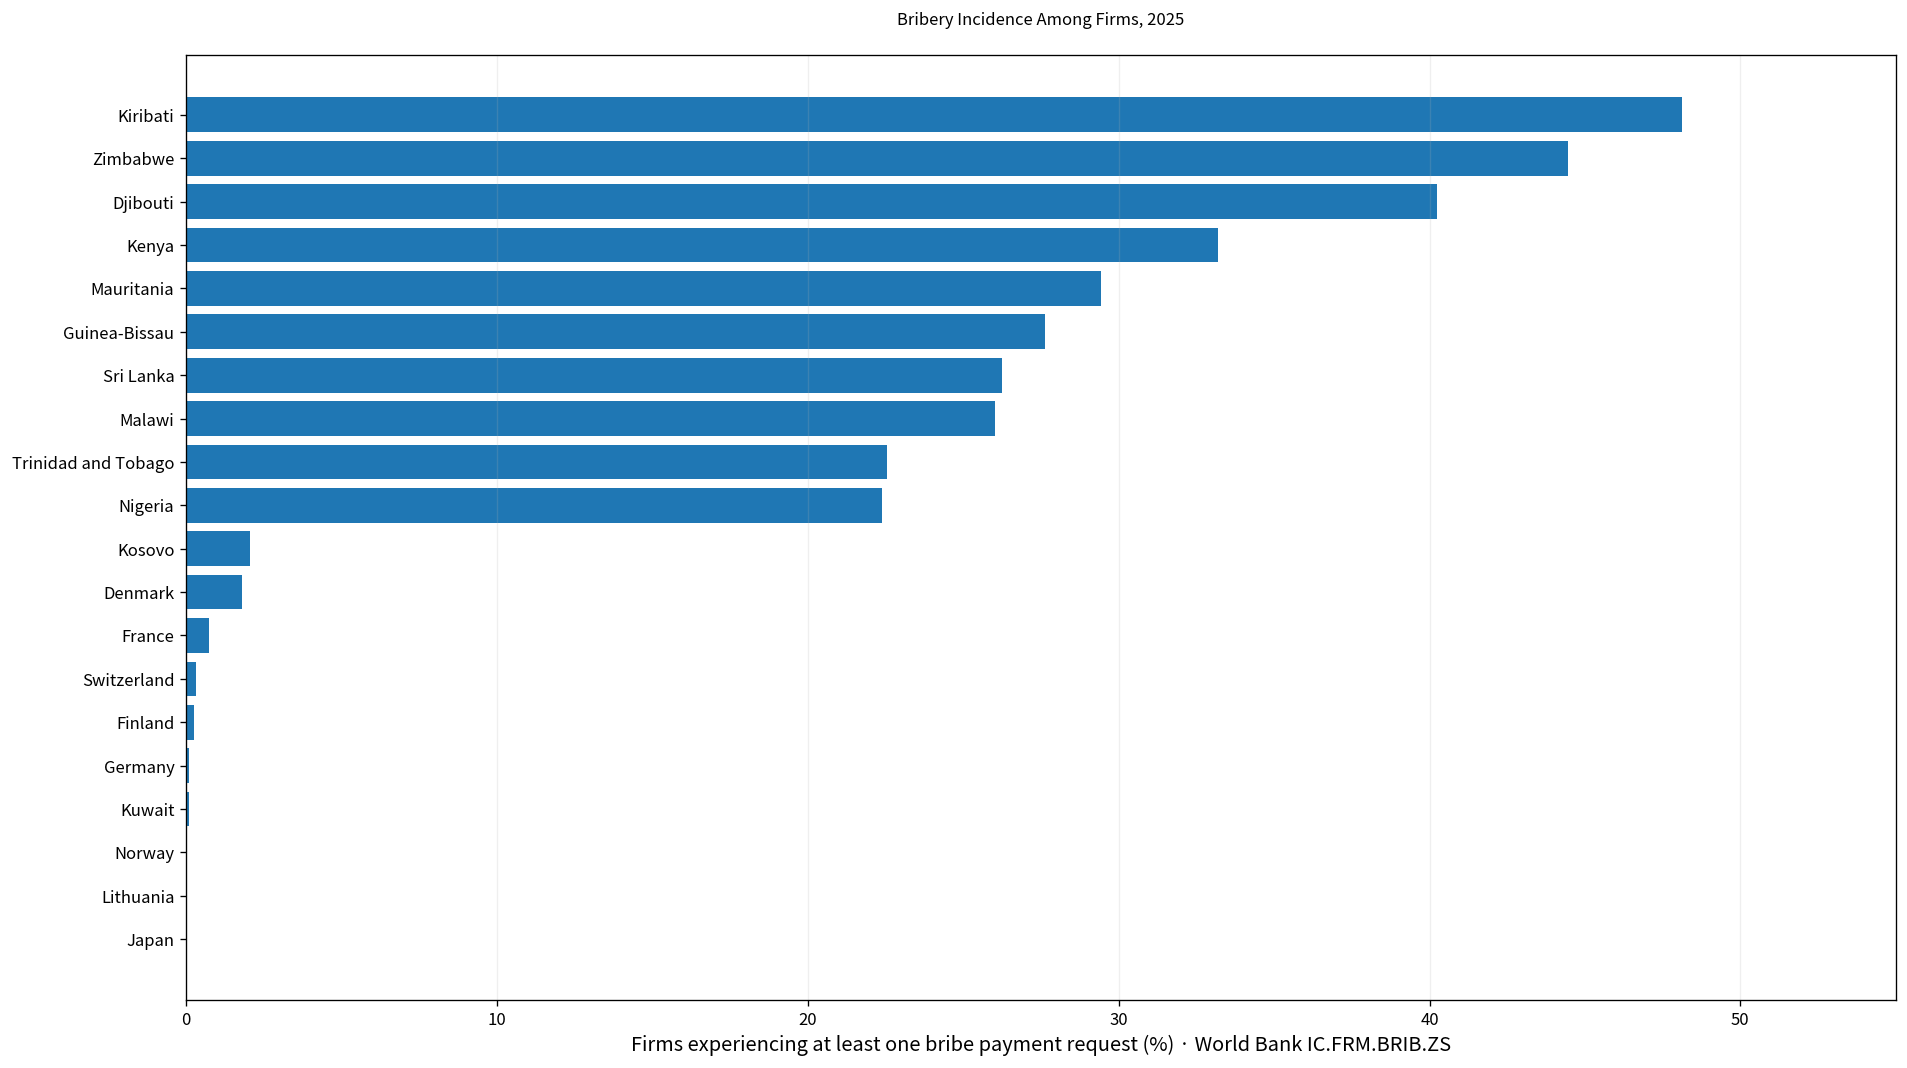
Table of Contents
This is an experience indicator, not a general corruption-perception score
Country corruption measures can be based on expert opinion, household perceptions, administrative cases, or firm surveys. This indicator belongs to the experience-based firm-survey category. It asks whether a firm encountered at least one bribe payment request during specified interactions with public authorities.
The scope is narrower than a general statement about corruption in a country. The six public transactions cover areas such as utility connections, permits, licenses, and taxes. Political corruption, household experiences, and many interactions outside those transactions are not directly measured by this percentage.
A 20% value means about one in five firms reported at least one request
If the indicator is 20%, roughly one in five firms under the survey definition reported at least one bribe payment request in the covered transactions. A firm receiving several requests still counts as one firm with at least one experience for this percentage.
The indicator therefore does not measure the total number of requests, the value of requested payments, whether the firm actually paid, or the average bribe per firm. Incidence and monetary burden are different concepts.
The 2025 mean is 11.78% and the median is 8.38%
The 2025 subset contains 62 economies. Its mean is 11.78% and median 8.38%. The first quartile is 2.91% and the third quartile 17.28%, placing the middle half roughly between 2.9% and 17.3%.
24 observations are at least 10%, 14 are at least 20%, and 4 are at least 30%. At the lower end, 19 are below 5% and 8 are below 1%. The same-year distribution spans from zero to almost half of firms.
Kiribati is highest in 2025 at 48.11%
Kiribati records 48.11%, followed by Zimbabwe at 44.46%, Djibouti at 40.25%, Kenya at 33.19%, Mauritania at 29.44%, Guinea-Bissau at 27.64%, Sri Lanka at 26.23%, and Malawi at 26.03%. Trinidad and Tobago, Nigeria, and Mozambique are also above 20%.
| 2025 rank | Economy/territory | Firms experiencing at least one bribe request |
|---|---|---|
| 1 | Kiribati | 48.11% |
| 2 | Zimbabwe | 44.46% |
| 3 | Djibouti | 40.25% |
| 4 | Kenya | 33.19% |
| 5 | Mauritania | 29.44% |
| 6 | Guinea-Bissau | 27.64% |
| 7 | Sri Lanka | 26.23% |
| 8 | Malawi | 26.03% |
| 9 | Trinidad and Tobago | 22.55% |
| 10 | Nigeria | 22.39% |
| 11 | Mozambique | 22.10% |
| 12 | Liberia | 20.58% |
| 13 | Gabon | 20.55% |
| 14 | Uganda | 20.45% |
| 15 | Thailand | 19.02% |
A high value means a large share of surveyed firms reported at least one request in the covered public transactions. It does not establish that every government agency, region, or industry within the country has the same incidence.
Japan and Lithuania report 0% in 2025
Japan and Lithuania each record 0% in 2025. Norway is at 0.02%, Kuwait 0.09%, Germany 0.10%, Finland 0.24%, Switzerland 0.33%, and France 0.74%. Denmark is at 1.79%, Kosovo 2.06%, Austria 2.47%, and Australia 2.51%.
| Low-order position in 2025 | Economy/territory | Firms experiencing at least one bribe request |
|---|---|---|
| 1 | Japan | 0.00% |
| 2 | Lithuania | 0.00% |
| 3 | Norway | 0.02% |
| 4 | Kuwait | 0.09% |
| 5 | Germany | 0.10% |
| 6 | Finland | 0.24% |
| 7 | Switzerland | 0.33% |
| 8 | France | 0.74% |
| 9 | Denmark | 1.79% |
| 10 | Kosovo | 2.06% |
| 11 | Austria | 2.47% |
| 12 | Australia | 2.51% |
| 13 | Czechia | 2.57% |
| 14 | Maldives | 2.59% |
| 15 | Chile | 2.64% |
A published zero is not a missing value filled with zero. It means the estimate for the surveyed firms and covered transactions is reported as 0%. It should not be expanded into a claim that no firm in the entire economy ever encounters any form of bribery.
The 2024 group has a mean of 8.93%
The 2024 subset contains 48 economies, with a mean of 8.93% and a median of 4.15%. Equatorial Guinea is highest at 40.50%, followed by Lao PDR at 30.60%, Congo, Dem. Rep. at 28.54%, Israel at 28.50%, South Sudan at 27.39%, and Congo, Rep. at 27.33%.
| 2024 high-order position | Economy/territory | Firms experiencing at least one bribe request |
|---|---|---|
| 1 | Equatorial Guinea | 40.50% |
| 2 | Lao PDR | 30.60% |
| 3 | Congo, Dem. Rep. | 28.54% |
| 4 | Israel | 28.50% |
| 5 | South Sudan | 27.39% |
| 6 | Congo, Rep. | 27.33% |
| 7 | Cameroon | 21.65% |
| 8 | Angola | 21.51% |
| 9 | Papua New Guinea | 19.38% |
| 10 | Kazakhstan | 16.42% |
| 11 | Ecuador | 14.40% |
| 12 | Burkina Faso | 14.12% |
The 2024 average is lower than the 2025 average, but that does not show a one-year worldwide increase in bribery incidence. The sets of economies are different. A trend analysis would need repeated survey observations for the same countries.
Most latest observations are concentrated in 2023–2025
Of the 181 latest non-empty observations, 62 are dated 2025, 48 2024, and 45 2023. Together those three years account for 155 rows, or about 85.6% of the file.
| Observation year | Economies/territories | Share of 181 |
|---|---|---|
| 2025 | 62 | 34.3% |
| 2024 | 48 | 26.5% |
| 2023 | 45 | 24.9% |
| 2022 | 4 | 2.2% |
| 2021 | 1 | 0.6% |
| 2020 | 2 | 1.1% |
| 2019 | 3 | 1.7% |
| 2018 | 1 | 0.6% |
| 2017 | 1 | 0.6% |
| 2016 | 3 | 1.7% |
| 2014 | 1 | 0.6% |
| 2013 | 1 | 0.6% |
| 2010 | 5 | 2.8% |
| 2009 | 3 | 1.7% |
| 2007 | 1 | 0.6% |
A smaller group retains older survey observations from 2007–2022. The Syrian Arab Republic, for example, has a latest observation of 69.6% from 2009. Such values are valid historical latest observations in the file but should not be treated as measurements of current conditions.
The highest latest value is old, so a latest-value ranking can mislead
The maximum in the 181-row latest-value file is Syrian Arab Republic at 69.6% in 2009. Recent high values such as Kiribati 48.11% in 2025, Zimbabwe 44.46% in 2025, Djibouti 40.25% in 2025, and Equatorial Guinea 40.50% in 2024 come from very different survey years.
Sorting all latest observations into one list therefore mixes time periods. The 2025 ranking is the cleaner same-year comparison, while the complete table is better understood as an inventory of each economy’s most recent non-empty observation.
A bribe request is not the same as an actual payment
The indicator is defined around a bribe payment request. Receiving a request does not establish that the firm actually paid. The dataset also does not show the monetary amount, the number of requests, or the share of revenue involved.
A more detailed business-corruption analysis would need other Enterprise Surveys variables covering informal payments, the specific public transaction involved, firm size, industry, and other characteristics.
Survey composition can matter for country comparisons
Firm surveys reflect the population and sample of businesses covered by the survey. Industry mix, firm size, geography, and which public transactions firms undertake can influence measured incidence. Identical percentages in two countries do not necessarily mean the underlying pattern of requests is identical.
Country comparisons are most useful when survey year and indicator definition remain visible. Older observations should not be placed beside recent ones without noting the time difference.
A low incidence does not mean every form of corruption is absent
The indicator covers firms and specific public transactions. Political finance, all forms of public procurement, household encounters with officials, informal-sector interactions, and many other forms of corruption are outside its direct measurement scope.
A low percentage should therefore be interpreted narrowly: relatively few surveyed firms reported a bribe request in the covered transactions. Broader conclusions require additional experience surveys, administrative information, and institutional measures.
Complete list of the 181 latest observations
The table below lists the latest non-empty observation for every economy and territory in alphabetical order. The observation year appears next to the value so recent surveys can be distinguished from older ones.
| Economy/territory | Observation year | Firms experiencing at least one bribe request |
|---|---|---|
| Afghanistan | 2025 | 9.49% |
| Albania | 2025 | 15.12% |
| Algeria | 2007 | 18.80% |
| Angola | 2024 | 21.51% |
| Antigua and Barbuda | 2025 | 5.50% |
| Argentina | 2017 | 9.27% |
| Armenia | 2024 | 0.19% |
| Australia | 2025 | 2.51% |
| Austria | 2025 | 2.47% |
| Azerbaijan | 2024 | 0.75% |
| Bahamas, The | 2010 | 21.00% |
| Bahrain | 2024 | 4.31% |
| Bangladesh | 2022 | 22.99% |
| Barbados | 2023 | 0.00% |
| Belarus | 2018 | 4.91% |
| Belgium | 2025 | 5.72% |
| Belize | 2025 | 10.78% |
| Benin | 2024 | 11.36% |
| Bhutan | 2024 | 0.30% |
| Bolivia | 2025 | 14.56% |
| Bosnia and Herzegovina | 2023 | 3.51% |
| Botswana | 2023 | 6.14% |
| Brazil | 2025 | 9.83% |
| Brunei Darussalam | 2025 | 3.30% |
| Bulgaria | 2023 | 0.92% |
| Burkina Faso | 2024 | 14.12% |
| Burundi | 2025 | 14.01% |
| Cabo Verde | 2024 | 1.39% |
| Cambodia | 2023 | 27.09% |
| Cameroon | 2024 | 21.65% |
| Canada | 2024 | 5.82% |
| Central African Republic | 2023 | 22.64% |
| Chad | 2023 | 34.27% |
| Chile | 2025 | 2.64% |
| China | 2024 | 0.14% |
| Colombia | 2023 | 2.75% |
| Comoros | 2025 | 9.03% |
| Congo, Dem. Rep. | 2024 | 28.54% |
| Congo, Rep. | 2024 | 27.33% |
| Costa Rica | 2023 | 5.60% |
| Cote d’Ivoire | 2023 | 19.85% |
| Croatia | 2023 | 6.84% |
| Cyprus | 2024 | 5.73% |
| Czechia | 2025 | 2.57% |
| Denmark | 2025 | 1.79% |
| Djibouti | 2025 | 40.25% |
| Dominica | 2010 | 5.83% |
| Dominican Republic | 2025 | 6.31% |
| Ecuador | 2024 | 14.40% |
| Egypt, Arab Rep. | 2025 | 3.06% |
| El Salvador | 2023 | 3.12% |
| Equatorial Guinea | 2024 | 40.50% |
| Eritrea | 2009 | 0.00% |
| Estonia | 2023 | 0.00% |
| Eswatini | 2024 | 7.59% |
| Ethiopia | 2025 | 17.68% |
| Fiji | 2025 | 6.89% |
| Finland | 2025 | 0.24% |
| France | 2025 | 0.74% |
| Gabon | 2025 | 20.55% |
| Gambia, The | 2023 | 20.10% |
| Georgia | 2023 | 1.00% |
| Germany | 2025 | 0.10% |
| Ghana | 2023 | 16.96% |
| Greece | 2023 | 5.46% |
| Grenada | 2025 | 7.16% |
| Guatemala | 2025 | 7.10% |
| Guinea | 2025 | 7.60% |
| Guinea-Bissau | 2025 | 27.64% |
| Guyana | 2010 | 14.88% |
| Honduras | 2016 | 8.75% |
| Hong Kong SAR, China | 2023 | 2.56% |
| Hungary | 2023 | 1.20% |
| Iceland | 2024 | 0.74% |
| India | 2025 | 8.74% |
| Indonesia | 2023 | 20.34% |
| Iraq | 2022 | 50.47% |
| Ireland | 2024 | 0.25% |
| Israel | 2024 | 28.50% |
| Italy | 2024 | 2.61% |
| Jamaica | 2024 | 1.89% |
| Japan | 2025 | 0.00% |
| Jordan | 2024 | 3.86% |
| Kazakhstan | 2024 | 16.42% |
| Kenya | 2025 | 33.19% |
| Kiribati | 2025 | 48.11% |
| Korea, Rep. | 2024 | 0.02% |
| Kosovo | 2025 | 2.06% |
| Kuwait | 2025 | 0.09% |
| Kyrgyz Republic | 2023 | 31.41% |
| Lao PDR | 2024 | 30.60% |
| Latvia | 2024 | 0.04% |
| Lebanon | 2019 | 21.79% |
| Lesotho | 2023 | 7.27% |
| Liberia | 2025 | 20.58% |
| Lithuania | 2025 | 0.00% |
| Luxembourg | 2020 | 0.00% |
| Madagascar | 2022 | 19.19% |
| Malawi | 2025 | 26.03% |
| Malaysia | 2024 | 3.80% |
| Maldives | 2025 | 2.59% |
| Mali | 2024 | 3.99% |
| Malta | 2024 | 2.97% |
| Mauritania | 2025 | 29.44% |
| Mauritius | 2023 | 5.73% |
| Mexico | 2023 | 15.82% |
| Micronesia, Fed. Sts. | 2009 | 4.55% |
| Moldova | 2024 | 7.11% |
| Mongolia | 2025 | 16.09% |
| Montenegro | 2023 | 8.00% |
| Morocco | 2023 | 29.62% |
| Mozambique | 2025 | 22.10% |
| Myanmar | 2016 | 29.33% |
| Namibia | 2024 | 13.77% |
| Nepal | 2023 | 6.17% |
| Netherlands | 2025 | 6.15% |
| New Zealand | 2023 | 3.98% |
| Nicaragua | 2016 | 6.48% |
| Niger | 2025 | 2.86% |
| Nigeria | 2025 | 22.39% |
| North Macedonia | 2023 | 9.56% |
| Norway | 2025 | 0.02% |
| Pakistan | 2022 | 15.90% |
| Panama | 2025 | 7.57% |
| Papua New Guinea | 2024 | 19.38% |
| Paraguay | 2023 | 16.08% |
| Peru | 2023 | 7.60% |
| Philippines | 2023 | 8.33% |
| Poland | 2025 | 8.02% |
| Portugal | 2023 | 7.67% |
| Qatar | 2025 | 9.79% |
| Romania | 2023 | 2.66% |
| Russian Federation | 2019 | 26.80% |
| Rwanda | 2023 | 12.32% |
| Samoa | 2023 | 2.35% |
| Sao Tome and Principe | 2025 | 13.63% |
| Saudi Arabia | 2025 | 9.55% |
| Senegal | 2024 | 1.00% |
| Serbia | 2024 | 2.04% |
| Seychelles | 2023 | 6.88% |
| Sierra Leone | 2023 | 17.96% |
| Singapore | 2023 | 0.58% |
| Slovak Republic | 2023 | 2.06% |
| Slovenia | 2024 | 1.77% |
| Solomon Islands | 2025 | 13.51% |
| Somalia, Fed. Rep. | 2025 | 14.44% |
| South Africa | 2020 | 1.54% |
| South Sudan | 2024 | 27.39% |
| Spain | 2024 | 0.43% |
| Sri Lanka | 2025 | 26.23% |
| St. Kitts and Nevis | 2010 | 2.23% |
| St. Lucia | 2025 | 3.06% |
| St. Vincent and the Grenadines | 2025 | 7.13% |
| Sudan | 2014 | 17.60% |
| Suriname | 2025 | 9.40% |
| Sweden | 2024 | 0.00% |
| Switzerland | 2025 | 0.33% |
| Syrian Arab Republic | 2009 | 69.60% |
| Tajikistan | 2024 | 9.06% |
| Tanzania | 2023 | 6.89% |
| Thailand | 2025 | 19.02% |
| Timor-Leste | 2021 | 9.85% |
| Togo | 2023 | 1.98% |
| Tonga | 2024 | 10.71% |
| Trinidad and Tobago | 2025 | 22.55% |
| Tunisia | 2024 | 8.09% |
| Turkiye | 2024 | 2.43% |
| Turkmenistan | 2024 | 10.63% |
| Uganda | 2025 | 20.45% |
| Ukraine | 2019 | 37.37% |
| United Kingdom | 2024 | 2.07% |
| United States | 2024 | 2.79% |
| Uruguay | 2024 | 1.28% |
| Uzbekistan | 2024 | 7.45% |
| Vanuatu | 2023 | 23.48% |
| Venezuela, RB | 2010 | 10.32% |
| Viet Nam | 2023 | 31.07% |
| West Bank and Gaza | 2023 | 1.07% |
| Yemen, Rep. | 2013 | 64.26% |
| Zambia | 2025 | 6.13% |
| Zimbabwe | 2025 | 44.46% |
How to interpret the comparison
First, this is an experience-based firm survey indicator. Second, it measures whether at least one request occurred, not the number or amount of payments. Third, published zeros are real values rather than imputed missing observations. Fourth, the complete 181-row file is mixed-year data and should not be described as a current single-year world ranking.
Fifth, the measure does not cover every possible form of corruption in an economy. The 62 observations from 2025 provide the strongest current same-year comparison in this file.
Source and calculation
The source is World Bank World Development Indicators, based on Enterprise Surveys, indicator IC.FRM.BRIB.ZS: Bribery incidence (% of firms experiencing at least one bribe payment request). The 2025 mean, median, quartiles, threshold counts, and rankings are calculated from the 62 observations dated 2025.
Frequently Asked Questions
What does the bribery-incidence indicator measure?
It measures the percentage of firms reporting at least one bribe payment request across six public transactions involving utilities, permits, licenses, and taxes.
What is the 2025 median?
The median across the 62 observations dated 2025 is 8.38%, while the mean is 11.78%.
Were published zero values created by filling missing data?
No. They are source values showing an estimated incidence of 0% for the surveyed firms under this indicator definition.
Related Articles
Green Map creates custom-edited map images using open geographic data sources such as geoBoundaries, Natural Earth, OpenStreetMap, and government open data. These maps are edited visual materials, not raw data files, and are provided for education, documents, presentations, and graphic reference.