World Bank indicator NY.GDP.PCAP.KD reports GDP per person in constant 2015 U.S. dollars. The constant-price basis is designed to reduce the effect of price change over time, so it answers a different question from GDP per capita in current U.S. dollars. The full source contains the most recent non-empty observation for 213 economies, but the years are not uniform. There are 186 actual 2025 observations. The map and primary ranking therefore use only that same-year subset, while the older latest-available observations are discussed separately instead of being folded into a false 2025 ranking.
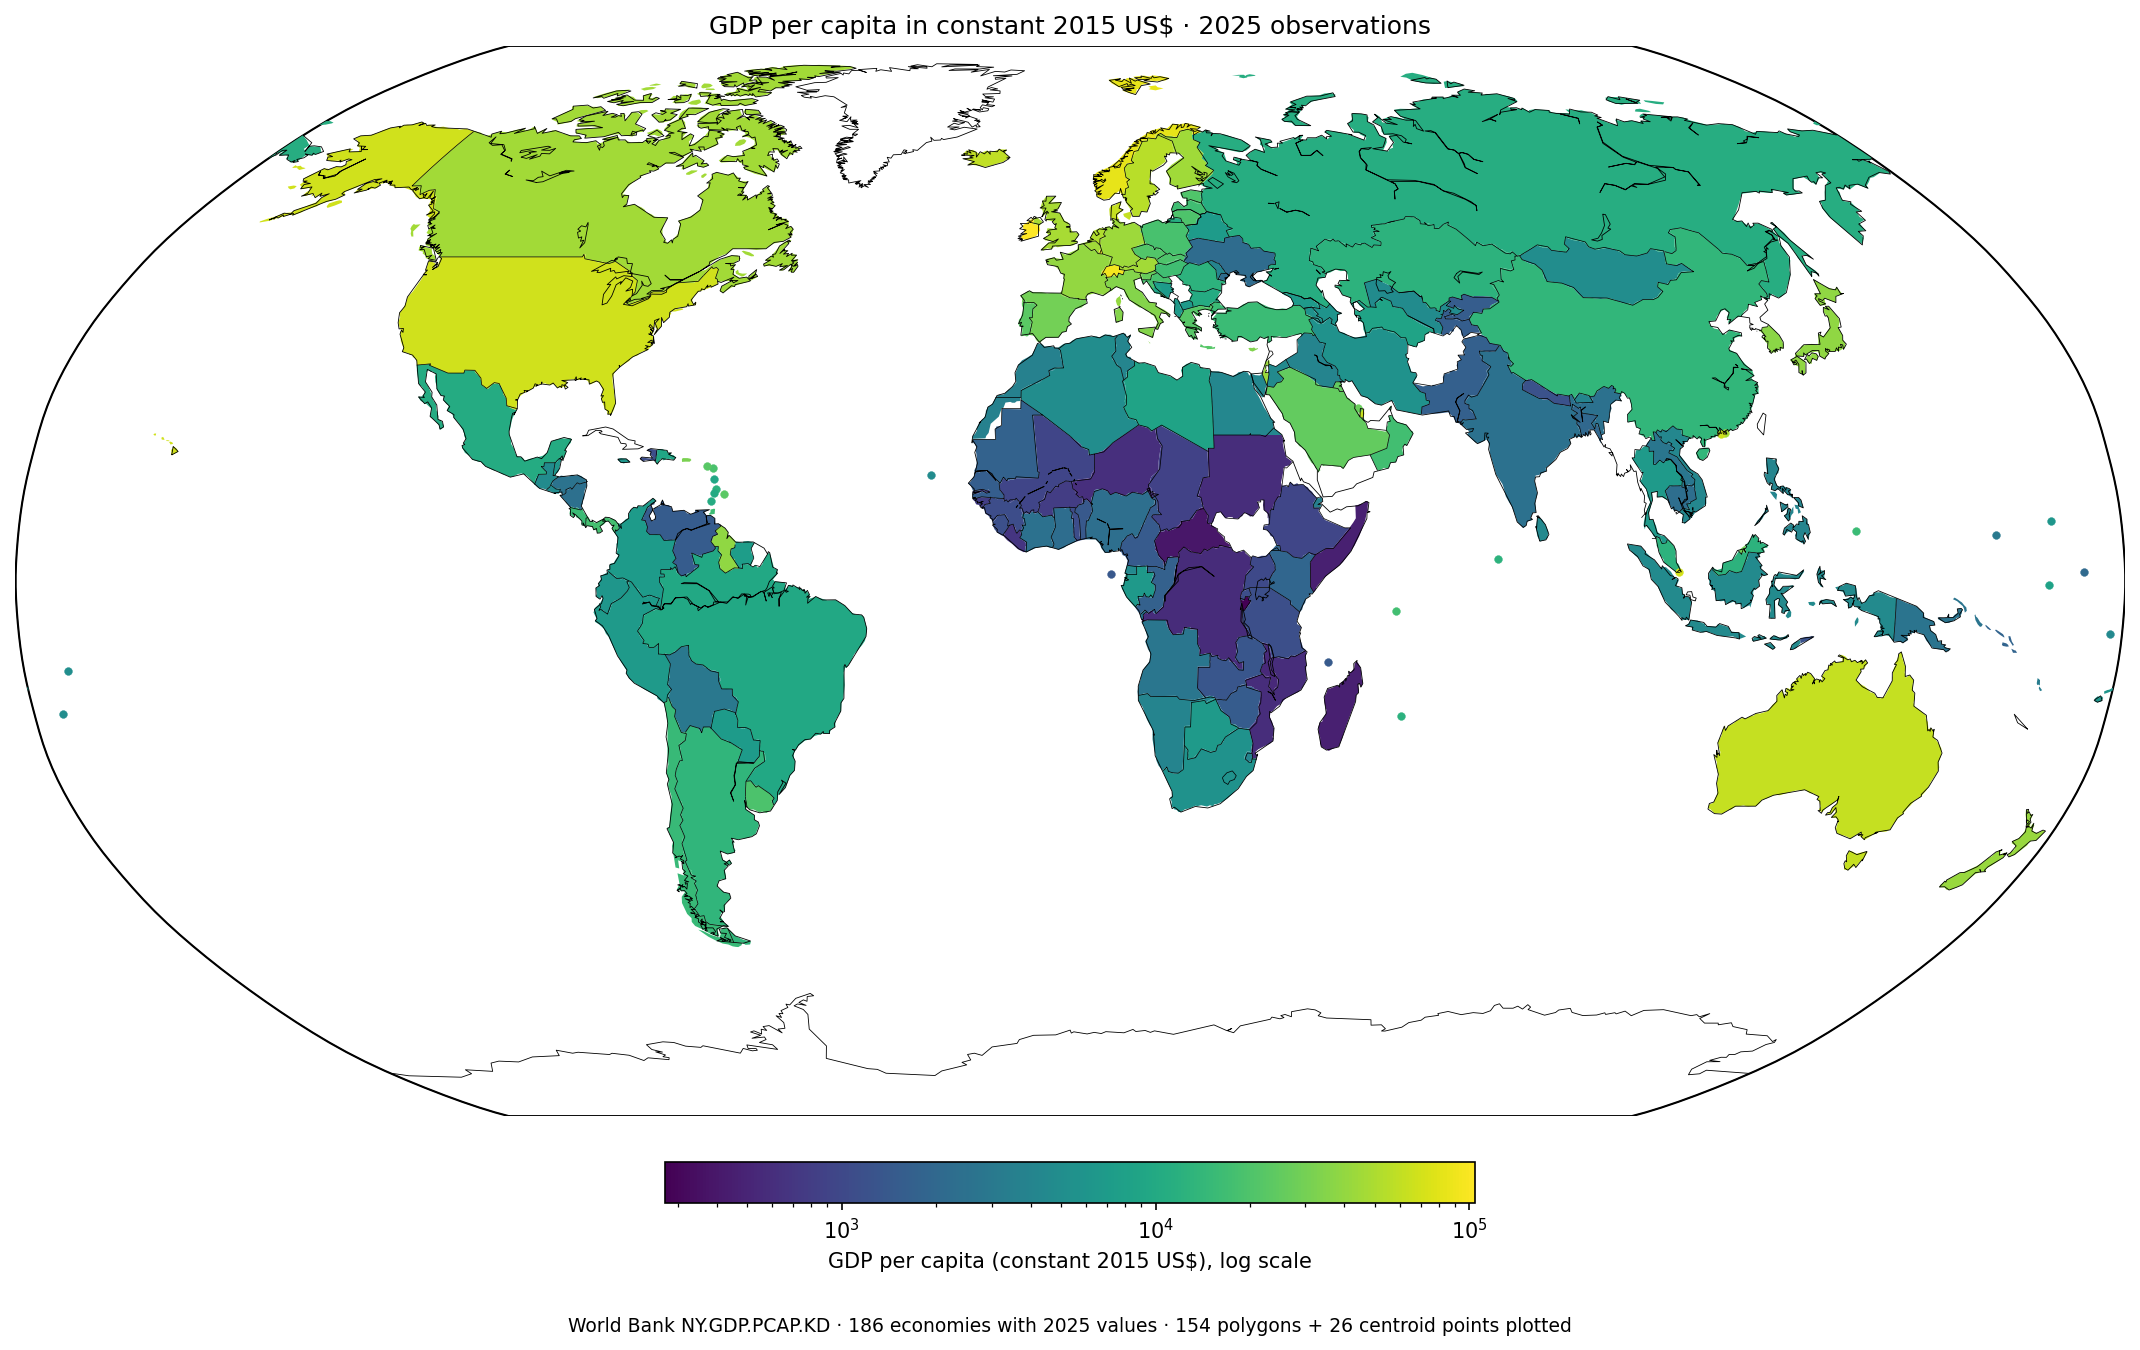
Table of Contents
The 2025 map shows several high-value clusters and wide regional gaps
The same-year map makes the geography easier to read than a simple ranked list. High values are common across much of Northern and Western Europe, with additional high-value economies in North America, Oceania, the Gulf, and parts of East and Southeast Asia. Many economies in Sub-Saharan Africa fall in much lower ranges, while Latin America spans a broad middle band. The pattern is descriptive: the map shows where real GDP per person is high or low under this indicator, but it does not prove why those differences exist.
The visual directly plots 154 economies with filled country geometry and another 26 small economies or territories as centroid points, covering 180 of the 186 observations. Six entries—Andorra, Myanmar, Montenegro, West Bank and Gaza, Sint Maarten (Dutch part), and Kosovo—are not drawn because the available plotting geometry did not provide a compatible boundary or centroid. They are still included in all tables and summary calculations. No missing map position was converted into a zero value.
Ireland and Luxembourg led the 2025 same-year comparison
Among the 186 economies with a 2025 observation, Ireland records about $104,417 per person and Luxembourg about $103,292. Switzerland follows at $93,328 and Norway at $83,813. Singapore reaches $70,684, the United States $67,946, Macao SAR, China $66,444, Denmark $62,218, Qatar $61,735, and Australia $61,369. Because every row in this table is dated 2025 and uses the same constant-2015-dollar unit, it is a cleaner cross-section than a ranking built from the full mixed-year set.
| Rank | Economy | GDP per capita, constant 2015 US$ |
|---|---|---|
| 1 | Ireland | 104,417 |
| 2 | Luxembourg | 103,292 |
| 3 | Switzerland | 93,328 |
| 4 | Norway | 83,813 |
| 5 | Singapore | 70,684 |
| 6 | United States | 67,946 |
| 7 | Macao SAR, China | 66,444 |
| 8 | Denmark | 62,218 |
| 9 | Qatar | 61,735 |
| 10 | Australia | 61,369 |
These values should not be substituted for 2025 current-dollar GDP per capita. Constant 2015 U.S. dollars use a fixed-price framework intended to make real output more comparable through time. Current-dollar values reflect the price and exchange-rate environment of the observation year much more directly. A PPP series adds another adjustment for international price-level differences. Similar article titles can therefore refer to statistically different measures.
The median was about $6,507, much lower than the mean
The 2025 median is $6,507 per person, while the arithmetic mean is about $15,315. The first quartile is roughly $2,281 and the third quartile $19,313. The mean is around 2.4 times the median because a relatively small number of high-value economies pull the average upward. For a strongly skewed cross-country distribution, the median and quartiles provide a better sense of the middle than the mean alone.
| 2025 constant-dollar band | Economies |
|---|---|
| <1,000 | 16 |
| 1,000–4,999 | 66 |
| 5,000–9,999 | 32 |
| 10,000–24,999 | 35 |
| 25,000–49,999 | 24 |
| ≥50,000 | 13 |
Sixteen economies are below $1,000 per person, 66 are between $1,000 and $4,999, 32 are between $5,000 and $9,999, 35 are between $10,000 and $24,999, 24 are between $25,000 and $49,999, and 13 are at or above $50,000. At the lower end, Burundi is about $273, the Central African Republic $394, Madagascar $457, Somalia $465, and Malawi $548. The distance between these values and the upper end makes clear that the global distribution is not tightly clustered around one typical level.
| Lower 2025 observations | GDP per capita |
|---|---|
| Burundi | 273 |
| Central African Republic | 394 |
| Madagascar | 457 |
| Somalia, Fed. Rep. | 465 |
| Malawi | 548 |
| Congo, Dem. Rep. | 568 |
| Sudan | 582 |
| Mozambique | 586 |
| Niger | 610 |
| Liberia | 684 |
Nearby economies can still differ sharply
The map also reveals contrasts inside broadly similar geographic settings. Ireland is above $104,000, whereas the United Kingdom is about $48,422 and France about $39,919. In Northern Europe, Norway is $83,813, Denmark $62,218, Iceland $58,910, Sweden $55,014, and Finland $44,941. These economies all sit toward the high end globally, yet the differences inside the regional cluster are still substantial.
The Gulf shows another spread: Qatar is about $61,735, Bahrain $26,592, Saudi Arabia $25,066, Kuwait $24,963, and Oman $17,074. In East and Southeast Asia, Singapore is $70,684, Macao SAR $66,444, Hong Kong SAR $46,450, Japan $38,619, and China $13,793. South America also forms a gradient, from Uruguay at $19,375 and Chile at $14,905 to Argentina at $13,287, Brazil at $9,748, Paraguay at $7,029, and Bolivia at $2,957.
These geographic contrasts are useful for identifying where the indicator changes quickly across neighboring or nearby economies. They do not identify a cause. Production structure, population, institutions, resource endowments, measurement conventions, and many other variables may matter, but the single GDP-per-capita series cannot separate those influences.
Constant 2015 US$ is neither current US$ nor PPP
The phrase ‘constant 2015 U.S. dollars’ is the statistical identity of the series. A constant-price GDP measure removes general price change from the time series using a fixed reference framework, making it useful for examining real output levels and changes. Current-dollar GDP per capita instead uses contemporaneous prices and is more exposed to the exchange-rate and price environment of each year. That is why a current-dollar ranking can differ even when the underlying economy and year are the same.
Purchasing-power-parity GDP per capita answers another question again. PPP conversion is intended to account for differences in price levels across economies, so it can materially change international comparisons. Constant market-exchange-rate dollars do not become PPP dollars simply because inflation has been adjusted. Current US$, constant 2015 US$, and PPP international dollars should therefore remain separate in titles, tables, and internal links.
The full 213-row latest-available set spans 2011 to 2025
Of the 213 most recent non-empty observations, 186 are from 2025, 13 from 2024, four from 2023, five from 2022, one from 2018, three from 2015, and one from 2011. The 2025 share is 87.3%, which is high but not complete. Sorting all 213 rows can be useful as a latest-available reference, but calling it a 2025 world ranking would hide meaningful differences in observation date.
| Latest observation year | Economies |
|---|---|
| 2025 | 186 |
| 2024 | 13 |
| 2023 | 4 |
| 2022 | 5 |
| 2018 | 1 |
| 2015 | 3 |
| 2011 | 1 |
The median across all 213 latest values is about $6,938, and the mean is about $19,420. Those summary values mix years. Monaco, for example, has a 2024 latest observation near $247,170, while Liechtenstein’s latest value in the source is a 2015 observation near $167,187. Both exceed the 2025 leaders numerically, but neither belongs in a strict 2025 ranking. The observation year is therefore part of the data, not a minor footnote.
GDP per capita is an average output measure, not household income
GDP per capita divides an economy’s total production by population. It does not report the income received by a typical household, the median wage, household wealth, or the distribution of resources inside the economy. A high value can coexist with large differences among households, and the indicator says nothing directly about housing affordability, public services, working hours, or wealth distribution. Those questions require different measures.
The level also should not be read as a growth rate. A high 2025 value tells us the scale of real output per person in that year under the constant-price measure; it does not say how quickly the economy grew from 2024. Growth analysis requires multiple observations from the same series or a dedicated GDP-per-capita growth indicator. Level and change are separate dimensions.
Five checks make the comparison safer
- Use the exact series NY.GDP.PCAP.KD and keep the unit as constant 2015 U.S. dollars per person.
- Use the 186 actual 2025 observations for a same-year map and ranking.
- Do not label all 213 latest-available values as 2025 because 27 observations are older.
- Keep constant US$, current US$, and PPP international dollars separate.
- Treat GDP per capita as average economic output per person, not as median household income, cost of living, wealth, or a growth rate.
The direct numerical source is the World Bank NY.GDP.PCAP.KD API series. The analysis prioritizes the 2025 cross-section and preserves the reported observation year for economies whose latest value is older.
Frequently Asked Questions
Is GDP per capita in constant 2015 US$ the same as current-dollar GDP per capita?
No. Constant 2015 US$ is a fixed-price real series, while current-dollar GDP per capita reflects the price and exchange-rate environment of the observation year more directly.
Are all 213 latest observations from 2025?
No. There are 186 observations from 2025 and 27 from earlier years between 2011 and 2024. The 2025 map and ranking therefore use only the 186 same-year observations.
Is constant-dollar GDP per capita the same as PPP GDP per capita?
No. Constant dollars adjust price change through time, while PPP uses a separate conversion intended to account for differences in price levels across economies.
Related Articles
Green Map creates custom-edited map images using open geographic data sources such as geoBoundaries, Natural Earth, OpenStreetMap, and government open data. These maps are edited visual materials, not raw data files, and are provided for education, documents, presentations, and graphic reference.