Building-energy methane emissions vary sharply across economies in the World Bank’s 2024 data. Indicator EN.GHG.CH4.BU.MT.CE.AR5 reports methane (CH₄) emissions from the Building (Energy) sector in million tonnes of CO₂ equivalent. There are 197 numeric country and economy observations for 2024, while 20 geographic units have no source value and remain missing. The measure is narrow in two important ways: it covers methane rather than all greenhouse gases, and it uses CO₂e rather than the physical mass of methane. Those distinctions should remain attached to every comparison.
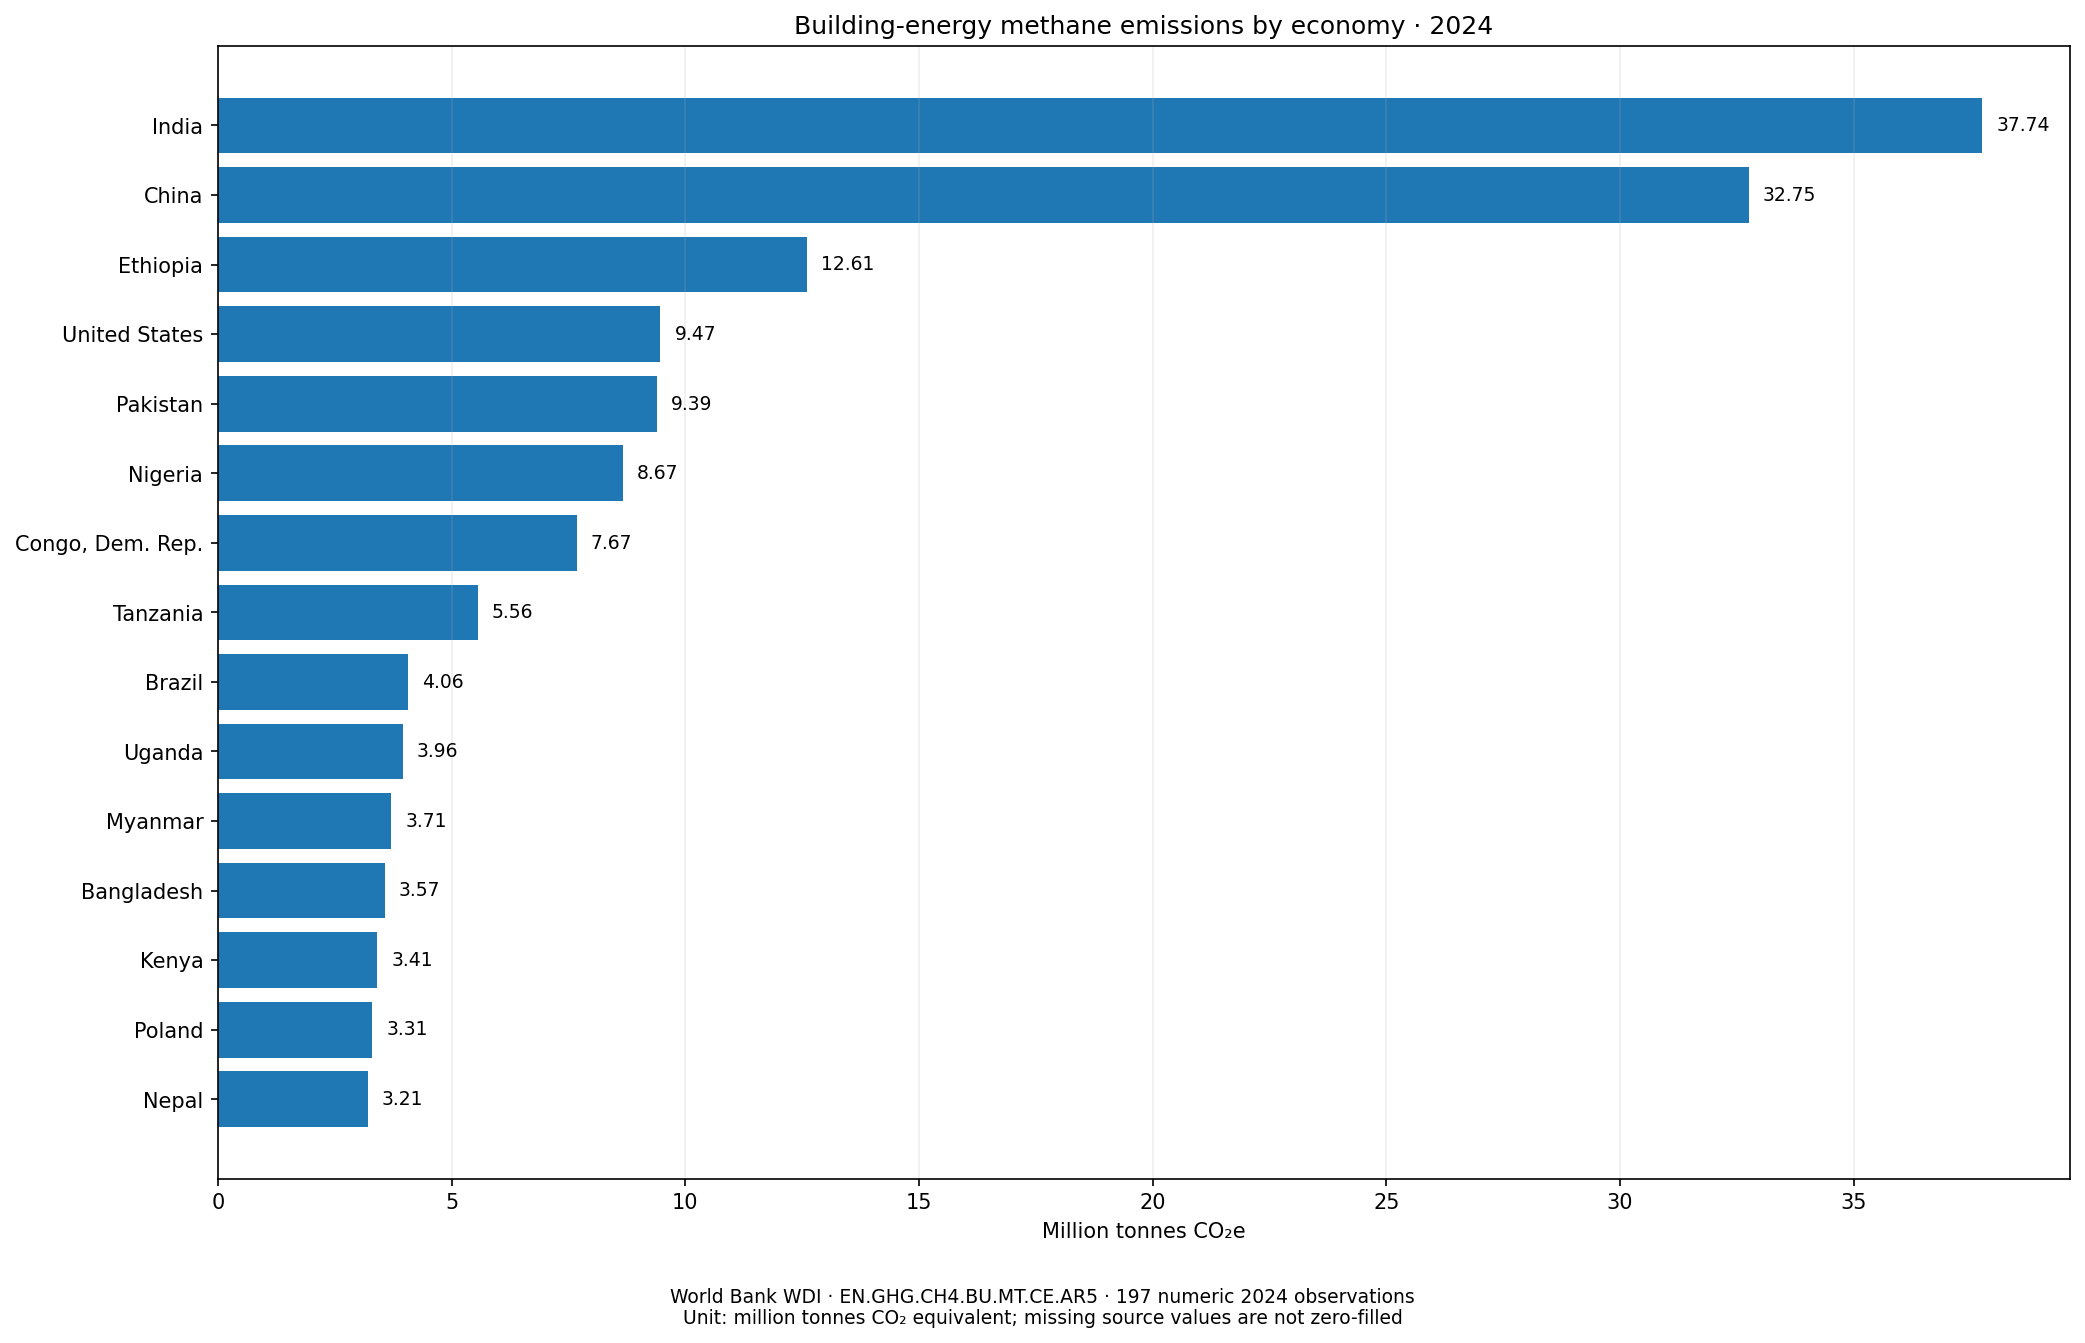
Table of Contents
India and China recorded the largest 2024 values
India is the largest reported observation at 37.7438 Mt CO₂e, followed by China at 32.7488. Ethiopia is third at 12.6055. The United States records 9.4704, Pakistan 9.3865, Nigeria 8.6675, the Democratic Republic of the Congo 7.6738, Tanzania 5.5615, Brazil 4.0610, and Uganda 3.9570. Summing the 197 numeric observations gives 231.7942 Mt CO₂e. India accounts for 16.28% of that arithmetic sum, the top three for 35.85%, and the top ten for 56.89%. The 197-row sum is an analytical total of the reported observations, not a separately published official global total.
| Rank | Economy | 2024 emissions | Share of 197-row sum |
|---|---|---|---|
| 1 | India | 37.7438 | 16.28% |
| 2 | China | 32.7488 | 14.13% |
| 3 | Ethiopia | 12.6055 | 5.44% |
| 4 | United States | 9.4704 | 4.09% |
| 5 | Pakistan | 9.3865 | 4.05% |
| 6 | Nigeria | 8.6675 | 3.74% |
| 7 | Congo, Dem. Rep. | 7.6738 | 3.31% |
| 8 | Tanzania | 5.5615 | 2.40% |
| 9 | Brazil | 4.0610 | 1.75% |
| 10 | Uganda | 3.9570 | 1.71% |
Concentration remains visible beyond the leaders. The top five observations account for 43.99% of the 197-row sum, while the top 20 account for 69.79%. These are absolute emissions, so the table should not be interpreted as an efficiency ranking. No population, building stock, floor area, energy consumption, or economic-output denominator is applied. An economy can have a large absolute value because of scale while having a very different per-capita or per-unit-energy profile.
The median is 0.237 Mt CO₂e, far below the mean
The arithmetic mean across 197 numeric observations is 1.1766 Mt CO₂e, but the median is only 0.2370. The first quartile is 0.0150 and the third quartile 0.8326. The mean is roughly 5.0 times the median, reflecting a strongly right-skewed distribution in which a small group of large observations pulls the average upward. For describing the middle of the country distribution, the median and quartiles are therefore more representative than the mean alone.
The lower end is broad. There are 82 observations below 0.1 Mt CO₂e and 45 below 0.01. At the other end, 43 observations are at least 1 Mt CO₂e, 8 are at least 5, and only 3 reach 10 or more. Five observations are published as exactly zero. This combination of a few large emitters and many small values explains why a linear chart compresses much of the lower part of the distribution.
197 numeric values and 20 missing source observations must stay separate
The non-aggregate World Bank master coverage for 2024 contains 217 country and economy rows. Of these, 197 have numeric values and 20 are missing at source. The missing set includes Andorra, American Samoa, the Federated States of Micronesia, Liechtenstein, Monaco, Montenegro, Serbia, South Sudan, Tuvalu, Kosovo and several other separately reported units. They are not interpreted as zero emissions and are excluded from the descriptive calculations.
That is different from the five economies for which the source publishes an actual zero: the Faroe Islands, Gibraltar, Grenada, St. Kitts and Nevis, and the U.S. Virgin Islands. A visualization that paints missing observations as zero would manufacture evidence that is not present. Conversely, treating official zeros as missing would discard reported information. Because geographic-boundary join coverage was not independently verified for every economy, the visual used here is a top-15 bar chart rather than a choropleth that could overstate spatial completeness.
Mt CO₂e is not the physical mass of methane
The indicator name contains methane, but its unit is million tonnes of CO₂ equivalent. The value therefore represents methane emissions expressed on a CO₂e basis rather than millions of tonnes of CH₄ molecules. The AR5 suffix is part of the indicator identity and distinguishes this CO₂e series from other possible conversion versions. Values from a physical-methane-mass series or a differently specified CO₂e series should not be spliced into this one without checking the definition.
CO₂e creates a common accounting unit for climate gases, but this indicator still covers methane only. It is not the sum of carbon dioxide, nitrous oxide, methane and fluorinated gases from buildings. Nor is it a country’s total methane inventory. Methane assigned to agriculture, waste, industry or other energy subsectors lies outside the Building (Energy) series and requires separate indicators.
Building (Energy) is a specific sector label
The sector label should be preserved rather than broadened into ‘all emissions from buildings.’ EN.GHG.CH4.BU.MT.CE.AR5 refers to methane allocated to the Building (Energy) category in the World Bank series. Methane from waste management, agriculture, industrial processes or other energy categories should not be added merely because it may occur near or within built environments. The validity of the country comparison depends on keeping the sector boundary fixed.
This also matters for duplicate detection. A page about building carbon dioxide, total building greenhouse gases, or national methane emissions can sound similar in a headline but represent a different metric. Gas, sector, unit, conversion basis, year and indicator code together define the statistical identity more reliably than title wording.
The country ordering does not identify the cause of emissions
India, China and Ethiopia have the three largest reported absolute values, but the single indicator does not explain why. Population, building-energy demand, fuel mix, heating and cooking systems, climate, infrastructure, and inventory methods are examples of factors that could matter in a fuller study, yet they are not variables in this table. Assigning one cause to a high or low value would go beyond the evidence supplied by EN.GHG.CH4.BU.MT.CE.AR5.
The same limitation applies to time. A single 2024 cross-section cannot show whether emissions are increasing or decreasing. A trend analysis would require earlier observations from the same indicator definition. Combining another AR version, another greenhouse gas, or another building-sector series with the 2024 value could create an apparent change that comes from a definition shift rather than a real emissions change.
Absolute emissions and emissions intensity answer different questions
Absolute values are useful for identifying where the reported quantity is largest. They are less suitable for judging relative performance. A per-capita comparison would divide by population; an energy-intensity comparison would use building-energy consumption or another compatible activity measure; a floor-area measure would answer another question again. None of those denominators is part of this series, so no such intensity ranking is constructed here.
For the same reason, the top-ten table should be read as a scale comparison, not a league table of climate performance. Describing an economy as inefficient, highly polluting per person, or weak on mitigation would require additional evidence. The World Bank value alone supports a narrower statement: the amount of Building (Energy) methane emissions expressed in Mt CO₂e for 2024.
Five checks keep the interpretation precise
- Use the exact indicator identity: EN.GHG.CH4.BU.MT.CE.AR5, Building (Energy), methane, 2024.
- Keep the unit as million tonnes CO₂e; do not relabel it as million tonnes of physical CH₄.
- Calculate from the 197 numeric observations and leave the 20 source-missing geographic units unfilled.
- Treat the country values as absolute emissions, not per-capita, per-building, or per-unit-energy intensities.
- Do not infer causes or trends from a single-year cross-section.
The direct source is the World Bank World Development Indicators EN.GHG.CH4.BU.MT.CE.AR5 API series. The comparison uses 2024 non-aggregate country and economy observations, preserves source missing values, and does not impute absent entries.
Frequently Asked Questions
Which economy had the largest 2024 Building (Energy) methane emissions?
Among the 197 numeric observations, India was highest at 37.7438 Mt CO₂e, followed by China at 32.7488 and Ethiopia at 12.6055.
Does Mt CO₂e mean the physical mass of methane?
No. The indicator expresses methane emissions in carbon-dioxide-equivalent terms. Million tonnes CO₂e should not be relabeled as million tonnes of CH₄.
Were missing economies counted as zero?
No. The 2024 master coverage has 217 non-aggregate rows, 197 with numeric values and 20 missing at source. Missing values remain missing.
Related Articles
Green Map creates custom-edited map images using open geographic data sources such as geoBoundaries, Natural Earth, OpenStreetMap, and government open data. These maps are edited visual materials, not raw data files, and are provided for education, documents, presentations, and graphic reference.