The 2025 UNESCO Institute for Statistics data show an exceptionally wide spread in the share of female youth of upper-secondary-school age who are out of school. The file contains 206 national country or territory observations, all dated 2025, so the values can be compared without mixing years. Afghanistan is at 100.0%, Niger at 86.9%, and Mali at 80.5%. At the other end, five official observations are exactly 0.0%. The contrast is therefore not a small difference around a common global level; it spans the full range from zero to one hundred percent.
The series is ROFST.MOD.3.F, labelled by UIS as “Out-of-school rate for youth of upper secondary school age, female (modelled data) (%)”. The most direct reading is the percentage of female youth in the relevant upper-secondary-school-age group that the UIS indicator classifies as out of school. A value of 30% represents a much larger out-of-school share than a value of 5%. Because the series is explicitly marked as modelled data, the published estimates should be kept distinct from raw administrative counts or a differently constructed national series.
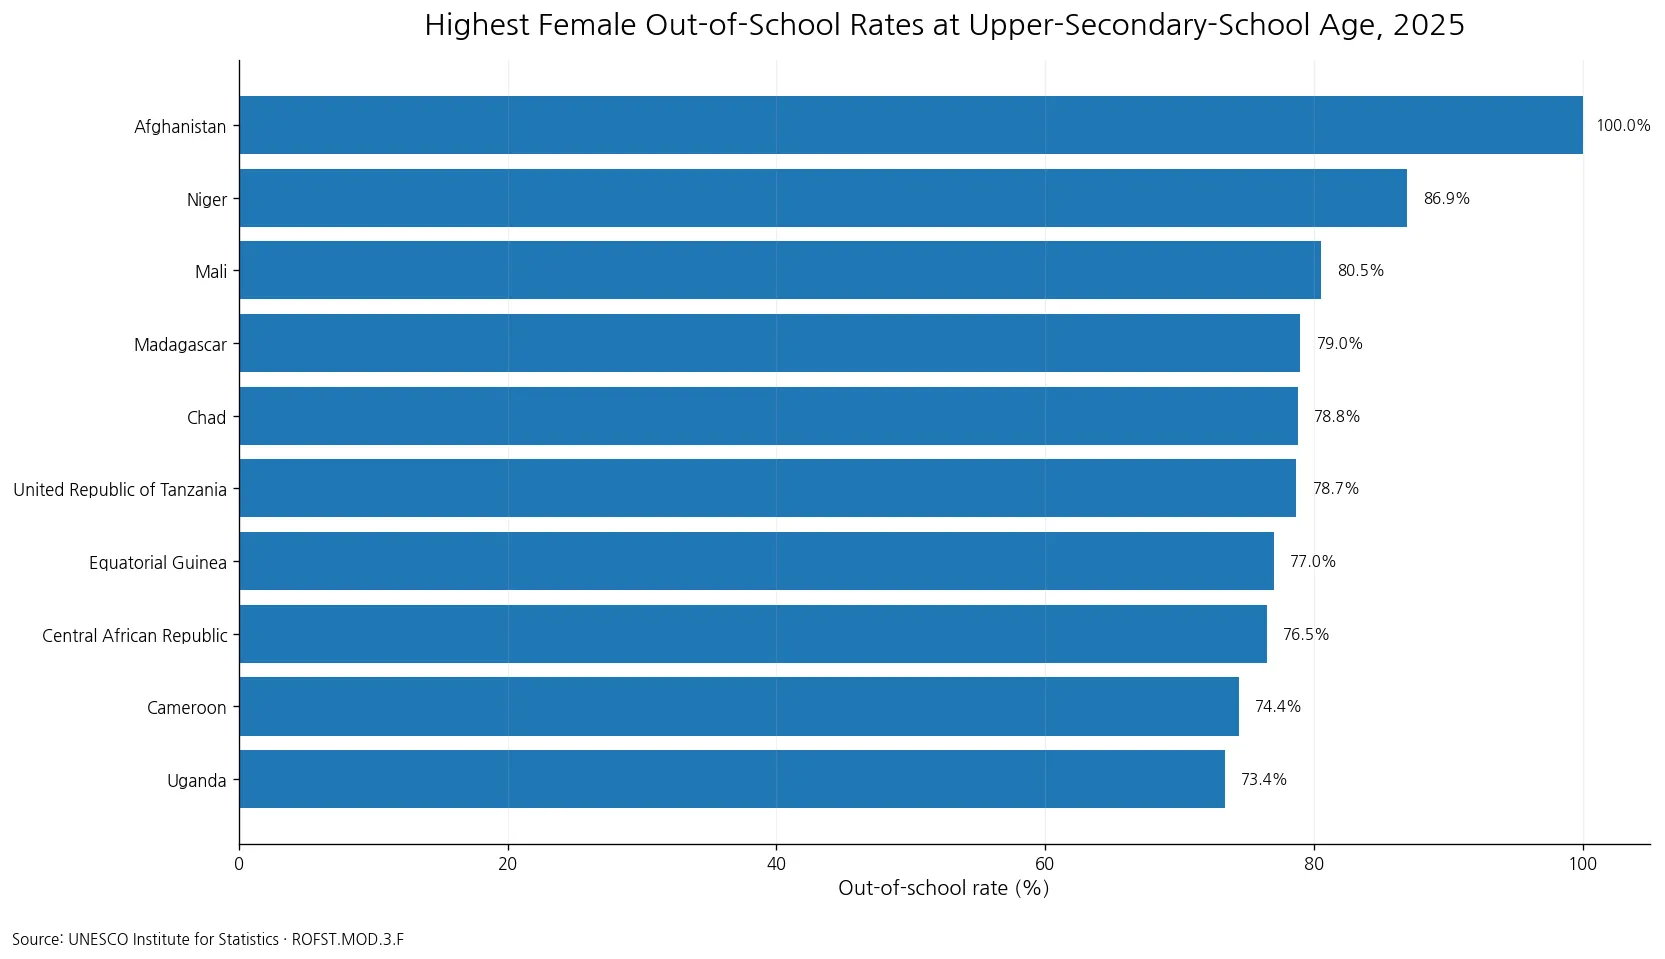
Table of Contents
The median was 16.0%, while the mean was 24.4%
Across the 206 observations, the mean is 24.4% and the median is 16.0%. The eight-point gap between them matters because it signals a distribution pulled upward by a group of very high values. The first quartile is 5.8% and the third quartile is 37.6%, placing the middle half of observations roughly between those two levels. For a skewed cross-country indicator, the median and quartiles describe the typical range more clearly than the arithmetic mean alone.
The distribution is also easy to see in counts. There are 45 observations below 5%, 79 from 5% to below 20%, 46 from 20% to below 50%, 28 from 50% to below 75%, and 8 at 75% or higher. A total of 36 countries or territories are at 50% or above, while 75 are at 10% or below. These bands are analytical cutoffs used to describe the dataset, not official UIS performance categories.
The highest values were far above the global middle
The top of the 2025 distribution is concentrated at very high percentages. Afghanistan records 100.0%, followed by Niger at 86.9% and Mali at 80.5%. Madagascar is at 79.0%, Chad at 78.8%, Tanzania at 78.7%, Equatorial Guinea at 77.0%, and the Central African Republic at 76.5%. Cameroon and Uganda complete the top ten at 74.4% and 73.4%. Every one of these observations is more than four times the global median except where the ratio is already capped by the percentage scale.
| Country or territory | Female out-of-school rate, 2025 |
|---|---|
| Afghanistan | 100.0% |
| Niger | 86.9% |
| Mali | 80.5% |
| Madagascar | 79.0% |
| Chad | 78.8% |
| United Republic of Tanzania | 78.7% |
| Equatorial Guinea | 77.0% |
| Central African Republic | 76.5% |
| Cameroon | 74.4% |
| Uganda | 73.4% |
The spacing within the top ten is uneven. Afghanistan is 13.1 percentage points above Niger, while several observations from Madagascar through the Central African Republic are separated by only a few points. That is why ordinal rank by itself is not enough. A country can move several positions when values are tightly clustered without experiencing a large substantive difference, whereas the gap between the first and second observations is visibly larger. Reading both rank and percentage prevents the list from overstating small differences.
Official zeros must remain zeros, not missing values
The source metadata records 5 official zeros and no missing values among the 206 included rows. Ireland, Japan, Latvia, Saudi Arabia, and Sint Maarten (Dutch part) are recorded at 0.0%. Portugal is at 0.1%; Australia and Georgia are at 0.2%; Aruba and the United Arab Emirates are at 0.3%. Those numbers are part of the official series and should not be replaced with blanks simply because a zero can look unusual in an education indicator.
| Country or territory | Female out-of-school rate, 2025 |
|---|---|
| Ireland | 0.0% |
| Japan | 0.0% |
| Latvia | 0.0% |
| Saudi Arabia | 0.0% |
| Sint Maarten (Dutch part) | 0.0% |
| Portugal | 0.1% |
| Australia | 0.2% |
| Georgia | 0.2% |
| Aruba | 0.3% |
| United Arab Emirates | 0.3% |
The opposite distinction is just as important. The metadata also identifies catalogue units that are not reported in this particular observation file. An absent unit is not equivalent to a 0.0% observation. Filling absent geographies with zero would create false low values, alter the mean, and distort any map. The clean dataset therefore preserves official zeros while leaving unreported catalogue units outside the 206 observed national rows.
The ‘modelled data’ label is part of the indicator identity
The word modelled is not a decorative note. It is embedded in the official series name and should travel with the number whenever this indicator is compared with another source. Model-based international series are useful because they provide a consistent statistical framework, but they are not automatically interchangeable with an administrative school census, a household survey estimate, or another UIS series that uses a different construction. Matching the indicator code is the safest way to avoid accidental substitutions.
Small decimal differences deserve proportionate caution. A gap of 0.1 or 0.2 percentage points may affect rank but should not automatically be described as a meaningful policy separation. Large differences are easier to interpret: a country near 75% is plainly in a different part of this distribution from one near the 16% median. The article therefore emphasizes broad levels, quartiles, and large gaps rather than pretending that every adjacent rank represents a major distinction.
This is a female-specific series, not the total-youth rate
ROFST.MOD.3.F fixes the sex dimension at female. It should not be merged with a rate for both sexes or with the corresponding male series as if all three measured the same population. An all-youth out-of-school article can answer a related question, but this dataset answers a narrower one: how the out-of-school rate among female youth of upper-secondary-school age differs across countries and territories in 2025.
The female series alone also cannot measure a gender gap. To say whether girls have a higher or lower out-of-school rate than boys, the matching male series would be required for the same year, age level, geography, and modelling status. Subtracting a female value from a non-matching total or from a different year would produce a misleading comparison. The current dataset supports cross-country comparison within the female population, not a complete assessment of sex disparities.
A single-year snapshot describes levels, not change
All rows are from 2025, which is an advantage for cross-sectional comparison. It avoids the common problem of ranking countries whose latest values come from different years. The trade-off is that the file says nothing by itself about direction of change. Afghanistan’s 100.0% does not reveal whether its rate rose or fell from 2024, and Niger’s 86.9% does not establish a long-term trend.
A time-series analysis would need earlier or later ROFST.MOD.3.F observations with the same definitions. Only then would it be appropriate to calculate year-over-year change, multi-year improvement, or volatility. The present snapshot is instead suited to questions such as where the 2025 level was highest, how many observations exceeded 50%, where the median sat, and how wide the cross-country distribution was.
The dataset does not identify the causes of high values
High out-of-school rates can coexist with many different social, economic, institutional, demographic, or security conditions, but none of those explanatory variables is contained in this file. The data therefore establish the level of the indicator, not a causal story. Explaining a specific country’s result would require additional official evidence on education access, enrollment, population estimates, local conditions, and other relevant factors.
The same restraint applies to low values. A very low female out-of-school rate is important information about this specific access measure, but it does not summarize learning outcomes, education quality, completion, school safety, or inequality within the school system. Keeping those concepts separate prevents one percentage from being turned into an overall score for a national education system.
Coverage is 206 observed national rows, not every possible catalogue unit
The verified file contains 206 country or territory observations with no missing value inside those rows. UIS metadata also lists catalogue units that are not reported here. That means the number 206 should be read as the observed NATIONAL coverage for this series and year, not as a claim that every geographic unit in the wider catalogue has a reported value.
This distinction matters for visualization. A world map should only shade units that can be matched to actual observations and should leave unmatched or unreported areas as no data. The representative image in this article avoids uncertain boundary matching altogether and uses a bar chart built directly from the verified top ten values. No unreported geography is assigned a substitute value.
The shape of the distribution is more informative than one global average
If the mean of 24.4% were the only number shown, readers might imagine a fairly uniform world clustered around one quarter. The median of 16.0% tells a different story. More than half of the observations are below 20%, while a smaller set of very high values stretches the upper tail. The 8 observations at 75% or above are few in number, yet their magnitude raises the mean.
Threshold counts make that structure concrete. 36 of 206 observations are at least 50%, which means 170 are below one half. At the low end, 45 are below 5%. These cutoffs are not value judgments; they are simple descriptive tools. Used alongside quartiles and the top and bottom tables, they show why a single rank or average cannot capture the entire 2025 pattern.
How to compare this series without changing its meaning
A reliable comparison keeps the indicator identity intact: female, upper-secondary-school age, out-of-school rate, modelled data, percent, and 2025. Changing any one of those dimensions creates a related but different series. A male value, a total-sex value, a primary-school-age rate, or an observation from 2024 may all be relevant to a broader analysis, but they should be labelled separately rather than inserted into this ranking.
The same principle applies when combining the series with other indicators. A comparison with upper-secondary attainment, youth not in employment or education, or enrollment can add context, but none is a substitute for the out-of-school rate. Each has a different numerator, denominator, age definition, or outcome concept. Clear labels let readers use several education measures without collapsing them into one.
Summary: the 2025 female out-of-school distribution was extremely wide
In 2025, the 206 observed country and territory values for female youth of upper-secondary-school age had a median of 16.0% and a mean of 24.4%. Afghanistan was highest at 100.0%, followed by Niger at 86.9% and Mali at 80.5%. 8 observations were at least 75%, 36 were at least 50%, and 45 were below 5%. Five official values were exactly zero.
Those facts are most useful when the scope is kept precise. This is a female-specific, modelled UIS percentage for one age level and one year. It is not automatically a gender-gap measure, a trend measure, or an overall rating of an education system. Within its proper scope, however, it provides a consistent 2025 cross-country view of how sharply the female out-of-school rate differs across the observed national units.
Frequently Asked Questions
Which country had the highest female out-of-school rate at upper-secondary-school age in 2025?
Afghanistan recorded 100.0% in the UNESCO UIS ROFST.MOD.3.F series, followed by Niger at 86.9% and Mali at 80.5%.
Are the 0.0% values missing data?
No. Five rows are official zero observations. Catalogue units that were not reported are treated separately and are not filled with zero.
Can this female series be used by itself to calculate a gender gap?
No. A gender-gap calculation requires the corresponding male series with the same year, age level, geography, and modelling status.
Related Articles
Green Map creates custom-edited map images using open geographic data sources such as geoBoundaries, Natural Earth, OpenStreetMap, and government open data. These maps are edited visual materials, not raw data files, and are provided for education, documents, presentations, and graphic reference.