World Bank indicator NV.MNF.CHEM.ZS.UN measures chemicals and chemical products as a percentage of total manufacturing value added. The chemical category follows ISIC Revision 3 division 24. Value added is the contribution generated after intermediate consumption is deducted from output, so the indicator describes the structure of manufacturing value added rather than physical production, sales or export value.
The available figures contain the most recent non-missing observation for 161 economies, but the reference years range from 1973 to 2024. Only 13 observations are from 2024, while 61 are from 2023. A single current ranking of all 161 would therefore mix decades of industrial change with cross-country differences. The main comparison below uses the 61 economies observed in 2023, with the 13 newer 2024 observations shown separately.
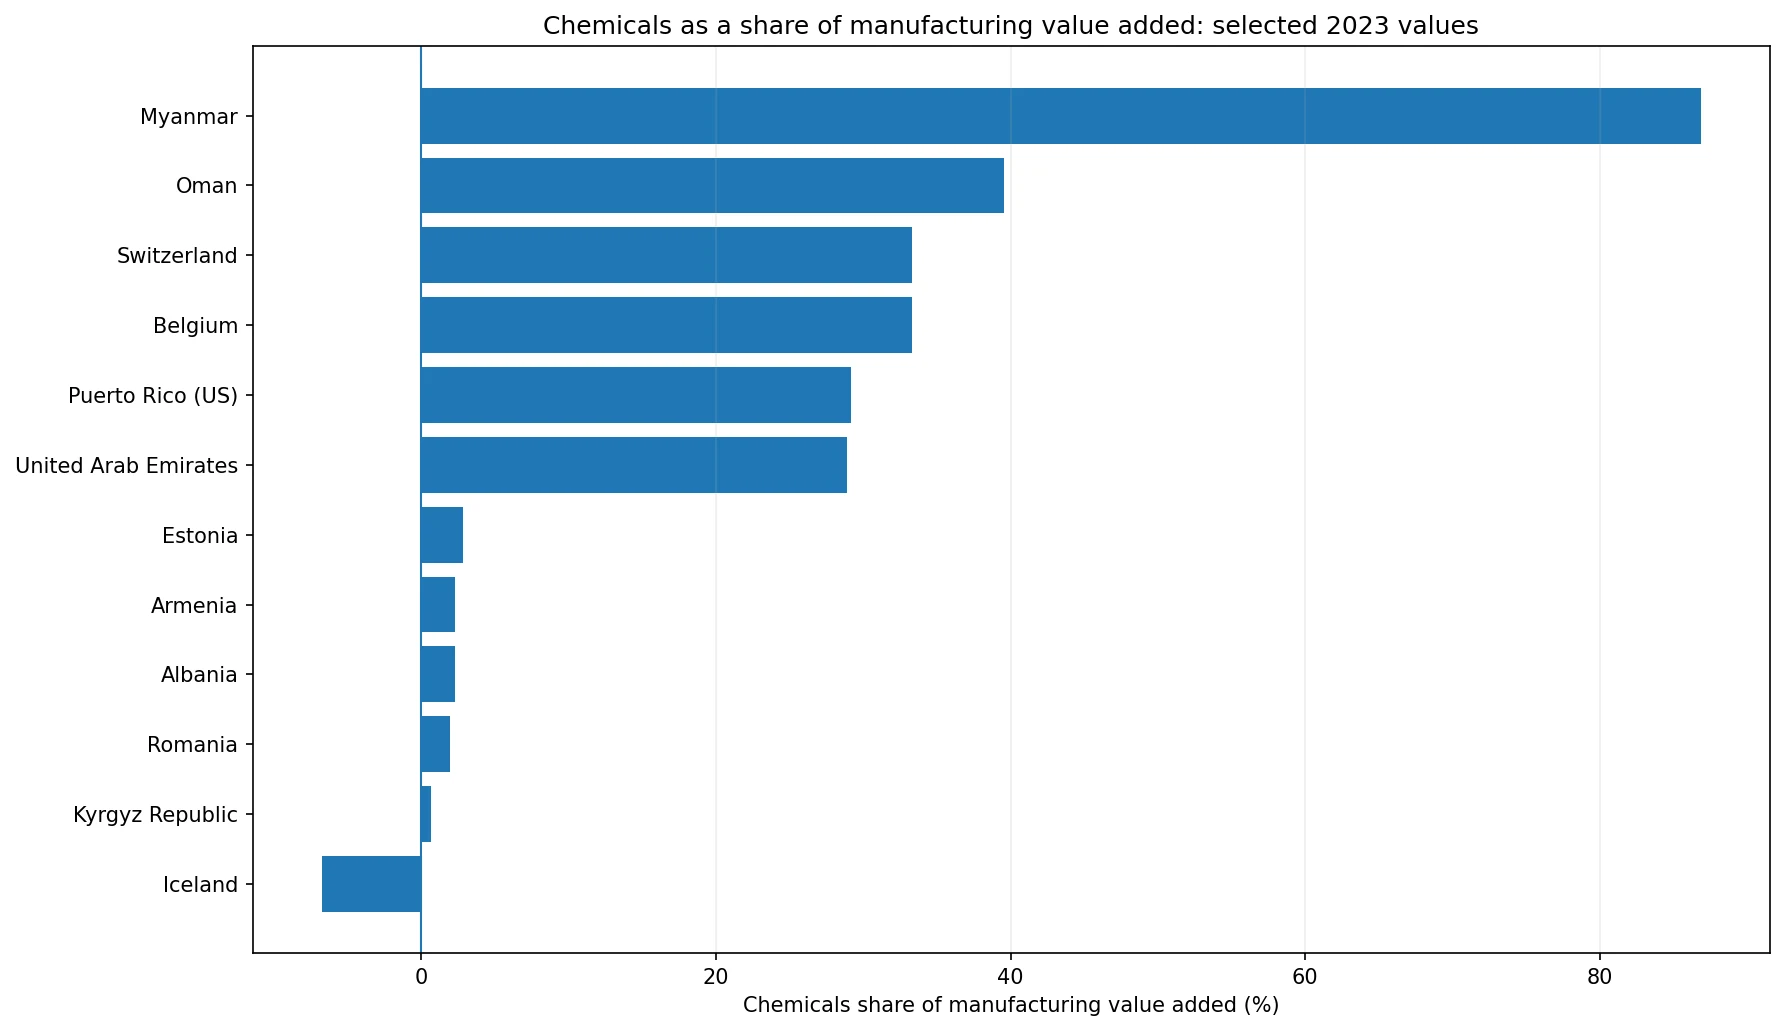
Table of Contents
The indicator measures manufacturing structure, not the size of the whole economy
The numerator is value added generated by chemicals and chemical products, and the denominator is total manufacturing value added. A value of 20% means chemicals account for roughly one fifth of value added generated inside manufacturing. It does not mean chemicals equal 20% of GDP, that 20% of manufacturing sales are chemical products, or that the country exports 20% of its chemical output.
Value added differs from gross output because intermediate inputs are removed. Industries that use large quantities of purchased materials, energy or services can have a much smaller value-added contribution than their sales would suggest. For this reason, the indicator is useful for comparing the internal composition of manufacturing but should not be substituted for production tonnage, revenue or export statistics.
The 2023 median is 8.91% across 61 economies
Among the 61 economies with a 2023 observation, the median chemicals share is 8.91% and the simple mean is 11.73%. The middle half of the distribution lies between 5.95% and 12.23%. The mean is higher than the median because a small number of unusually large values pull the average upward.
26 of the 61 economies are at or above 10%, and 6 are at or above 20%. At the lower end, 11 are below 5%. These differences show that chemicals occupy very different positions within manufacturing structures. They do not show the absolute size of chemical production, because a small manufacturing sector with a high chemicals share can still be smaller in dollar terms than a large diversified manufacturing sector with a lower share.
Myanmar is an exceptional high-side observation at 86.89%
Myanmar records the highest 2023 value at 86.89%, far above the rest of the group. Oman follows at 39.54%, Switzerland at 33.31%, Belgium at 33.28%, Puerto Rico at 29.16% and the United Arab Emirates at 28.91%. Myanmar’s observation is large enough to influence the group mean materially, which is one reason the median provides a better description of a typical 2023 observation.
An 86.89% share means chemicals account for a very large proportion of reported manufacturing value added. It does not establish that the entire economy is dominated by chemicals. The manufacturing sector could itself be a small or moderate part of the economy, and the indicator does not reveal the absolute dollar value of chemical-industry activity. Those questions require manufacturing value added and chemical value added in levels.
Iceland’s -6.76% is a value-added result, not negative physical output
Iceland has the lowest 2023 observation at -6.76%, followed by the Kyrgyz Republic at 0.68%, Romania at 1.92%, Albania at 2.25%, Armenia at 2.27% and Estonia at 2.85%. Because value added is calculated as output less intermediate consumption, an underlying industry value-added figure can be negative in the accounting data, which can produce a negative share. It does not mean that physical production itself was negative.
A negative value deserves more caution than an ordinary small positive share. Cost shocks, losses, valuation effects or other accounting conditions can affect value added, but the single cross-section does not identify which mechanism applies. The appropriate treatment is to retain the reported figure, label it as unusual and examine the underlying national or UNIDO time series before attempting a causal explanation.
| Economy | Year | Chemicals share |
|---|---|---|
| Myanmar | 2023 | 86.89% |
| Oman | 2023 | 39.54% |
| Switzerland | 2023 | 33.31% |
| Belgium | 2023 | 33.28% |
| Puerto Rico (US) | 2023 | 29.16% |
| United Arab Emirates | 2023 | 28.91% |
| Iceland | 2023 | -6.76% |
| Kyrgyz Republic | 2023 | 0.68% |
| Romania | 2023 | 1.92% |
| Albania | 2023 | 2.25% |
| Armenia | 2023 | 2.27% |
| Estonia | 2023 | 2.85% |
Only 13 economies have a 2024 observation
The newest 2024 group is small. Its median is 7.41% and its mean is 10.39%. The United States records 19.23%, Morocco 18.70%, Zambia 18.61%, Argentina 13.83%, Uruguay 12.87% and Canada 10.32%. At the lower end, Nicaragua is at 2.93%, New Zealand 4.66%, Peru 6.02% and Macao 6.05%.
These values are useful because they are more recent, but 13 economies are not enough to present a broad 2024 world ranking. The 2023 group offers much wider synchronized coverage, while the 2024 group offers greater recency. Treating them as separate analytical layers preserves both advantages without pretending that the coverage is the same.
| Economy | Year | Chemicals share |
|---|---|---|
| United States | 2024 | 19.23% |
| Morocco | 2024 | 18.70% |
| Zambia | 2024 | 18.61% |
| Argentina | 2024 | 13.83% |
| Uruguay | 2024 | 12.87% |
| Canada | 2024 | 10.32% |
| Nicaragua | 2024 | 2.93% |
| New Zealand | 2024 | 4.66% |
| Peru | 2024 | 6.02% |
| Macao SAR, China | 2024 | 6.05% |
| Mexico | 2024 | 7.16% |
| Australia | 2024 | 7.36% |
The 161 latest values span more than five decades
Across all 161 latest observations, the median is 7.78% and the mean is 10.84%, but those statistics combine years from 1973 through 2024. Thirteen observations are from 2024, 61 from 2023, 33 from 2020–2022 and 54 from 2019 or earlier. The oldest values are many decades removed from the newest ones.
| Reference period | Economies | How it is used here |
|---|---|---|
| 2024 | 13 | Newest supplementary comparison |
| 2023 | 61 | Main same-year comparison |
| 2020–2022 | 33 | Latest-value coverage only |
| 2019 or earlier | 54 | Separated from current comparison |
A map of latest available values can still be useful for showing geographic coverage, but the observation year should appear alongside every value. Industrial structure changes over time, and a 1980s or 1990s observation should not look indistinguishable from one measured in 2023 or 2024. The age of the observation is part of the substantive information.
A high share does not necessarily mean a large chemical industry in absolute terms
Ratios describe composition rather than scale. Suppose chemicals account for 30% of manufacturing value added in an economy whose manufacturing sector is worth $1 billion, while another economy has a 10% chemicals share in a $100 billion manufacturing sector. The second economy would have much more chemical-industry value added in absolute terms even though its percentage is lower.
That is why the indicator should be paired with measures of manufacturing value added in levels when the question concerns market size, investment capacity or employment potential. The percentage is strongest when the question is structural: how important are chemicals relative to other manufacturing activities inside the same economy?
Industrial concentration is not the same as competitiveness
A high chemicals share can arise because the chemical sector is strong, because other manufacturing industries are relatively small, or through a combination of both. The ratio alone cannot distinguish among those explanations. A low share may likewise reflect a diversified manufacturing base rather than weakness in chemicals.
Assessing competitiveness would require additional evidence such as labor productivity, export performance, research intensity, energy costs, firm structure and absolute value added. The chemicals share is not a score in which a larger number is automatically better. It is a measure of industrial composition, and both high and low values can occur under very different economic models.
The 2023 distribution is skewed by a few unusual observations
The median of 8.91% is well below the mean of 11.73%, largely because of the extreme upper tail. Myanmar at 86.89% is particularly influential, while Oman, Switzerland and Belgium also exceed 30%. At the other end, Iceland is the only negative observation in the 2023 group. The shape of the distribution makes rank alone a poor summary.
Broad bands are more useful. The middle half of observations falls between roughly 5.95% and 12.23%, which is a relatively compact range compared with the extremes. This shows that many economies have a moderate chemical share even though a handful of outliers make the overall spread look very large.
What the indicator can and cannot tell us
The series can show the relative importance of chemicals within manufacturing value added and, when years are aligned, support cross-country comparison of manufacturing structure. With a long time series for one economy, it can also show whether chemicals are becoming more or less prominent inside manufacturing.
It cannot tell us the absolute dollar value of chemical output, the quantity produced, export intensity, employment, profitability or the chemical sector’s share of GDP. It also does not by itself explain why one country has a higher share than another. Those questions require additional indicators and country-specific evidence.
The clearest way to read the available data
The 2023 synchronized comparison provides the broadest recent cross-section, while the 2024 subset provides a small but newer update. The much older observations should be retained for historical and geographic coverage but clearly separated from current comparisons. This structure avoids turning the latest available observation for each country into a false single-year snapshot.
The main substantive result is that the chemicals share of manufacturing value added varies enormously across economies. A typical 2023 observation is near 9%, but the range stretches from a negative value in Iceland to nearly 87% in Myanmar. That spread is meaningful only when the denominator, observation year and distinction between relative share and absolute industry size remain clear.
Source and interpretation limits
The source is World Bank World Development Indicators series NV.MNF.CHEM.ZS.UN, based on the UNIDO International Yearbook of Industrial Statistics. The official definition covers chemicals and chemical products in ISIC Revision 3 division 24 and expresses their value added as a percentage of total manufacturing value added.
A stronger follow-up analysis would combine this share with total manufacturing value added, manufacturing’s share of GDP, chemical exports and employment. Those additions would separate concentration inside manufacturing from the overall economic scale of the chemical industry and help explain whether unusually high or low shares persist over time.
Frequently Asked Questions
What does this percentage measure?
It is the share of total manufacturing value added generated by chemicals and chemical products manufacturing.
Can all 161 economies be ranked as 2024 observations?
No. They are latest non-missing values and their reference years range from 1973 to 2024.
Does a high chemicals share mean a large chemical industry in absolute terms?
Not necessarily. The indicator is a relative share inside manufacturing, so absolute value added must be measured separately.
Related Articles
Green Map creates custom-edited map images using open geographic data sources such as geoBoundaries, Natural Earth, OpenStreetMap, and government open data. These maps are edited visual materials, not raw data files, and are provided for education, documents, presentations, and graphic reference.