Independent power producers reported 382.49 million MMBtu of fuel consumption allocated to useful thermal output across the 50 states and the District of Columbia in the EIA’s 2025 annual data. The distribution is unusually concentrated: Texas alone accounted for 183.82 million MMBtu, or 48.1% of the 51-jurisdiction total. Michigan ranked a distant second at 28.93 million MMBtu, followed by California at 22.08 and New Jersey at 21.84.
This is a narrowly defined EIA series, not a measure of all fuel consumption in each state. The data are filtered to all fuel types within the Independent Power Producers sector and to the field labeled Consumption of Fuels for Useful Thermal Output (BTUs). Reading the scope correctly matters because a state can have extensive electricity generation or other fuel use while recording a zero or small value in this particular series.
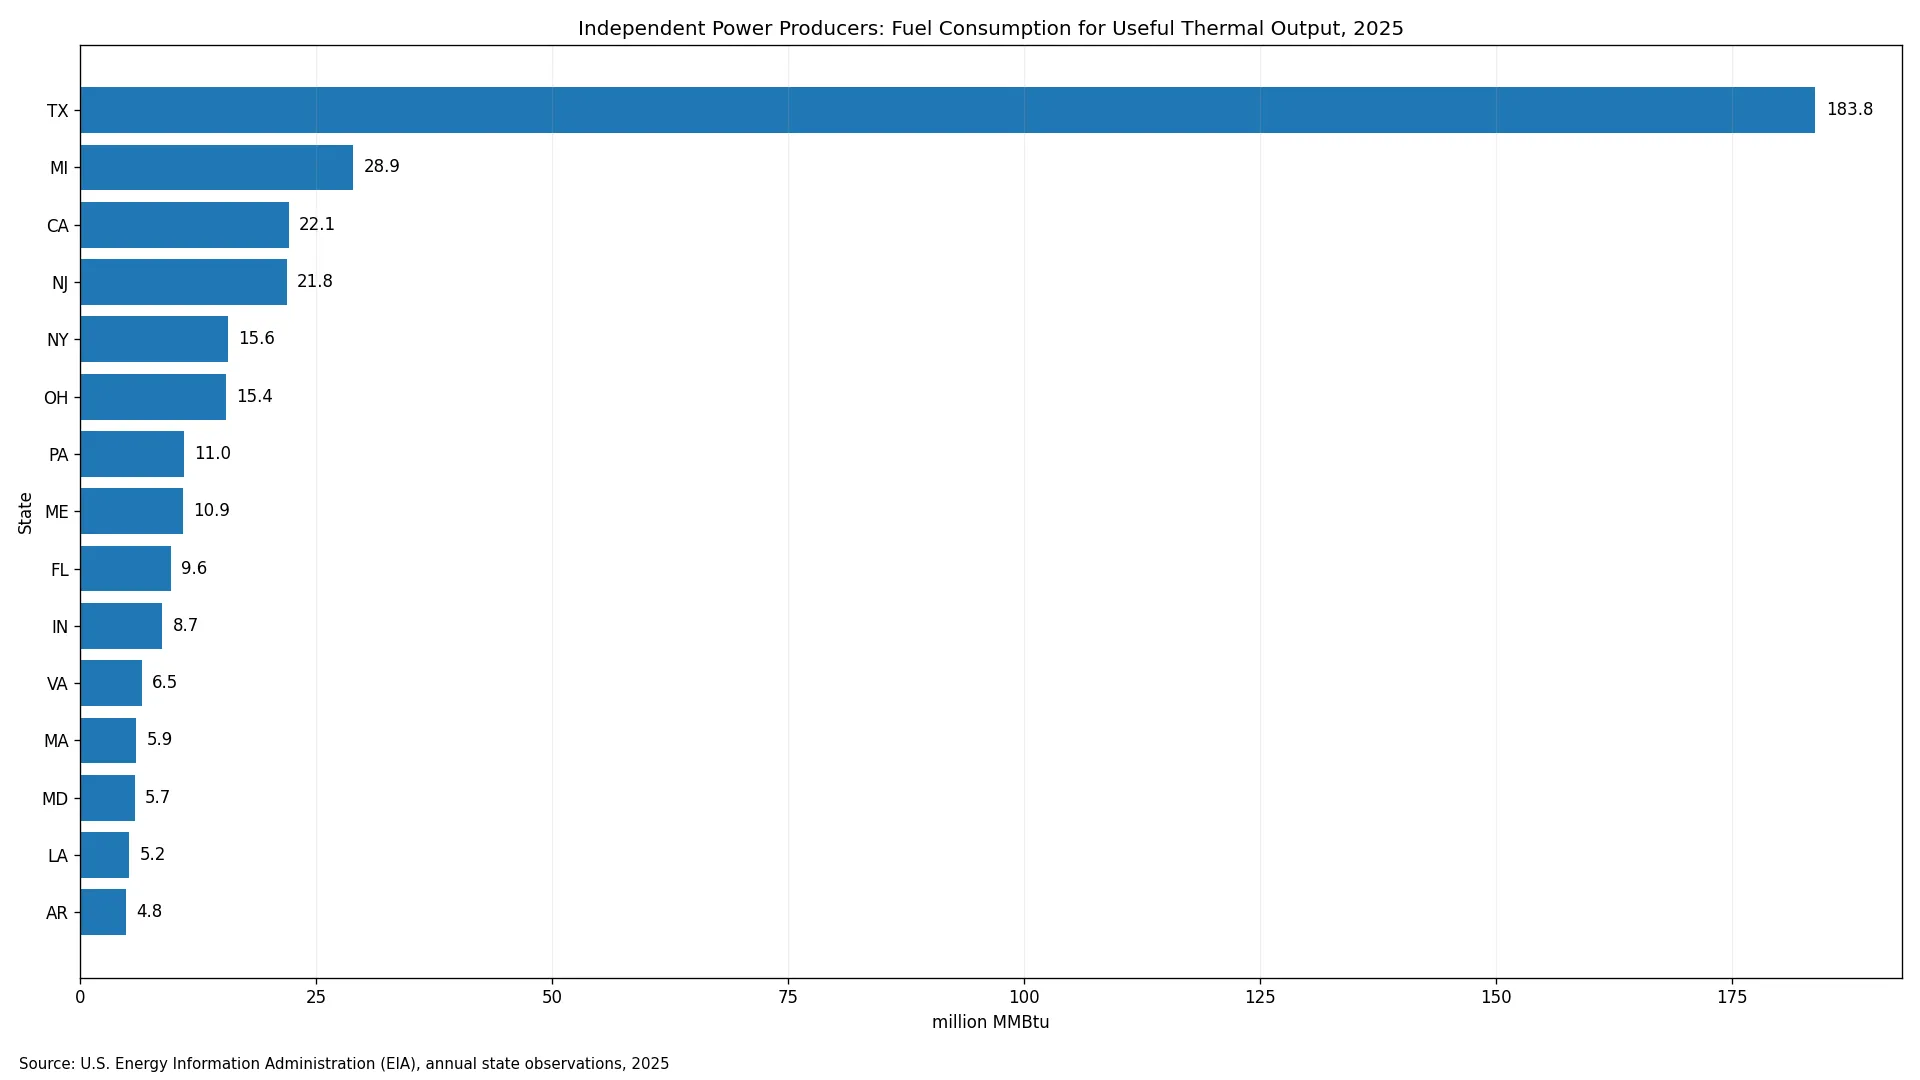
Table of Contents
What the EIA series measures
The underlying dataset is the U.S. Energy Information Administration’s electric power operational data. The selected field is consumption-uto-btu, the frequency is annual, the fuel facet is ALL, and the sector facet is Independent Power Producers. Every row in this comparison refers to 2025, so the values can be ranked without mixing reporting years.
The unit is kept exactly as supplied by EIA: million MMBtu. No conversion was applied. That choice avoids introducing a second unit system and makes the state values directly traceable to the source series. The 51 rows cover the 50 states plus the District of Columbia, and there are no missing rows in the provided state slice.
Useful thermal output is the defining concept here. The series should not be treated as electricity generation, total energy use, total power-sector fuel consumption, or statewide industrial heat demand. Those are different measurements. The safest interpretation is simply the amount of fuel consumption EIA assigns to useful thermal output for independent power producers under this exact annual series.
Texas represents nearly half of the total
Texas reported 183.82 million MMBtu. Against a 51-jurisdiction sum of 382.49 million MMBtu, that is 48.1%. The other 50 jurisdictions combined total 198.67 million MMBtu, meaning the Texas value alone is equivalent to roughly 92.5% of the combined remainder.
The gap between first and second place is also large in absolute terms. Texas exceeds Michigan by about 154.90 million MMBtu and is about 6.35 times Michigan’s value. Below that break, the ranking compresses sharply: California and New Jersey are separated by less than 0.24 million MMBtu, while New York and Ohio differ by about 0.22 million MMBtu.
Those gaps describe concentration, but they do not identify a cause. Explaining why one state reports more useful-thermal-output fuel consumption would require additional evidence such as plant-level configurations, operating patterns, fuel details, and the relationship between electricity and thermal output. The state totals alone support a distributional comparison, not a causal claim.
The top 10 states account for 85.7%
| State | 2025 value (million MMBtu) | Share of total |
|---|---|---|
| Texas | 183.82 | 48.1% |
| Michigan | 28.93 | 7.6% |
| California | 22.08 | 5.8% |
| New Jersey | 21.84 | 5.7% |
| New York | 15.62 | 4.1% |
| Ohio | 15.40 | 4.0% |
| Pennsylvania | 10.99 | 2.9% |
| Maine | 10.89 | 2.8% |
| Florida | 9.60 | 2.5% |
| Indiana | 8.68 | 2.3% |
The top five states—Texas, Michigan, California, New Jersey, and New York—sum to 71.2% of the national state-level total in this slice. Adding Ohio, Pennsylvania, Maine, Florida, and Indiana lifts the top-10 share to 85.7%. The remaining 41 jurisdictions collectively account for only 14.3%.
California and New Jersey form one close pair at 5.8% and 5.7% of the total. New York and Ohio form another at 4.1% and 4.0%. Pennsylvania and Maine are both just under 3%, while Florida and Indiana are a little above 2%. This creates a distribution with one very large outlier at the top and a much flatter set of values underneath it.
The overall mean across all 51 jurisdictions is 7.50 million MMBtu, but the median is only 0.52. Among the 33 jurisdictions with positive values, the median is 3.47. The contrast between the mean and median is another sign that a small group of large observations pulls the average upward.
Eighteen jurisdictions are reported at zero
Eighteen rows contain an explicit numerical zero rather than a missing value. They are Alabama, the District of Columbia, Iowa, Kansas, Kentucky, Mississippi, Nebraska, New Hampshire, New Mexico, North Dakota, Oklahoma, Rhode Island, South Dakota, Tennessee, Vermont, Washington, West Virginia, and Wyoming.
A zero should be interpreted only within the boundaries of this series. It does not establish that the state has no independent power producers, no fuel consumption, no thermal activity, or no electricity generation. It means the 2025 observation for this exact EIA combination—useful thermal output, all fuels, independent power producers—was reported as zero.
Several nonzero observations are also extremely small relative to the leaders. Utah is 0.00692 million MMBtu, Arizona 0.02545, Wisconsin 0.14119, Delaware 0.19147, and Colorado 0.28375. Keeping these small positive values distinct from the zeros preserves the information contained in the source data.
How to read the state ranking
First, these are absolute quantities. They are not normalized by population, generation, plant capacity, economic output, or the number of facilities. A larger value therefore means a larger reported quantity in this series, not better efficiency or higher thermal productivity.
Second, the comparison is a single-year snapshot. The 2025 ranking does not show whether Texas has always held a similar share or whether the distribution changed sharply from prior years. A trend analysis would need the same field, sector, fuel facet, geography, and unit across multiple years.
Third, the sector filter matters. Independent Power Producers are only one slice of the electric-power data. Results for the total electric-power sector or another sector code can differ substantially. Comparisons between articles should therefore check sector, fuel type, output concept, and year before treating the numbers as equivalent.
Fourth, the dataset is suited to describing where the reported volume is concentrated, but not to explaining the underlying operational reasons. A causal interpretation would need additional variables that are not present in this state table. Separating description from explanation prevents the ranking from implying more than the data can support.
What stands out in 2025
Three features define the 2025 distribution. The first is Texas’s 48.1% share. The second is the steep cumulative concentration: the top three states hold 61.4%, the top five 71.2%, and the top 10 85.7%. The third is the long lower tail, including 18 zeros and several positive values below 0.5 million MMBtu.
Together, those features make the state total more informative when presented as a distribution rather than as a single aggregate. The 382.49 million MMBtu total is useful context, but it hides the fact that nearly half sits in one state and most of the rest is spread unevenly across a relatively small set of jurisdictions.
Data source and calculation notes
The source is the U.S. Energy Information Administration Electric Power Operational Data API. The comparison uses annual 2025 observations for the consumption-uto-btu field, fueltypeid=ALL, and sectorid=94. The supplied state slice contains 51 observations covering the 50 states and District of Columbia.
Totals, ranks, state shares, and top-group concentration percentages in this article were calculated directly from those 51 observations. Because official statistical series can be revised, a later API retrieval may differ from the values shown here; reproducing the comparison requires the same year, field, sector, fuel filter, and unit.
Frequently Asked Questions
Which state has the largest 2025 value in this EIA series?
Texas ranks first at 183.82 million MMBtu, equal to about 48.1% of the 51-jurisdiction total.
Does a zero mean a state used no fuel?
No. A zero applies only to this exact 2025 EIA series for useful thermal output, all fuels, and independent power producers. It does not describe all fuel or electricity activity in that state.
Can these values be used as an efficiency ranking?
Not directly. They are absolute quantities and are not normalized by generation, capacity, population, or another denominator.
Related Articles
Green Map creates custom-edited map images using open geographic data sources such as geoBoundaries, Natural Earth, OpenStreetMap, and government open data. These maps are edited visual materials, not raw data files, and are provided for education, documents, presentations, and graphic reference.