Government revenue is made up of more than the familiar categories of income taxes and consumption taxes. World Bank series GC.TAX.OTHR.RV.ZS groups employer payroll or labor taxes, property taxes, and taxes that cannot be allocated to other categories under “Other taxes,” then expresses that amount as a share of government revenue. This analysis keeps the cross-country comparison on one time basis by using only the 81 observations actually dated 2024.
The latest non-missing file contains 157 countries and economies, but the reference years span 1979–2024. Only 81 values are from 2024; the other 76 are older. Mixing them into one current ranking would place observations such as Japan 1993, Barbados 2016, and Trinidad and Tobago 2019 beside 2024 figures. The map, rankings, mean, median and distribution below therefore use the synchronized 2024 subset.
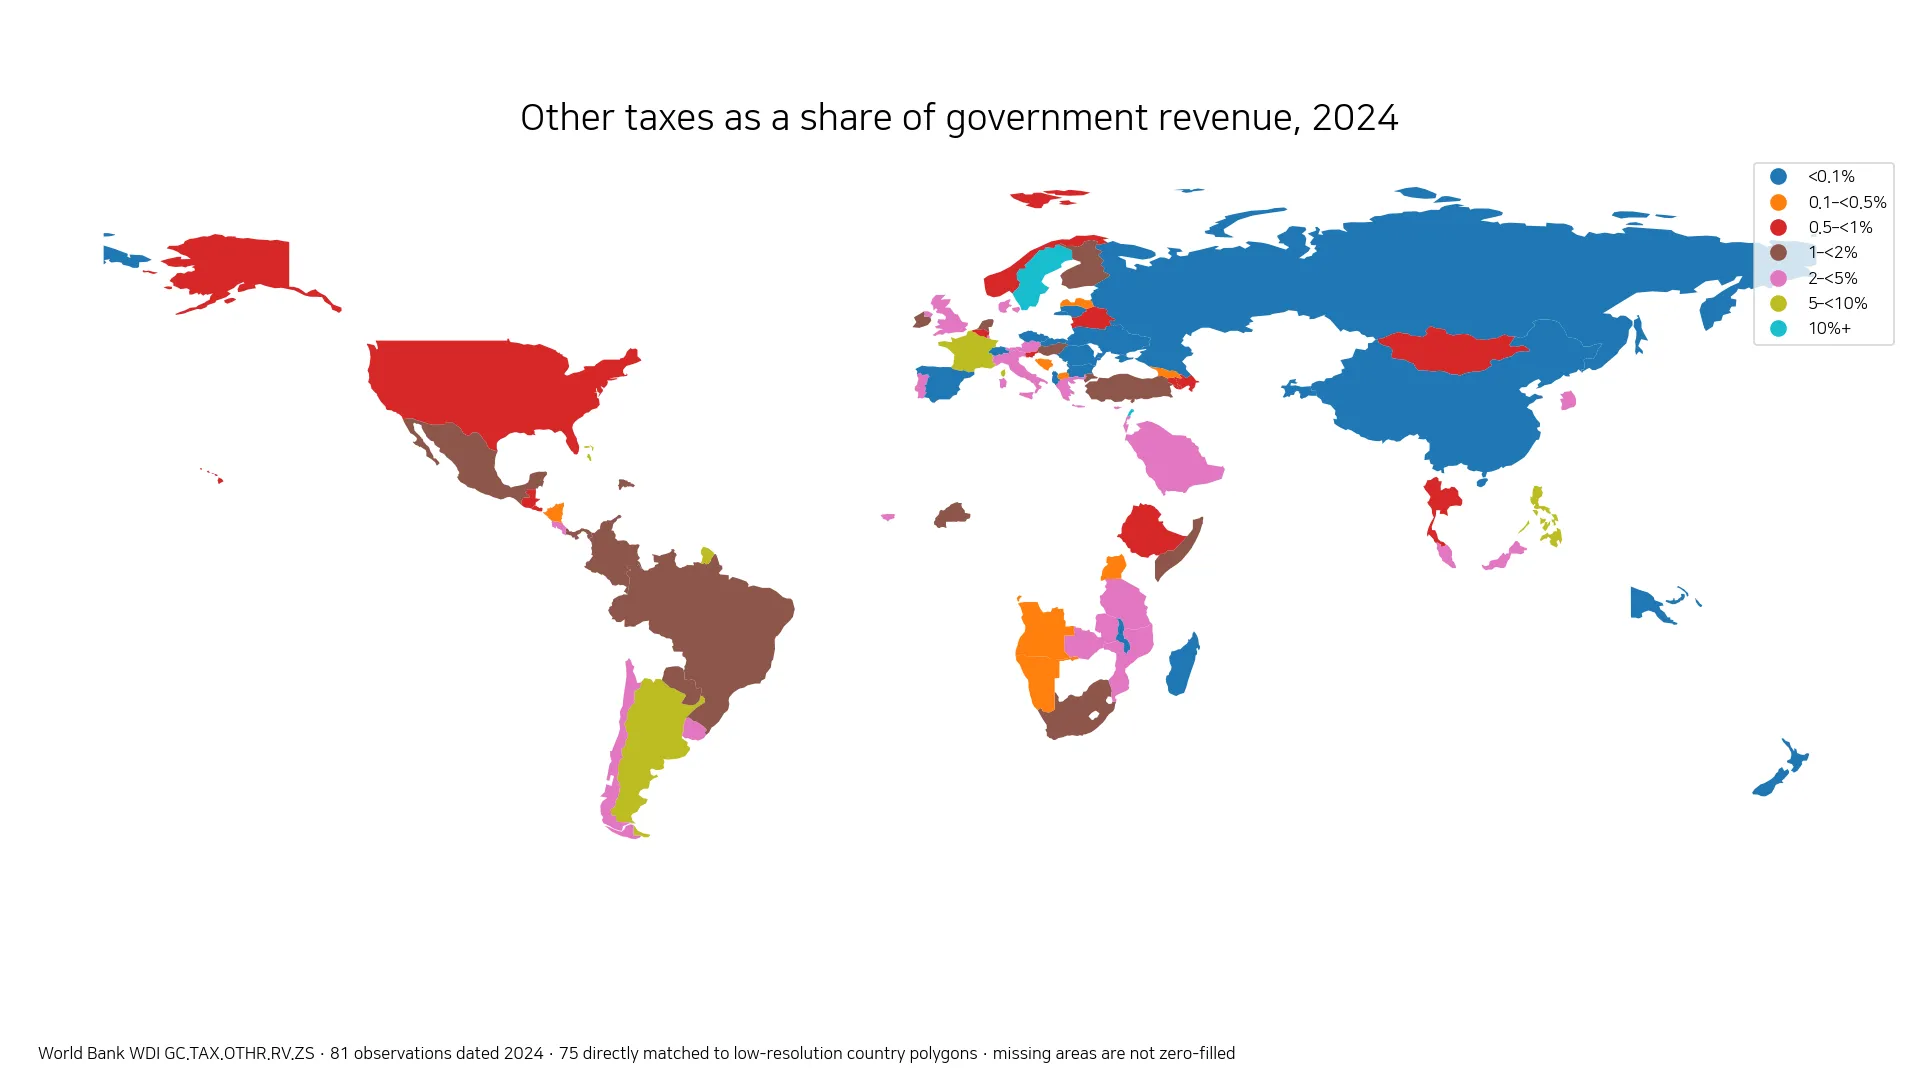
Table of Contents
What counts as other taxes in this indicator
World Bank metadata defines Other taxes as including employer payroll or labor taxes, taxes on property, and taxes that are not allocable to other categories. The definition also gives penalties for late payment or nonpayment of taxes as an example of amounts that may fall into this residual category. The underlying source is the IMF Government Finance Statistics Yearbook and data files.
The denominator is revenue, not total tax revenue alone. World Bank metadata describes revenue as transactions that add to the economic value of a government unit or sector. That distinction matters: a 10% value should not automatically be read as “10% of all taxes.” Non-tax revenue and other revenue categories can affect the denominator, so the series is best treated as a government-revenue-composition measure.
The 2024 median is 1.16% of government revenue
Across the 81 observations dated 2024, the simple unweighted mean is 2.36% and the median is 1.16%. The 25th percentile is 0.34% and the 75th percentile is 2.83%, so the middle half lies roughly between those two values. 37 observations are below 1%; only 7 reach 5% or more and just 3 exceed 10%.
| Share of government revenue | Countries/economies |
|---|---|
| Below 0.1% | 17 |
| 0.1–<0.5% | 8 |
| 0.5–<1% | 12 |
| 1–<2% | 16 |
| 2–<5% | 21 |
| 5–<10% | 4 |
| 10%+ | 3 |
The minimum is the Russian Federation at roughly 0.000001%, which is effectively near zero but is still a numeric observation rather than a missing value. The Slovak Republic, Andorra, Papua New Guinea, Romania and Tajikistan are also very low. These values do not prove that the countries have no property, payroll or labor-related taxes. They show that the World Bank Other taxes category accounts for a very small portion of the reported government-revenue denominator.
Sweden, Lebanon and Singapore stand out at the top
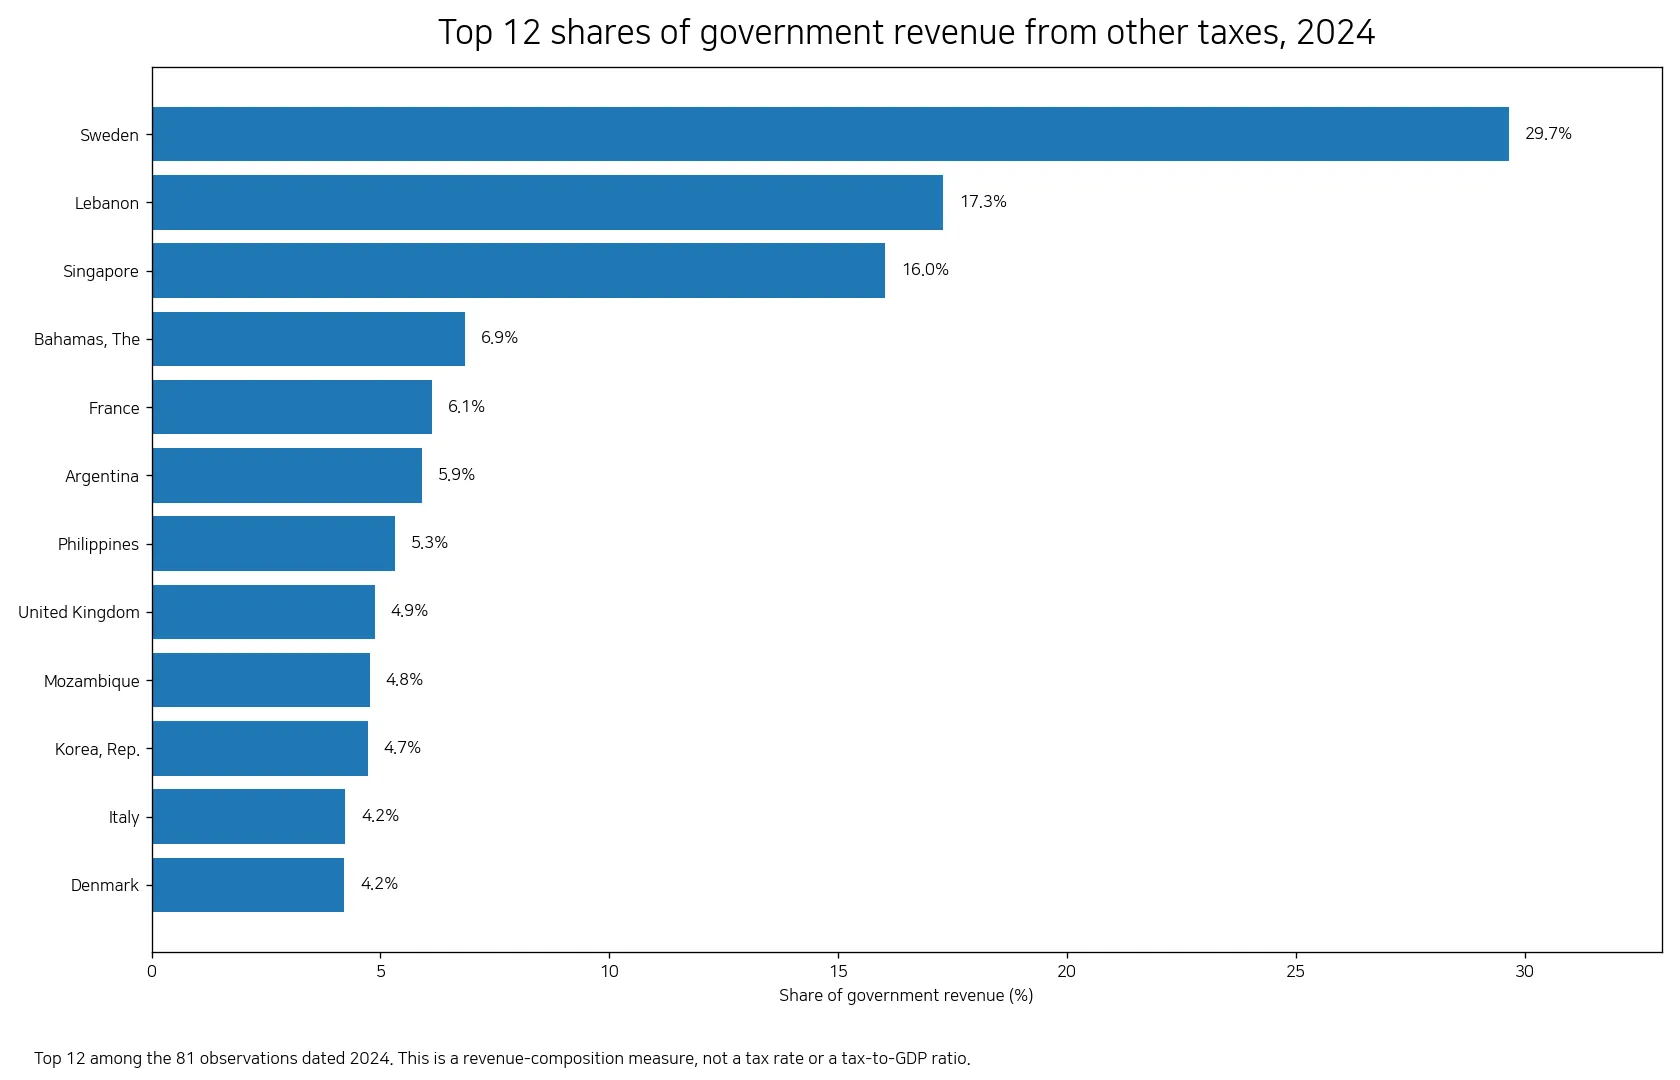
Sweden records the highest 2024 value at 29.66% of government revenue. Lebanon is at 17.29% and Singapore at 16.03%. The Bahamas follows at 6.85%, France at 6.13%, Argentina at 5.90%, and the Philippines at 5.31%. The United Kingdom is at 4.87%, Mozambique 4.77%, Korea, Rep. 4.72%, Italy 4.23%, and Denmark 4.21%.
| Country/economy | 2024 share of government revenue |
|---|---|
| Sweden | 29.66% |
| Lebanon | 17.29% |
| Singapore | 16.03% |
| Bahamas, The | 6.85% |
| France | 6.13% |
| Argentina | 5.90% |
| Philippines | 5.31% |
| United Kingdom | 4.87% |
The highest values are not confined to one region. The list includes European economies such as Sweden, France, the United Kingdom, Italy and Denmark; Asian economies such as Lebanon, Singapore and the Philippines; the Bahamas and Argentina in the Americas; and Mozambique in Africa. The cross-regional pattern is a warning against explaining the series as a simple continental trait.
A high share does not mean that tax rates are high
This series is neither a statutory tax rate nor taxes as a share of GDP. Sweden’s 29.66%, for example, does not mean that residents or businesses face a 29.66% tax rate. It means that the items classified under Other taxes amount to that share of the reported government-revenue measure. The ratio can fall when other revenue rises even if the numerator does not fall, and it can rise when other revenue sources weaken.
Questions about the overall tax burden require other measures, such as tax revenue relative to GDP, effective personal or corporate tax rates, social contributions or consumption-tax rates. A property-tax question also calls for a property-tax series rather than this residual category. The label “other” should not be taken to mean that the composition is identical across national tax systems.
Other tax categories help explain the broader revenue mix
The same government-finance family includes measures for taxes on income, profits and capital gains and for taxes on goods and services. Looking at those shares together can reveal whether reported revenue relies more heavily on one category than another. But even closely related ratios need careful interpretation because government coverage, accounting scope and classification practices can differ across countries.
A country with a high goods-and-services-tax share and a low Other taxes share cannot automatically be said to have substituted one tax for another. Revenue structure reflects tax design as well as economic activity, property values, labor-market arrangements, resource receipts, public-enterprise income, fees and other non-tax sources. A one-year cross-section identifies composition differences; it does not establish the causes.
Why the 76 older latest values are not put into the 2024 ranking
“Latest available” means the last non-missing observation retained in the database, not that every country was measured in the same current year. In the 157-row file, some observations are decades older than 2024. Those historical values may reflect older tax systems and older government-accounting boundaries, so presenting all 157 as a synchronized current ranking would be misleading.
The map and rankings therefore use only the 81 observations dated 2024. Countries without a 2024 value remain missing rather than being assigned zero or carrying an older value forward. The full latest-available set can still be useful if every value is displayed with its reference year and the mixed-time nature of the comparison is made explicit.
Government coverage and classification limit fine-grained rankings
Government Finance Statistics are compiled under international standards, but countries do not always report the same institutional coverage. Some series can reflect central government while others may consolidate a broader general-government scope, and social-security funds or other public units may be treated differently. Tax classification can also vary at the margins. Small differences of a few hundredths of a percentage point should therefore not be treated as precise performance rankings.
A high Other taxes share is not a judgment on fiscal health or tax-system quality. The indicator does not measure budget balance, debt sustainability, after-tax income distribution, fairness, administrative efficiency, compliance or growth effects. It answers a narrower question: how large is this residual tax category relative to reported government revenue?
Data source and calculation method
The analysis uses World Bank World Development Indicators series GC.TAX.OTHR.RV.ZS. World Bank metadata includes employer payroll or labor taxes, property taxes and taxes not allocable to other categories within Other taxes and identifies IMF Government Finance Statistics Yearbook and data files as the source. All summary statistics, bands, rankings and map classes are calculated from the 81 observations dated 2024, not from the 76 older latest-available values.
Frequently Asked Questions
Does a high Other taxes share mean tax rates are high?
No. This is a share of government revenue attributed to the World Bank Other taxes category, not a statutory tax rate.
What is included in Other taxes?
World Bank metadata includes employer payroll or labor taxes, property taxes, and taxes not allocable to other categories.
Why are all 157 latest observations not ranked as 2024 values?
Only 81 of the 157 latest non-missing observations are dated 2024. The other 76 span 1979–2023, so the synchronized comparison uses the 81-row 2024 subset.
Were countries without a 2024 value treated as zero?
No. Missing 2024 observations remain missing and are excluded from the map statistics, mean, median and rankings.
Related Articles
Green Map creates custom-edited map images using open geographic data sources such as geoBoundaries, Natural Earth, OpenStreetMap, and government open data.
These maps are edited visual materials, not raw data files, and are provided for education, documents, presentations, and graphic reference.