Comparing income levels across economies with market exchange rates alone can be misleading because the same amount of money buys very different quantities of goods and services. World Bank indicator `NY.GNP.PCAP.PP.KD` addresses that problem by expressing gross national income per person in purchasing-power-parity terms and then holding prices constant at the 2021 international-dollar level. Across 197 latest available observations, the median is 16,784 international dollars and the simple mean is 26,554. Singapore has the highest latest value at 116,633 in 2025, while Burundi has the lowest at 1,024 in 2021.
Three ideas are built into the indicator. GNI measures income accruing to residents, not just production taking place inside national borders. PPP adjusts for differences in price levels across economies. Constant 2021 international dollars remove changes in the general price level over time by using 2021 as the reference-price year. The result is therefore different from a current-international-dollar PPP series, even when the indicator names look almost identical.
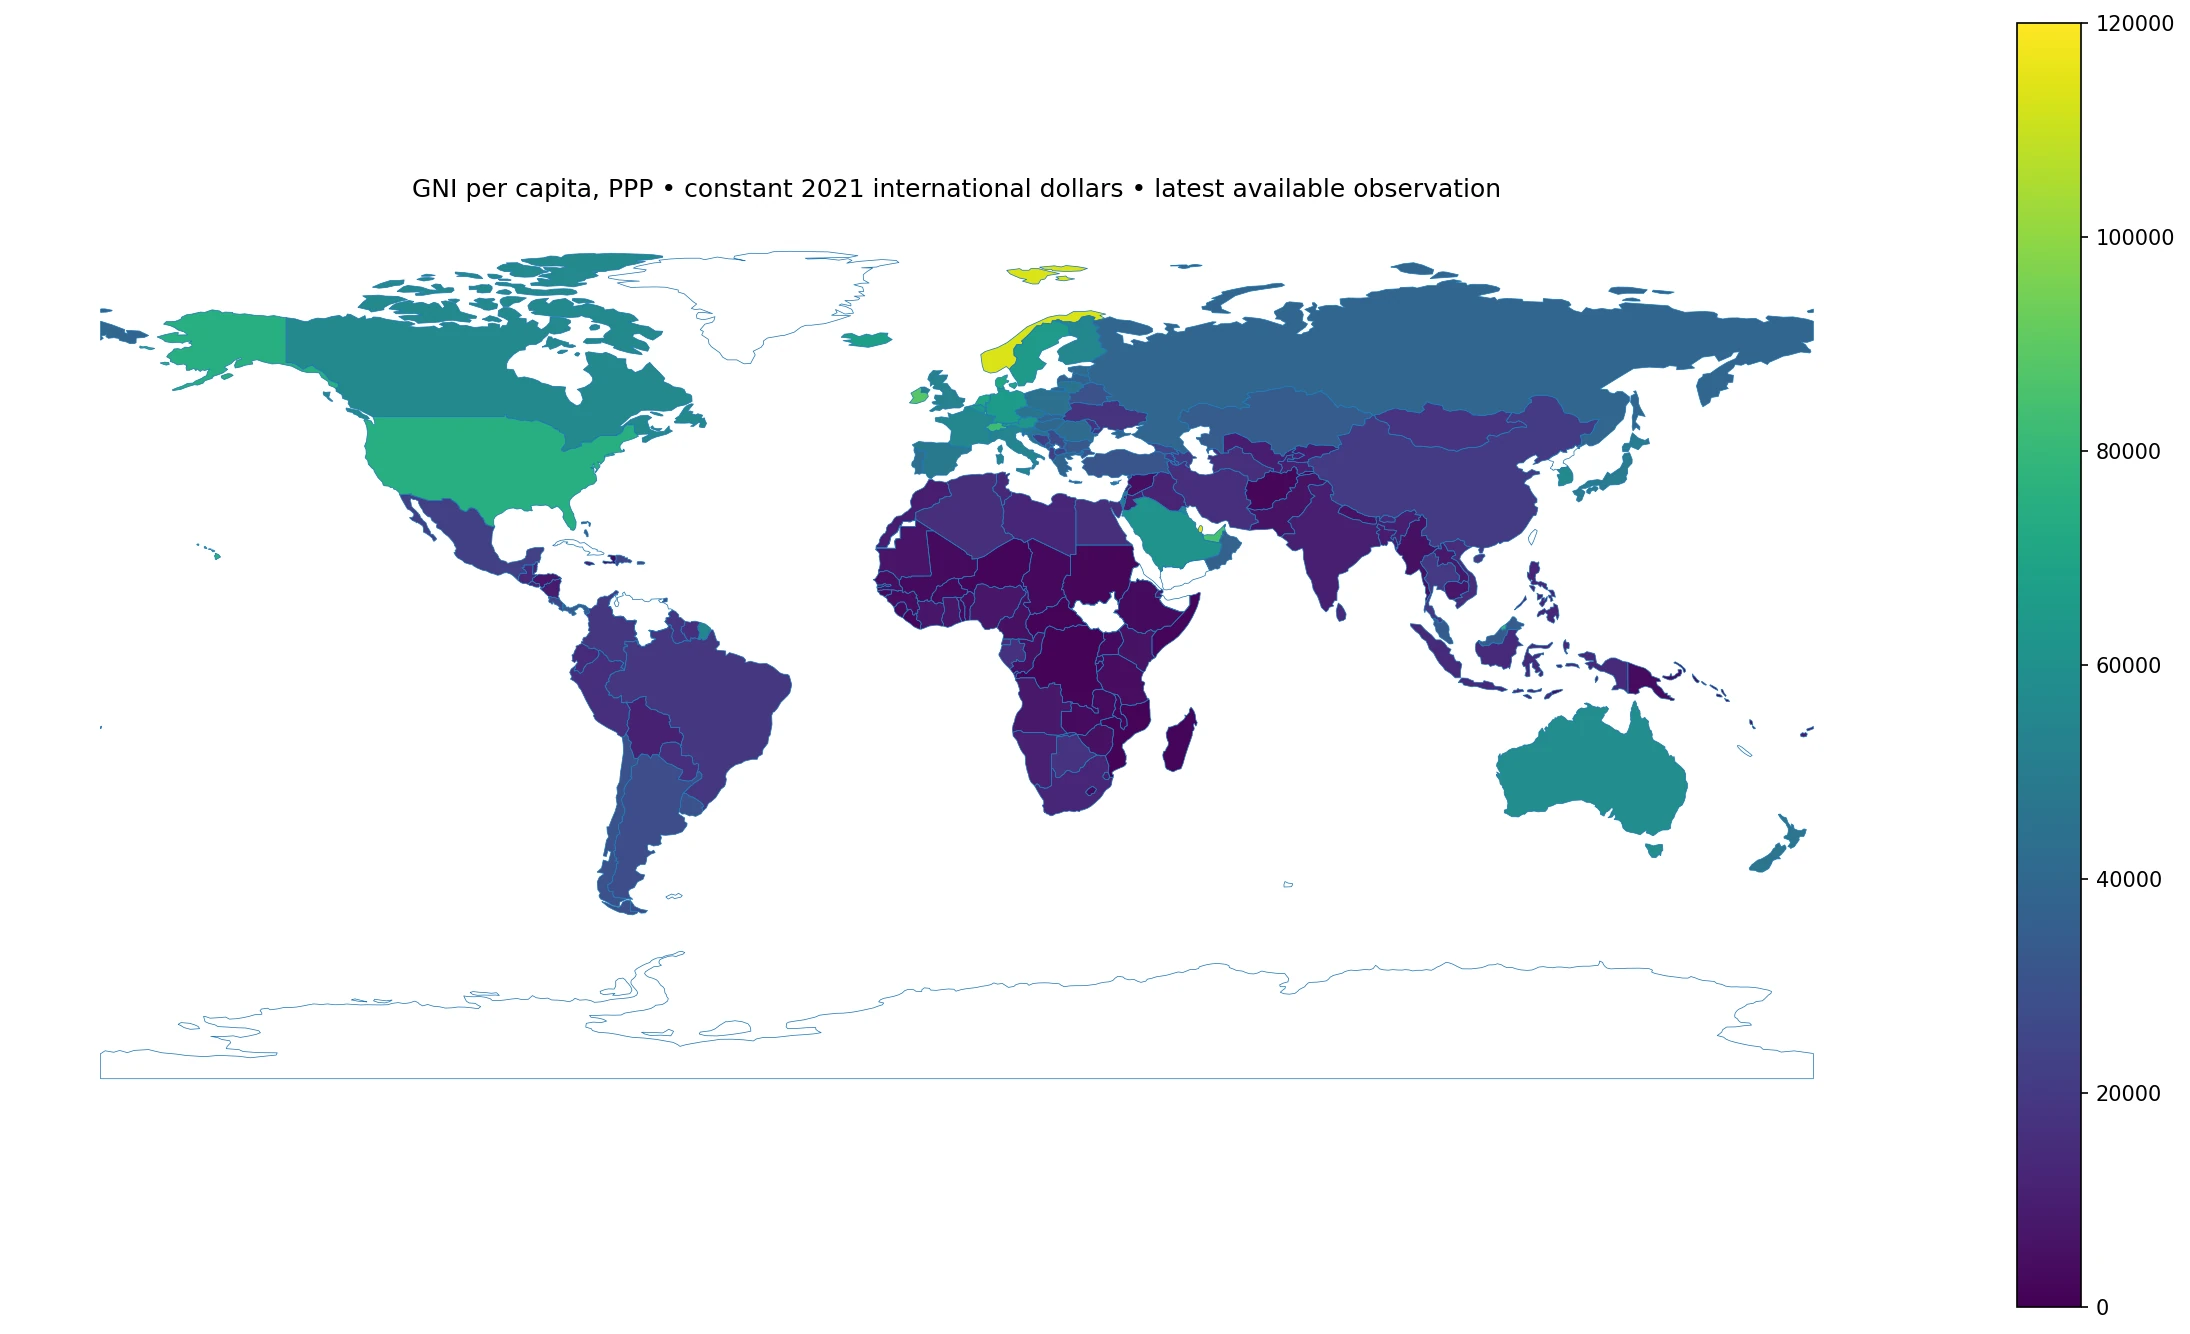
Table of Contents
The median latest observation is 16,784 constant 2021 international dollars
The first quartile is about 6,960 and the third quartile is about 38,912, so the middle half of the 197 observations lies between roughly seven thousand and thirty-nine thousand international dollars. The mean of 26,554 is almost ten thousand dollars above the median because a group of very high-income economies sits near or above one hundred thousand.
The median should not be read as the income of the median person in the world. Each economy receives one observation regardless of population. China, India, Luxembourg, and a small island economy all count once. The statistic is useful for describing the country distribution, but a population-weighted global income measure would answer a different question.
The highest latest available values
| Country or territory | Observation year | GNI per capita, PPP (constant 2021 int. $) |
|---|---|---|
| Singapore | 2025 | 116,633 |
| Qatar | 2021 | 115,037 |
| Macao SAR, China | 2024 | 114,322 |
| Norway | 2022 | 113,022 |
| Bermuda | 2024 | 110,550 |
| Ireland | 2024 | 88,346 |
| Luxembourg | 2024 | 85,030 |
| United Arab Emirates | 2023 | 84,671 |
| Switzerland | 2023 | 82,430 |
| Brunei Darussalam | 2025 | 78,957 |
Singapore leads at 116,633 in 2025. Qatar follows at 115,037 using its latest 2021 observation, Macao SAR China is at 114,322 in 2024, Norway at 113,022 in 2022, and Bermuda at 110,550 in 2024. Ireland, Luxembourg, the United Arab Emirates, Switzerland, and Brunei Darussalam also sit near the top of the distribution.
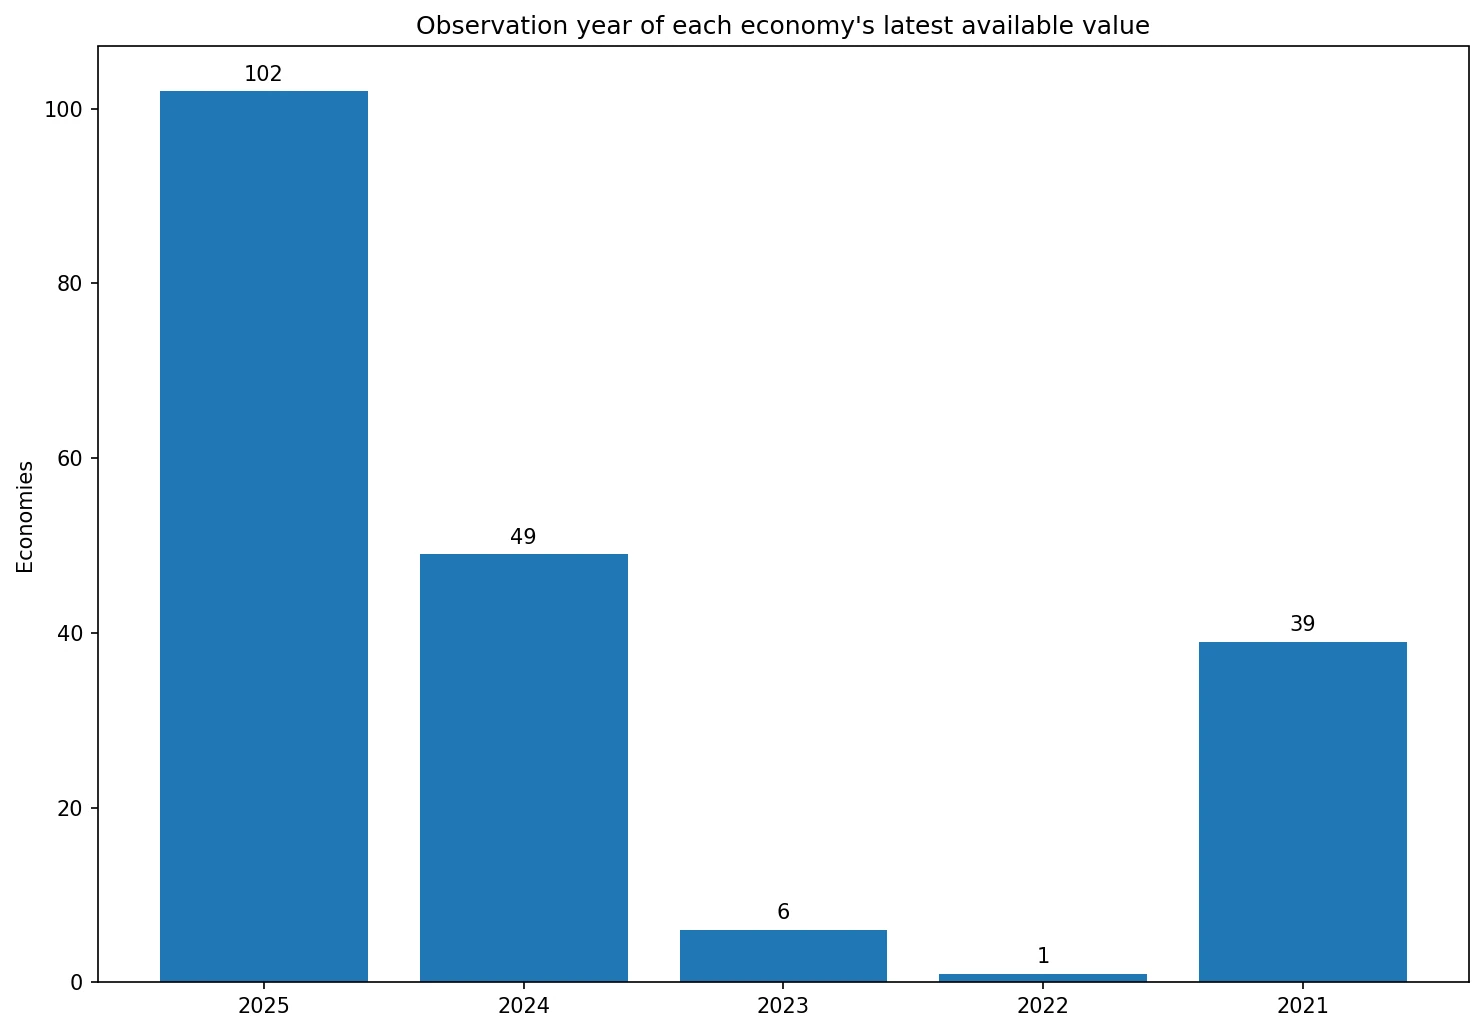
The year column matters even though the period mismatch is smaller than in many latest-available global datasets. Of the 197 observations, 151—or 76.6%—are from 2024 or 2025. Six are from 2023, one from 2022, and 39 are from 2021. The map is therefore fairly recent overall, but it is still not a perfectly synchronized ranking.
The lowest latest observations are clustered in low-income economies
| Country or territory | Observation year | GNI per capita, PPP (constant 2021 int. $) |
|---|---|---|
| Burundi | 2021 | 1,024 |
| Central African Republic | 2025 | 1,181 |
| Congo, Dem. Rep. | 2025 | 1,239 |
| Mozambique | 2025 | 1,354 |
| Somalia, Fed. Rep. | 2025 | 1,418 |
| Liberia | 2021 | 1,446 |
| Malawi | 2025 | 1,561 |
| Madagascar | 2025 | 1,658 |
| Niger | 2025 | 1,857 |
| Sudan | 2025 | 1,879 |
Burundi has the lowest latest observation at 1,024 in 2021. Central African Republic is at 1,181 in 2025, the Democratic Republic of the Congo at 1,239, Mozambique at 1,354, and Somalia at 1,418. Liberia, Malawi, Madagascar, Niger, and Sudan complete the bottom ten.
These values are not household disposable income. GNI is a national-accounts concept that includes income accruing to residents and then divides the aggregate by population. It says nothing directly about the distribution of income within an economy. Two countries with similar GNI per capita can have very different inequality, taxation, public services, and median household living standards.
A same-year 2025 comparison is available for 102 economies
One hundred two of the 197 economies have a 2025 value. Their median is 14,273 constant 2021 international dollars and their simple mean is 21,541. The first quartile is about 4,930 and the third quartile about 29,597. The 2025-only center is lower than the full latest-observation distribution partly because several high-income small economies have their latest observation in 2021–2024 rather than 2025.
| Highest 2025 observations | GNI per capita, PPP (constant 2021 int. $) |
|---|---|
| Singapore | 116,633 |
| Brunei Darussalam | 78,957 |
| Hong Kong SAR, China | 75,243 |
| Denmark | 71,534 |
| Netherlands | 70,745 |
| Germany | 65,564 |
| Sweden | 65,118 |
| Saudi Arabia | 61,805 |
| Australia | 58,319 |
| Malta | 56,504 |
Within the 2025 subset, Singapore remains first at 116,633. Brunei Darussalam follows at 78,957, Hong Kong SAR China at 75,243, Denmark at 71,534, and the Netherlands at 70,745. Germany, Sweden, Saudi Arabia, Australia, and Malta complete the top ten among economies with a 2025 observation.
| Lowest 2025 observations | GNI per capita, PPP (constant 2021 int. $) |
|---|---|
| Central African Republic | 1,181 |
| Congo, Dem. Rep. | 1,239 |
| Mozambique | 1,354 |
| Somalia, Fed. Rep. | 1,418 |
| Malawi | 1,561 |
| Madagascar | 1,658 |
| Niger | 1,857 |
| Sudan | 1,879 |
| Chad | 2,405 |
| Burkina Faso | 2,757 |
The bottom of the 2025 subset includes Central African Republic at 1,181, the Democratic Republic of the Congo at 1,239, Mozambique at 1,354, Somalia at 1,418, and Malawi at 1,561. This table is temporally cleaner than the full latest-value ranking, but it covers only economies with 2025 data and therefore sacrifices geographic coverage.
Current PPP dollars and constant 2021 PPP dollars answer different questions
The World Bank also publishes GNI per capita at PPP in current international dollars. A current PPP series is useful for describing purchasing-power-adjusted income at the price structure of each period, but it contains changes in the overall price level. The constant series used here expresses all years in a common 2021 international-dollar price basis, making real changes through time easier to interpret.
That is the main distinction from a general ‘latest GNI per capita at PPP’ article. Both use purchasing power parity, but the current-price and constant-price versions should not be mixed in the same ranking or growth calculation. Constant prices are designed for real comparisons over time; current prices are closer to a contemporary level comparison.
GNI and GDP are related but not interchangeable
GDP measures production within an economy’s territory. GNI starts from GDP and adds primary income received by residents from abroad while subtracting primary income paid to nonresidents. Cross-border labor income and investment income can therefore create a meaningful gap between GDP per capita and GNI per capita.
For an economy where multinational-company profits or cross-border investment income are large, PPP-adjusted GDP per capita and PPP-adjusted GNI per capita can tell different stories. GDP is a production-location measure; GNI is more closely tied to income accruing to residents. Neither is universally better—the correct choice depends on the question.
PPP reduces exchange-rate distortions but is not a personal cost-of-living index
Market exchange rates are influenced by financial flows and can differ substantially from the ratios implied by local prices of non-traded goods and services. PPPs use price comparisons for comparable goods and services to convert currencies into units with broadly similar purchasing power. That makes them especially useful for cross-country comparisons of real income levels.
PPP estimates are still statistical constructs. They do not capture every regional difference in housing, transport, healthcare, education, or consumption patterns. A national PPP is not the same thing as a personalized cost-of-living index for a household in a particular city.
The 2021 base year is essential to interpreting the number
The word ‘constant’ means that price changes over time have been removed using a reference price level. Here the reference is 2021. A 2025 figure of 50,000 does not mean an economy literally paid residents 50,000 nominal international dollars in 2025. It means the measured income corresponds to the purchasing power of 50,000 international dollars when expressed in 2021 prices.
This common price basis is what makes the series suitable for studying real growth in PPP-adjusted GNI per capita over time. A proper trend analysis should use the same constant-price series for every year rather than combining it with current-price observations.
Regional medians provide context but hide large within-region gaps
Using simple country medians from the latest observations, Europe is highest at about 46,355, followed by North America at about 22,940, South America at 18,313, Asia at 17,023, Oceania at 7,590, and Africa at 4,181 constant 2021 international dollars. These are descriptive medians, not official World Bank regional aggregates weighted by population.
Within-region spreads are enormous. Asia includes Singapore above 116,000 as well as economies near two thousand. North America includes Bermuda above 110,000 and much lower-income Caribbean and Central American economies. A regional median is useful for orientation but should not replace country-level context.
Per-capita income does not describe distribution
Dividing GNI by population makes economies of different sizes easier to compare, but it removes information about who receives the income. A high GNI per capita can coexist with large inequality and a much lower median household income. Poverty rates, median income, household surveys, and inequality measures are needed to understand distribution.
GNI per capita also does not directly measure the value of unpaid work, environmental costs, leisure, health outcomes, or the quality of public services. It is an important measure of economic resources, not a complete measure of well-being.
Small high-income economies can be hard to see on the world map
One hundred sixty-one of the 197 observations match directly to the low-resolution world boundary layer. Thirty-six mostly small states and territories—including Andorra, Bahrain, Bermuda, Hong Kong, Macao, Maldives, Singapore, and several Pacific and Caribbean economies—do not have separate matching polygons in that layer.
Those unmatched economies are not removed from the rankings or summary statistics. That matters because several of the highest GNI-per-capita observations belong to geographically small economies. The map is useful for spatial patterns, but the tables are necessary for a complete top-end comparison.
Observation years are recent enough for broad comparison, but not identical
The latest-observation design maximizes coverage while keeping the period gap relatively narrow: all observations fall between 2021 and 2025. That is far more comparable than a dataset mixing decades, but a four-year gap can still matter during periods of rapid growth, recession, inflation, exchange-rate adjustment, or major commodity-price changes.
For precise pairwise comparisons, the 2025 subset is preferable whenever both economies have a 2025 observation. For maximum geographic coverage, the full latest-value dataset is appropriate as long as the year is shown alongside the value.
Data source and calculation method
The source is World Bank indicator `NY.GNP.PCAP.PP.KD`, ‘GNI per capita, PPP (constant 2021 international $).’ The verified dataset contains the most recent non-empty official observation for each of 197 countries and territories. Observation years range from 2021 through 2025, and the value is expressed per person in constant 2021 international dollars.
The mean, median, quartiles, rankings, year counts, regional descriptive medians, and 2025 subset statistics are calculated directly from the 197 observations. Missing economies are not filled with zero. ISO3 codes are joined to a low-resolution global boundary layer, producing 161 direct polygon matches; all unmatched small economies remain in the statistical analysis.
Frequently Asked Questions
What is the difference between current PPP dollars and constant 2021 PPP dollars?
Current international dollars reflect the price structure of each period. Constant 2021 international dollars remove general price changes and express every year on a 2021 price basis, which is better suited to real time-series comparisons.
Is GNI per capita at PPP the same as GDP per capita at PPP?
No. GDP measures production within the economy, while GNI adjusts GDP for primary income received from and paid to the rest of the world.
Does high GNI per capita mean every resident has a high income?
No. It is an average national-accounts measure and does not show distribution. Median income, poverty, and inequality indicators provide additional context.
Related Articles
Green Map creates custom-edited map images using open geographic data sources such as geoBoundaries, Natural Earth, OpenStreetMap, and government open data. These maps are edited visual materials, not raw data files, and are provided for education, documents, presentations, and graphic reference.