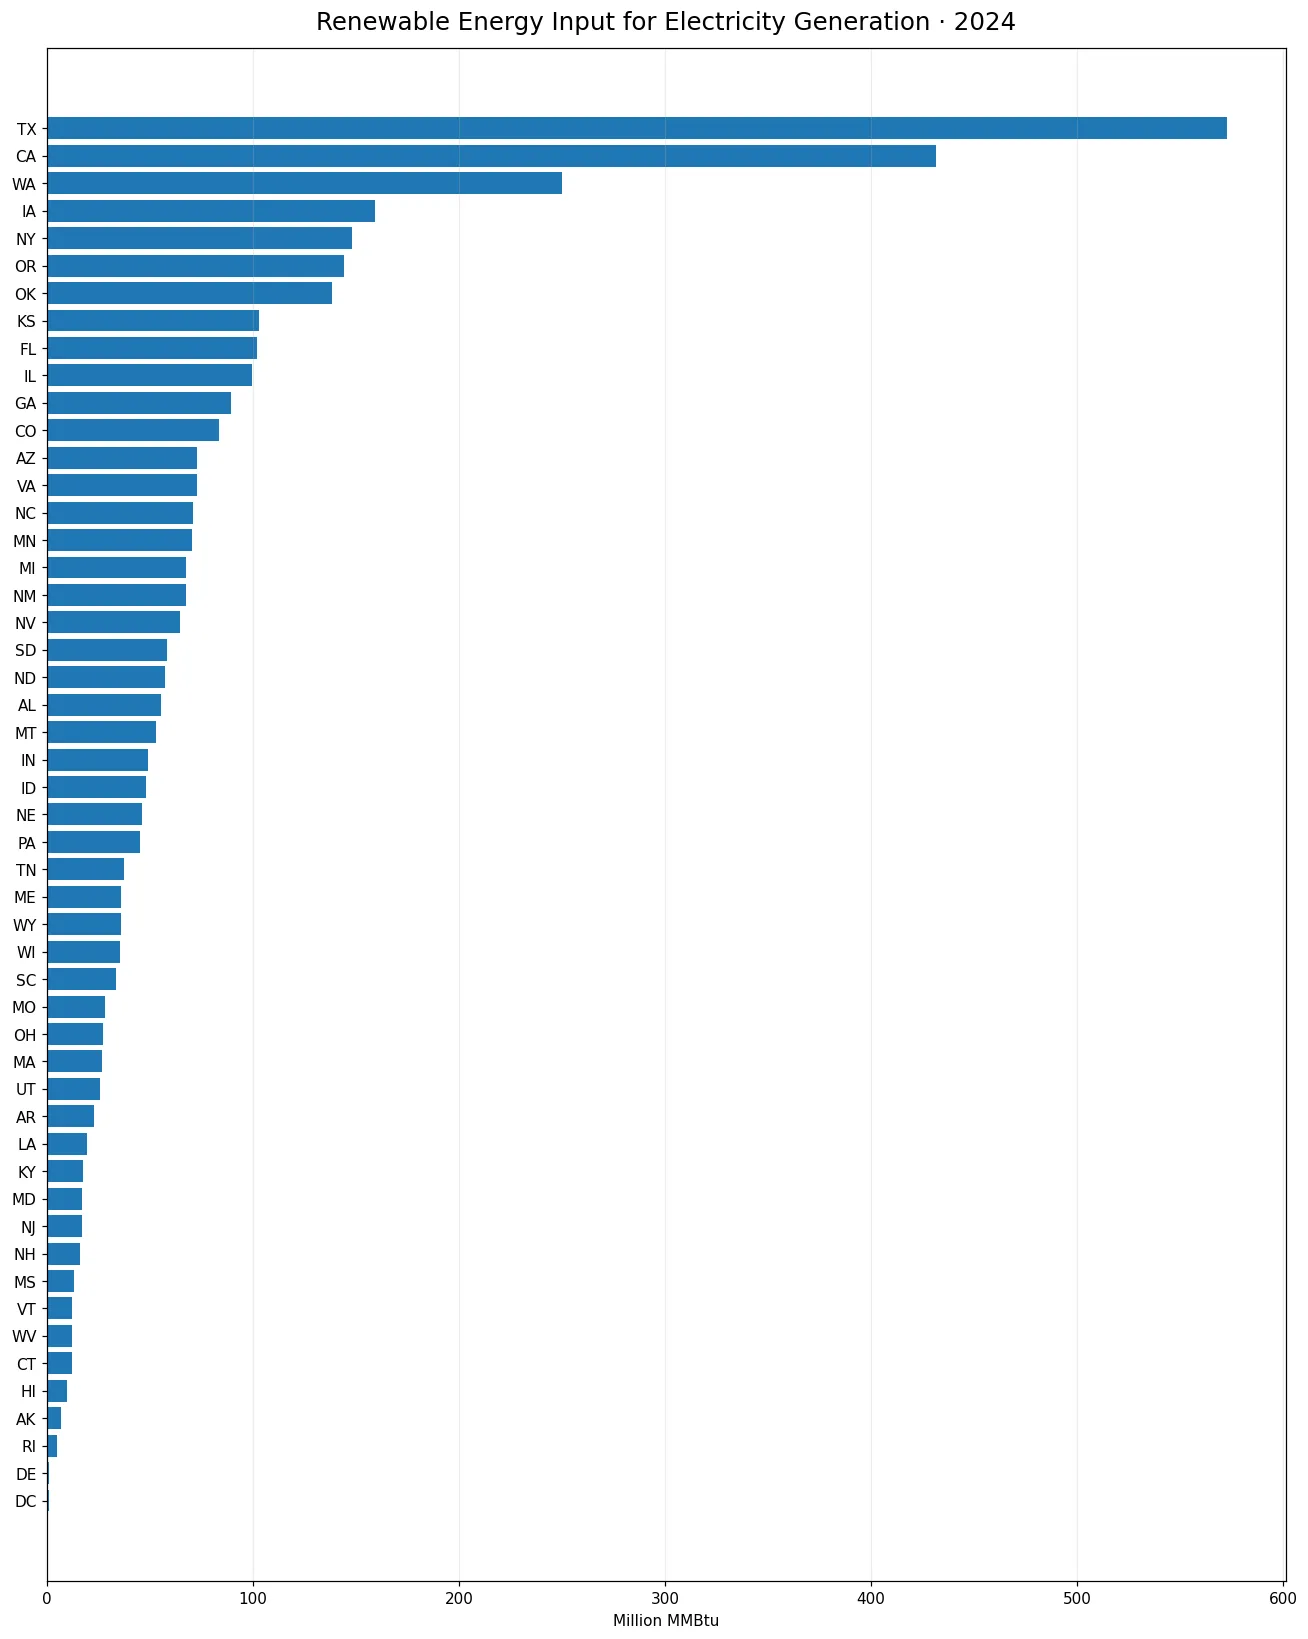
U.S. Energy Information Administration data for 2024 show a highly concentrated state pattern in renewable fuel consumption assigned to useful thermal output within the electric power sector. Across 50 states and the District of Columbia, the 51 observations sum to 34.45 million MMBtu. Maine recorded 7.10, Florida 6.75, and California 5.40 million MMBtu. Together, those three states accounted for about 55.9% of the total.
This is not a ranking of renewable electricity generation, renewable capacity, or total renewable energy consumption. The EIA series measures fuel consumption associated with useful thermal output in the Electric Power sector, using the all-renewables aggregate. It is therefore best read as a narrow indicator of where renewable fuel inputs assigned to useful heat were reported, not as a general scorecard for state renewable energy performance.
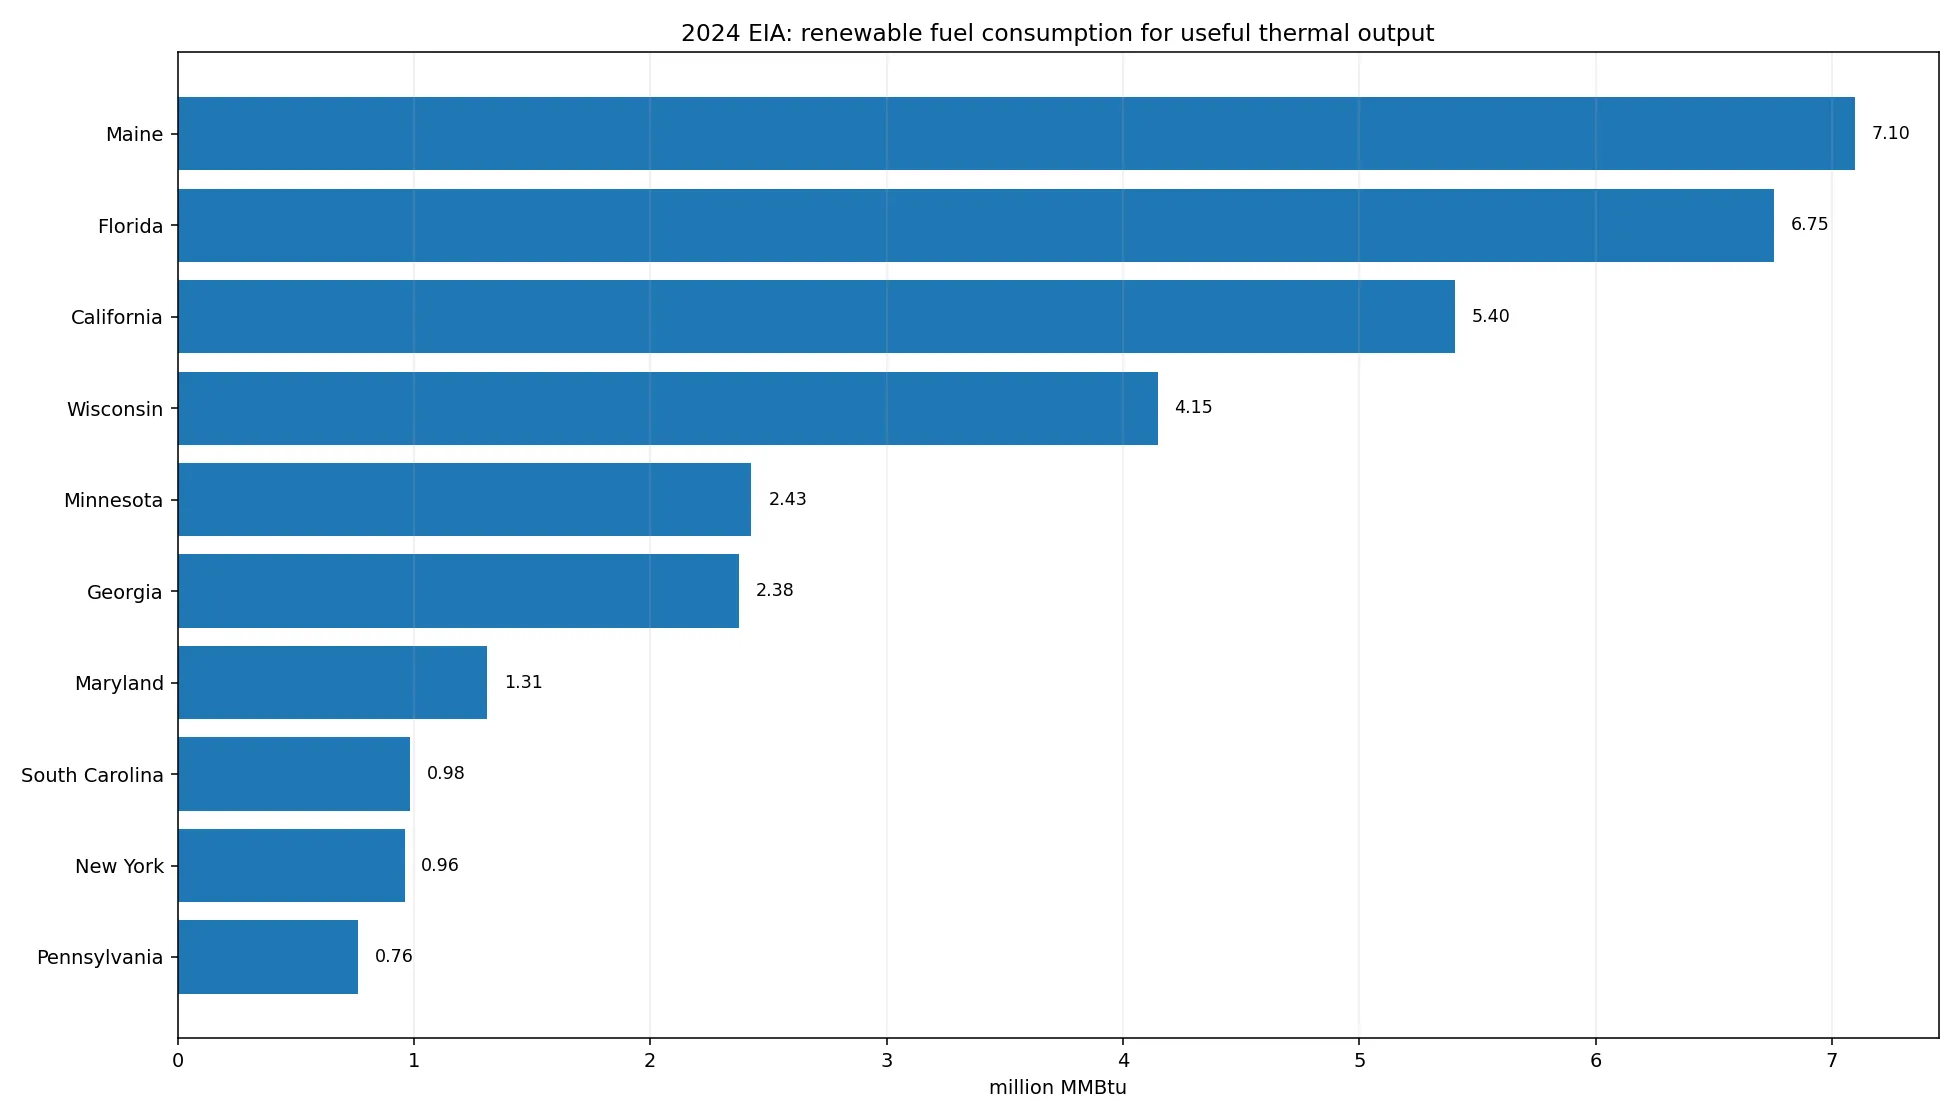
Table of Contents
A small group of states dominated the 2024 total
Maine and Florida alone represented about 40.2% of the 51-jurisdiction total. Adding California raised the cumulative share to 55.9%, and adding Wisconsin brought it to 67.9%. The first six states—Maine, Florida, California, Wisconsin, Minnesota, and Georgia—accounted for 81.9%. This steep concentration is more informative than the rank order by itself because it shows how quickly the national total is accumulated.
The two largest observations were relatively close to each other: Maine exceeded Florida by only about 0.34 million MMBtu. The gap then widened. California was roughly 1.35 million MMBtu below Florida, while Wisconsin was another 1.26 below California. After the first six states, every individual state contributed less than 4% of the total.
Top 10 states by reported value
| State | 2024 value (million MMBtu) | Share of total |
|---|---|---|
| Maine | 7.10 | 20.6% |
| Florida | 6.75 | 19.6% |
| California | 5.40 | 15.7% |
| Wisconsin | 4.15 | 12.0% |
| Minnesota | 2.43 | 7.0% |
| Georgia | 2.38 | 6.9% |
| Maryland | 1.31 | 3.8% |
| South Carolina | 0.98 | 2.9% |
| New York | 0.96 | 2.8% |
| Pennsylvania | 0.76 | 2.2% |
The top 10 states summed to 32.22 million MMBtu, or 93.5% of the total. Below Pennsylvania, the positive observations were North Carolina at 0.54, New Jersey at 0.50, Idaho at 0.41, Ohio at 0.32, Colorado at 0.29, Michigan at 0.10, Illinois at 0.05, and Oregon at 0.005 million MMBtu after rounding to three decimals.
Zero observations are not the same as missing data
Only 18 of the 51 state-level observations were above zero. The other 33 states or the District of Columbia entries were reported as 0.0 in the source data. Those zeros should not be silently converted to missing values. A reported zero describes the value of this specific EIA series for that jurisdiction and year, whereas missing data would mean the value was unavailable or not observed.
This distinction matters for summary statistics. The median across all 51 observations is zero because most jurisdictions have a reported zero. Among the 18 positive observations, however, the median is about 0.86 million MMBtu. Looking only at an overall mean or median would hide the combination of many zeros and a small number of comparatively large positive values.
What “useful thermal output” means in this context
EIA state electricity documentation explains that fuel consumption at combined heat and power facilities is allocated between electricity generation and useful thermal output. Useful thermal output refers to heat that is put to a productive use rather than simply being discarded. The series analyzed here isolates the fuel consumption assigned to that useful-heat side of the operation for the all-renewables fuel category within the Electric Power sector.
That definition explains why the results can look very different from familiar renewable-energy rankings. A state can have large wind or solar generation and still record little or no fuel consumption for useful thermal output. Conversely, a state with facilities that use renewable fuels to provide useful heat alongside electricity can appear prominently in this measure even if it is not among the largest states for total renewable electricity generation.
Maine, Florida, California and Wisconsin shaped the distribution
Maine led the 2024 observations at 7.10 million MMBtu, equal to about 20.6% of the total. Florida followed at 6.75 million MMBtu, or 19.6%. California contributed 5.40 million MMBtu, about 15.7%, and Wisconsin added 4.15 million MMBtu, about 12.0%. Taken together, the top four states represented roughly 67.9% of all reported consumption in this state slice.
Minnesota and Georgia formed a second tier, with 2.43 and 2.38 million MMBtu respectively. Maryland was next at 1.31. After Maryland, no state exceeded 1.0 million MMBtu except South Carolina at 0.98 and New York at 0.96, both just below that threshold. The sharp drop from the leaders to the rest is a defining feature of the 2024 distribution.
What the data can and cannot establish
The data can establish the relative size of the state observations for this specific EIA metric, the number of zero and positive values, the total across the 51 jurisdictions, and concentration measures such as the share held by the top three or top ten states. These statements are direct calculations from a common-year, common-definition dataset.
The dataset does not by itself establish why one state is higher than another. Possible influences could include the presence and scale of combined heat and power facilities, the types of renewable fuels used, industrial or district-heating demand, plant operating patterns, and reporting composition. Those factors require additional plant-level or fuel-specific evidence. They should not be inferred from the state totals alone.
How to read the 2024 comparison
First, this is a one-year snapshot. It does not tell us whether a state has been consistently high or whether 2024 was unusual. A trend analysis would require the same EIA series across multiple years. Second, the values should be compared in the source unit, million MMBtu, unless all observations are converted consistently before comparison.
Third, the sector and fuel filters are narrow: Electric Power and all renewables. The figures do not cover every renewable energy use in households, commercial buildings, transportation, or industry. They also do not measure renewable electricity output. The safest interpretation is therefore precise: these are 2024 state observations for renewable fuel consumption allocated to useful thermal output in the U.S. electric power sector.
Source and calculation notes
The source is the U.S. Energy Information Administration Electricity API v2, Electric Power Operational Data, annual frequency, for 2024. The comparison contains 50 states plus the District of Columbia. Shares were calculated by dividing each state value by the sum of all 51 observations. Reported zero values were retained as zeros, and no missing values were replaced with zero.
The resulting picture is clear even without making assumptions about causation. In 2024, three states supplied more than half of the measured total, four states supplied more than two-thirds, and the top 10 supplied about 93.5%. At the same time, most jurisdictions recorded zero in this specific series. That combination of concentration and many zeros is the central statistical feature of the data.
Frequently Asked Questions
Which state had the highest 2024 value?
Maine ranked first at 7.10 million MMBtu, followed by Florida at 6.75 and California at 5.40. Together the three states represented about 55.9% of the total.
Does this metric measure renewable electricity generation?
No. It measures renewable fuel consumption allocated to useful thermal output within the Electric Power sector, not electricity generation or installed capacity.
Do the 0.0 state values mean the data are missing?
No. The 0.0 entries are reported observations in this series. They are different from missing values and were retained as zeros in the calculations.
Related Articles
Green Map creates custom-edited map images using open geographic data sources such as geoBoundaries, Natural Earth, OpenStreetMap, and government open data. These maps are edited visual materials, not raw data files, and are provided for education, documents, presentations, and graphic reference.