Eurostat’s 2025 house price index shows a wide spread in how far national housing prices have moved from the 2015 benchmark. In the 28 verified country observations, Hungary recorded the highest index at 366.62, followed by Portugal at 263.85, Iceland at 263.10, and Lithuania at 258.11. Finland was the only country below the 2015 reference level, at 99.03. The median was 188.90 and the mean was 194.53. Those numbers are useful, but only if the index is interpreted correctly.
This is an annual-average house price index with 2015 set equal to 100. Hungary’s 366.62 therefore does not mean that homes there were more expensive in absolute terms than homes in every other country. It means the national house price index was about 266.62% above its own 2015 reference level. Portugal’s 263.85 corresponds to roughly 163.85% above 2015, while Germany’s 152.70 corresponds to about 52.70% above 2015. The measure compares cumulative price movement from a common base year, not the cash price of a typical home.
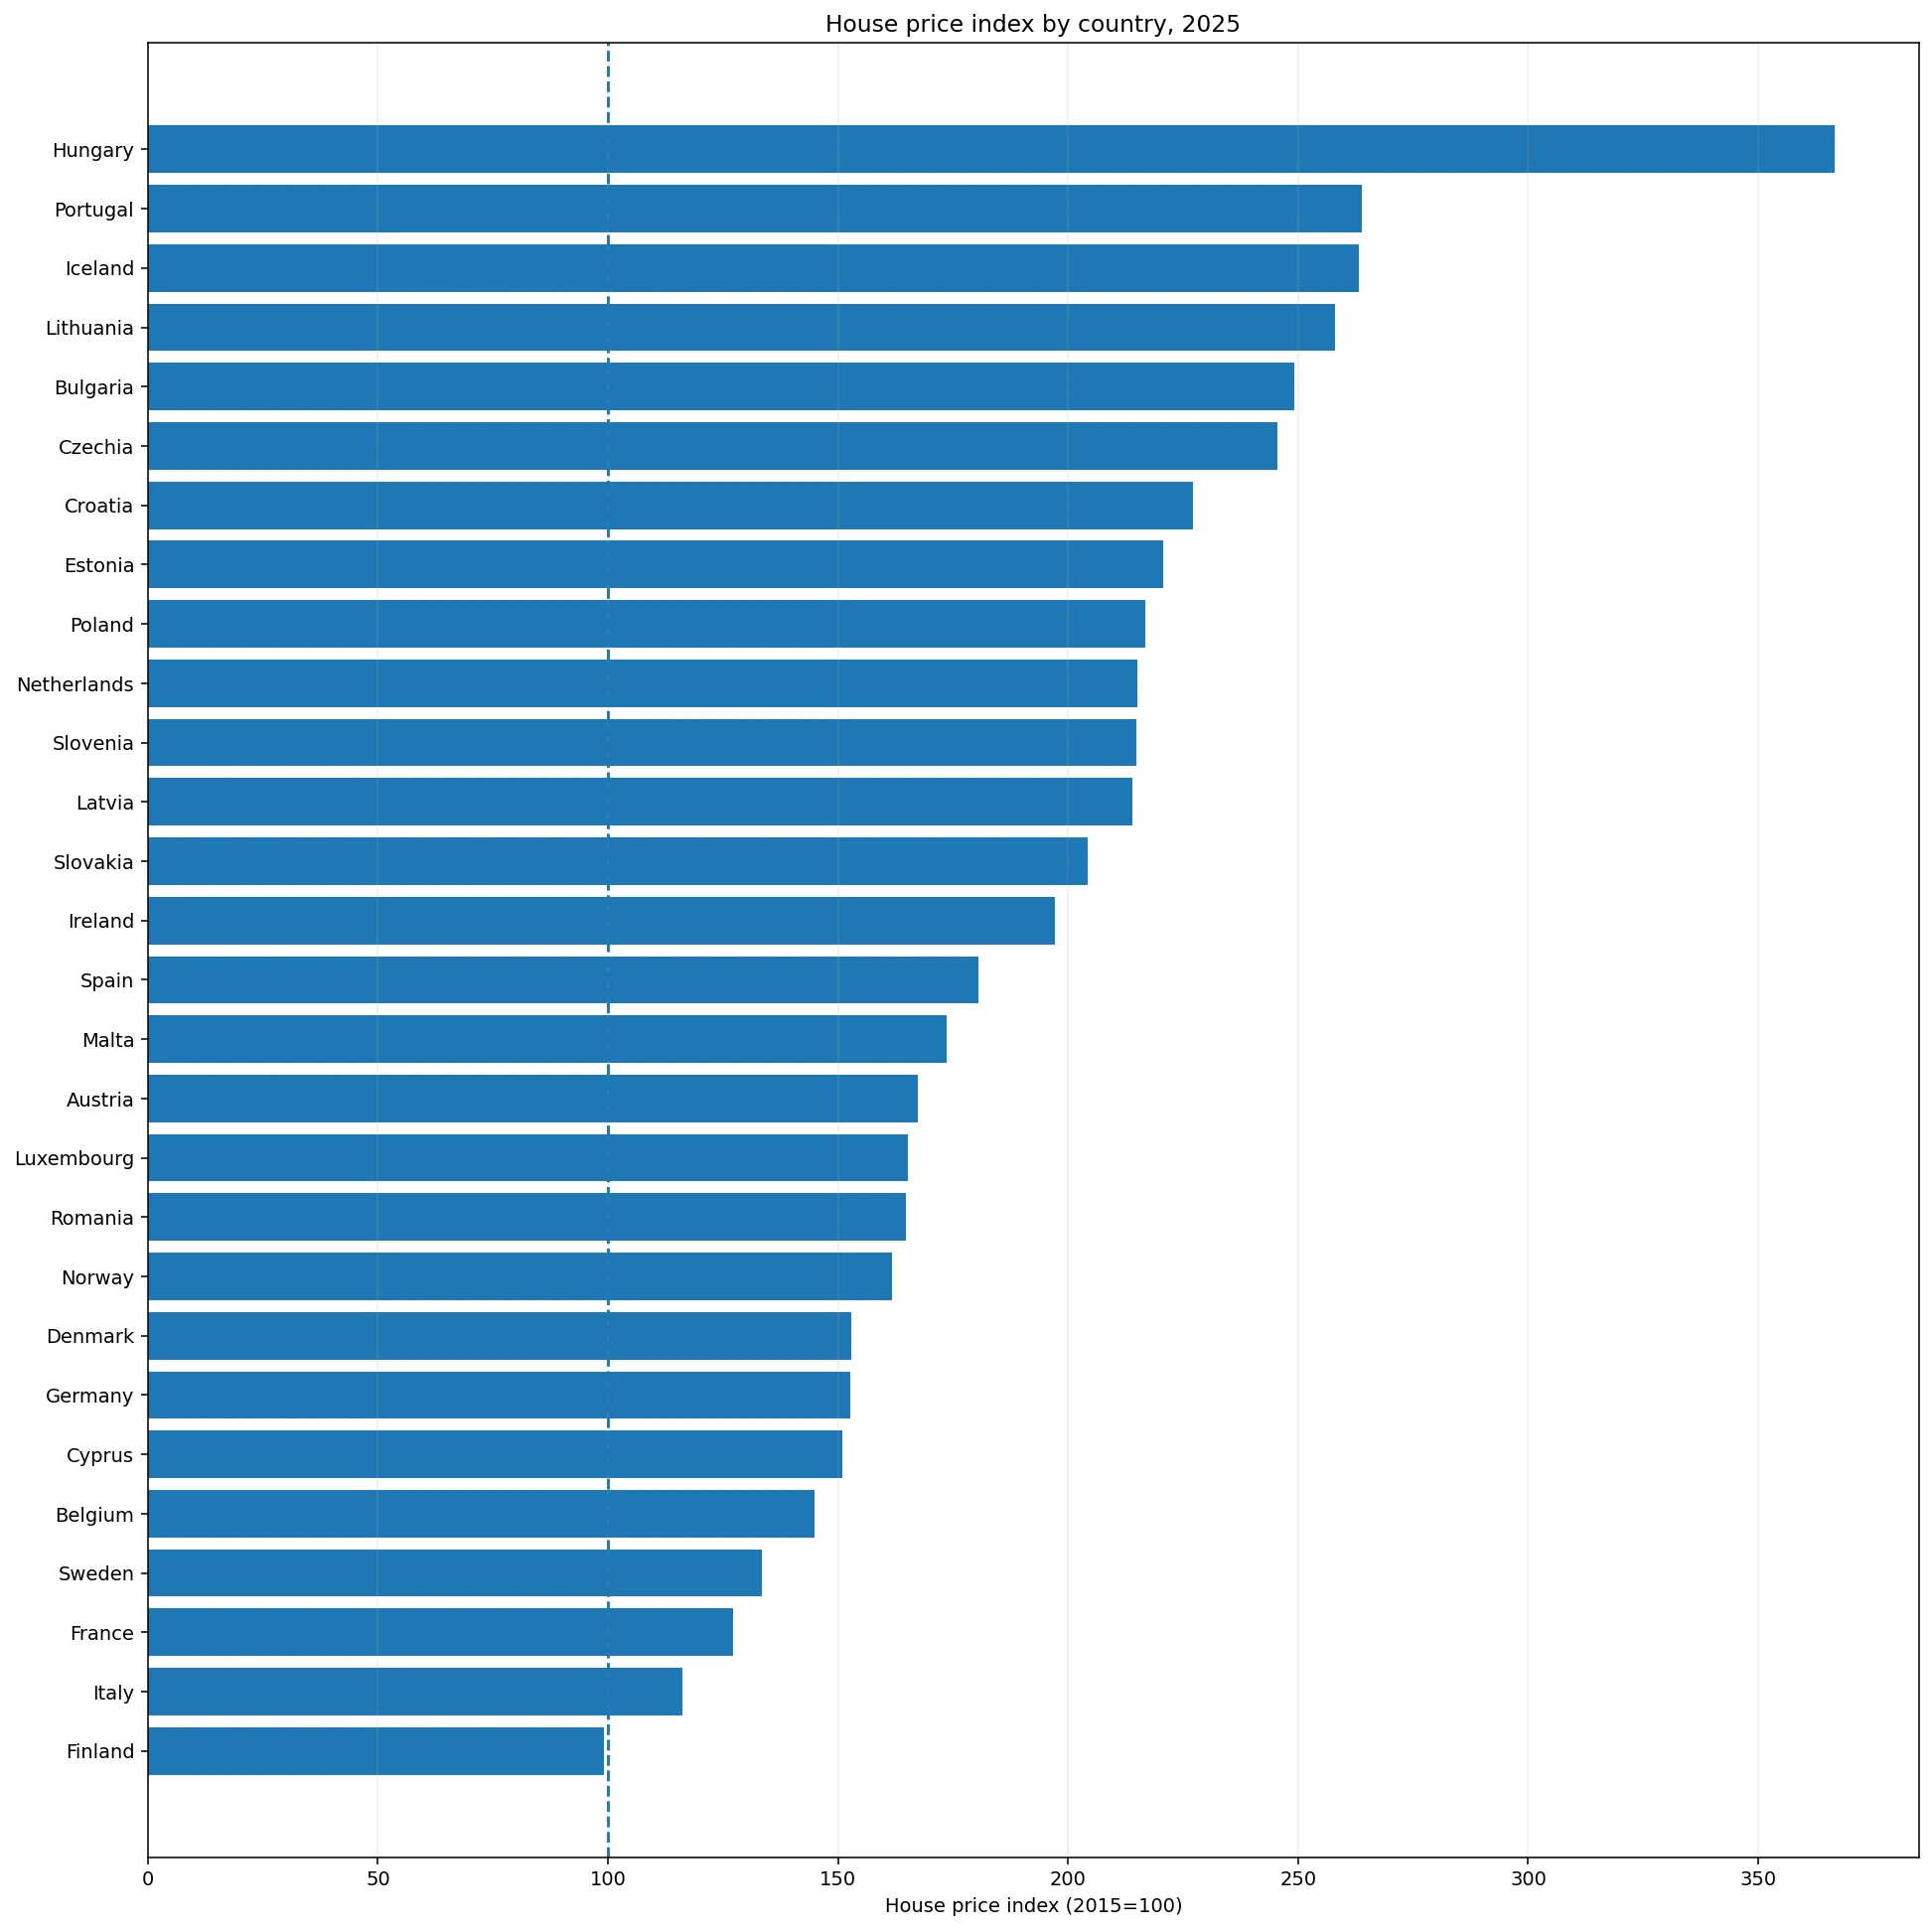
Table of Contents
The median 2025 index was 188.90
The median of 188.90 means half of the 28 observations were above that level and half were below it. Because the benchmark is 100 in 2015, the median country in this set had a 2025 index about 88.90% above its 2015 level. The mean was slightly higher at 194.53, reflecting the influence of unusually high values such as Hungary. The first quartile was 152.81 and the third quartile was 222.31, so the middle half of observations sat within a range of roughly 69.5 index points.
Twenty-seven of the 28 countries were above 100 and only Finland was below it. Twenty-three were at or above 150, meaning their 2025 index was at least 50% higher than the 2015 benchmark. Thirteen were at or above 200, so their index had at least doubled relative to 2015. Four were at or above 250. These thresholds make the scale of the cumulative move easier to see, while still avoiding the mistake of treating the index as a direct measure of affordability or absolute price.
Hungary stood far above the rest of the distribution
Hungary’s 366.62 was the clear maximum. Subtracting the 2015 base of 100 gives a simple interpretation: the 2025 index stood about 266.62% above the benchmark. Portugal came next at 263.85, or about 163.85% above 2015, followed by Iceland at 263.10 and Lithuania at 258.11. Bulgaria reached 249.23, Czechia 245.40, Croatia 227.09, and Estonia 220.72. Poland and the Netherlands rounded out the top ten at 216.80 and 215.15.
| Country | 2025 index (2015=100) | Change from 2015 benchmark |
|---|---|---|
| Hungary | 366.62 | 266.62% |
| Portugal | 263.85 | 163.85% |
| Iceland | 263.10 | 163.10% |
| Lithuania | 258.11 | 158.11% |
| Bulgaria | 249.23 | 149.23% |
| Czechia | 245.40 | 145.40% |
| Croatia | 227.09 | 127.09% |
| Estonia | 220.72 | 120.72% |
| Poland | 216.80 | 116.80% |
| Netherlands | 215.15 | 115.15% |
The ranking does not imply that Hungary had Europe’s most expensive housing market in euros, nor that the Netherlands had more expensive homes than France. It only says that the price index in each country has moved farther from its own 2015 starting point. Two countries can have very different actual home prices while posting similar index values, and two countries with similar home prices can have very different index values if their 2015 starting levels were different.
Thirteen countries were at least double the 2015 benchmark
The countries with an index of 200 or more were Hungary, Portugal, Iceland, Lithuania, Bulgaria, Czechia, Croatia, Estonia, Poland, the Netherlands, Slovenia, Latvia, and Slovakia. In index terms, each had reached at least twice its 2015 reference level by the 2025 annual average. Ireland, at 197.19, sat just below that threshold, while Spain was 180.60 and Malta 173.55.
It would be tempting to explain this group with a single story, but the dataset does not support that. House prices can be influenced by mortgage rates, housing supply, household income, construction costs, population change, urban concentration, credit conditions, and investment demand. None of those causal variables is contained in this four-column dataset. The defensible conclusion is therefore about the size of the cumulative index change, not about why each country reached its 2025 value.
Finland was the only observation below 100
At the lower end, Finland recorded 99.03, about 0.97% below the 2015 reference level. Italy was 116.20, France 127.26, Sweden 133.41, and Belgium 144.86. Even the lower part of the ranking therefore consisted mostly of countries whose national house price index was above the 2015 benchmark. “Lower” in this table means a smaller cumulative increase since the base year, not necessarily cheap housing.
| Country | 2025 index (2015=100) | Change from 2015 benchmark |
|---|---|---|
| Belgium | 144.86 | 44.86% |
| Sweden | 133.41 | 33.41% |
| France | 127.26 | 27.26% |
| Italy | 116.20 | 16.20% |
| Finland | 99.03 | -0.97% |
Finland’s value also should not be read as proof that every region or dwelling type there was cheaper than in 2015. A national annual-average index combines many transactions and geographic markets. Capital regions, smaller cities, apartments, and detached houses can follow different paths. A national index is designed to summarize the broad price trend, not to replace detailed local-market data.
Nearby countries often followed very different paths
The 2025 values show substantial variation even within broad European subregions. In western Europe, the Netherlands was at 215.15 while Belgium was 144.86 and France 127.26. Germany was 152.70, Luxembourg 165.14, and Austria 167.33. In northern Europe, Iceland reached 263.10, compared with Norway at 161.66, Denmark at 152.84, Sweden at 133.41, and Finland at 99.03. Geographic proximity clearly did not produce a uniform index outcome.
Southern Europe shows a similarly wide spread. Portugal was at 263.85, Spain 180.60, Italy 116.20, Malta 173.55, and Cyprus 150.89. These gaps are informative because the measure uses the same 2015=100 concept, but they still do not reveal when the price increases occurred. A country may have risen rapidly early in the decade and then flattened, while another may have accelerated more recently. A 2025 annual snapshot cannot distinguish those paths.
This index is not an absolute house-price ranking
An index rebases every country to 100 in the same reference year. That design makes percentage-like changes comparable, but it deliberately discards the original price level. If Country A has an index of 250 and Country B has an index of 150, A has experienced a larger increase relative to 2015. It does not follow that the average dwelling in A costs more than the average dwelling in B. Currency, dwelling size, housing quality, transaction mix, and the original 2015 price level all matter for absolute-price comparisons.
The same caution applies to affordability. A fast-rising house price index may signal stronger price pressure, but affordability depends on income, wages, interest rates, borrowing conditions, taxes, rents, and other household costs. If incomes rise strongly alongside house prices, the affordability effect can differ from a country where incomes are flat. Conversely, even a modest price increase can feel severe when mortgage rates or financing costs rise. This dataset is therefore best used as a measure of price movement, not as a complete housing-stress indicator.
The verified 2025 coverage contains 28 countries
The dataset used here contains 28 country observations reported for 2025 in the Eurostat house price index table. It is not a complete world dataset, so the ranking should not be described as a global league table. The geographic scope is European and reflects the observations present in the verified extract. That limitation is important because titles such as “the country with the fastest house-price rise in the world” would overstate what the data can establish.
The 2025 figure is also an annual average rather than a single month or quarter. Annual averages are useful for reducing short-term volatility and comparing broad yearly levels, but they can lag a sharp turn late in the year. If prices accelerated or declined strongly during the final quarters of 2025, the annual average would blend that movement with earlier quarters. A current-market assessment should therefore pair the annual series with quarterly data when available.
What the 2025 comparison tells us most clearly
The strongest conclusion is that cumulative house-price movement since 2015 varied dramatically across these 28 countries. The median index was 188.90, thirteen countries were at or above 200, and twenty-three were at or above 150. Hungary was the maximum at 366.62, while Finland was the minimum at 99.03. The gap between the highest and lowest observations was 267.59 index points, showing that the decade did not produce a uniform housing-price path across the region.
The most useful way to read the ranking is therefore to ask how far each country’s price index moved from its 2015 baseline. It should not be converted into a ranking of home values, affordability, investment quality, or housing-market health. The common base year gives the series its comparability; the absence of absolute prices and local detail defines its limits. Keeping those two points together makes the 2025 country comparison much more informative.
Frequently Asked Questions
Which country had the highest house price index in 2025?
Hungary had the highest value among the 28 verified observations at 366.62. With 2015=100, that is about 266.62% above its 2015 benchmark.
Does an index of 200 mean homes are twice as expensive as in another country?
No. It means that country’s house price index is twice its own 2015 reference level. The index does not compare absolute home prices across countries.
Was any country below its 2015 benchmark in 2025?
Finland was the only verified observation below 100, at 99.03.
Related Articles
Green Map creates custom-edited map images using open geographic data sources such as geoBoundaries, Natural Earth, OpenStreetMap, and government open data. These maps are edited visual materials, not raw data files, and are provided for education, documents, presentations, and graphic reference.