The male youth employment-to-population ratio asks a specific question: what percentage of all men aged 15–24 are employed? The World Bank national-estimate series SL.EMP.1524.SP.MA.NE.ZS uses the entire male population in that age band as its denominator. That includes students, jobseekers and young men outside the labor force as well as those who are working. It therefore measures the presence of employment within the male youth population, not the success rate of people who are already participating in the labor market.
For 2024, the verified file contains 104 reporting economies and 113 economies with no observation. Missing records are preserved as missing rather than replaced with zero. Because this is a male-only indicator, the values should not be treated as the overall youth employment rate and they do not reveal the female rate. A gender comparison requires a matching female series for the same year and definition.
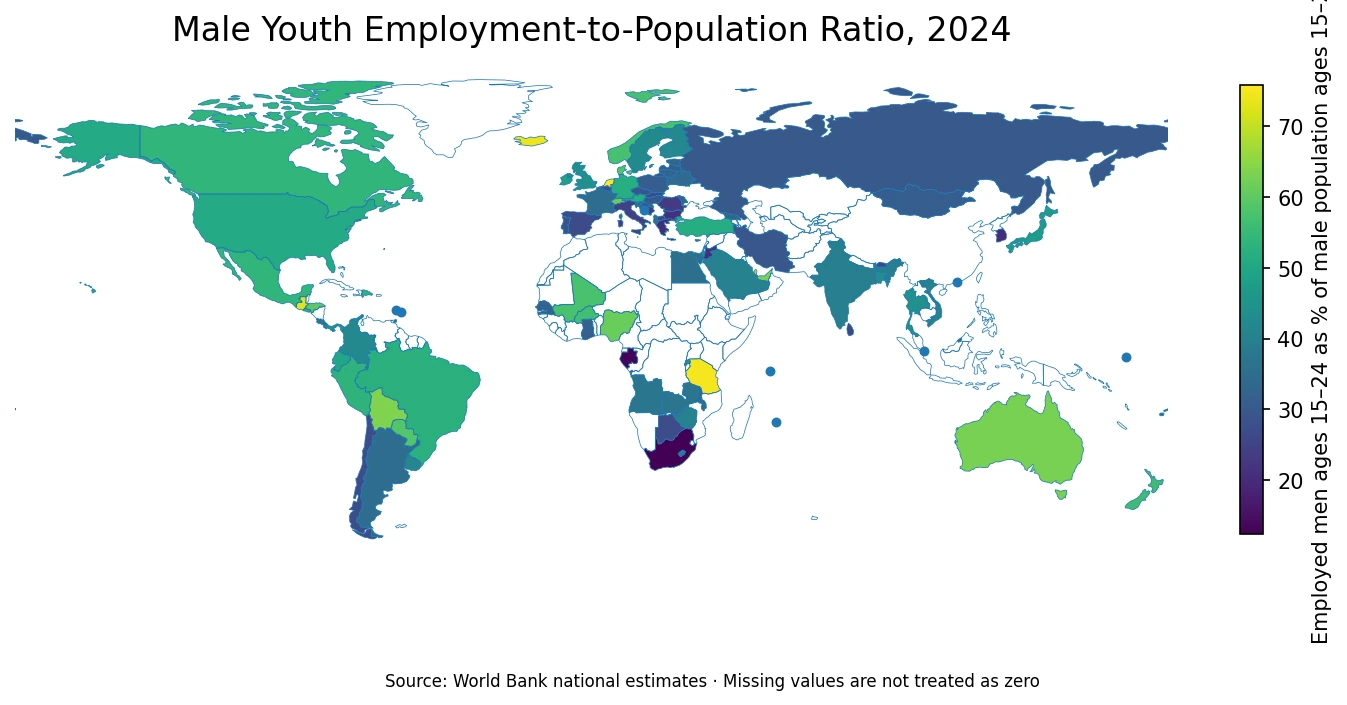
Table of Contents
The median among 104 reporting economies is 37.0%
The simple mean across the 104 available observations is 40.54%, while the median is 37.01%. The first quartile is 30.78% and the third quartile is 51.76%, placing the middle half of reporting economies between roughly 30.8% and 51.8%. The 10th percentile is 25.78% and the 90th percentile is 59.56%. The distance from the minimum to the maximum is 63.46 percentage points, showing how differently employment is embedded in the lives of young men across countries.
There are 10 economies at or above 60%, and 29 at or above 50%. At the other end, 25 economies are below 30% and 2 are below 20%. A single global average therefore hides a very wide distribution. Some economies have more than seven employed young men for every ten men in the age group, while the lowest observations are close to one employed person in eight.
The denominator is all men ages 15–24, not just the labor force
A value of 40% can be read as about 40 employed men for every 100 men aged 15–24. The remaining 60 are not synonymous with unemployed people. They can include full-time students, people who are not seeking work, young men performing other activities outside the labor market and unemployed jobseekers. The unemployment rate answers a narrower labor-force question because its denominator excludes people who are neither working nor actively seeking work.
This denominator difference is crucial when comparing youth labor markets. A low employment-to-population ratio accompanied by low unemployment could occur where many young men remain in education and do not participate in the labor force. A low employment ratio combined with high unemployment could instead indicate substantial difficulty finding work among those who do participate. Labor-force participation, school enrollment and NEET indicators are needed to distinguish these situations.
The Netherlands, Tanzania, Iceland and Guatemala all exceed 70%
The Netherlands records the highest 2024 value at 75.858%. Tanzania is close behind at 74.902%, Iceland at 73.948% and Guatemala at 72.942%. Qatar reaches 69.216%, followed by Bolivia at 63.701%, the United Arab Emirates at 63.037%, Australia at 62.828%, Switzerland at 61.440% and Nigeria at 61.245%. The top ten span several continents, so a high value cannot be reduced to one regional labor-market model.
| Economy | Male employment-to-population ratio, ages 15–24 |
|---|---|
| Netherlands | 75.9% |
| Tanzania | 74.9% |
| Iceland | 73.9% |
| Guatemala | 72.9% |
| Qatar | 69.2% |
| Bolivia | 63.7% |
| United Arab Emirates | 63.0% |
| Australia | 62.8% |
| Switzerland | 61.4% |
| Nigeria | 61.2% |
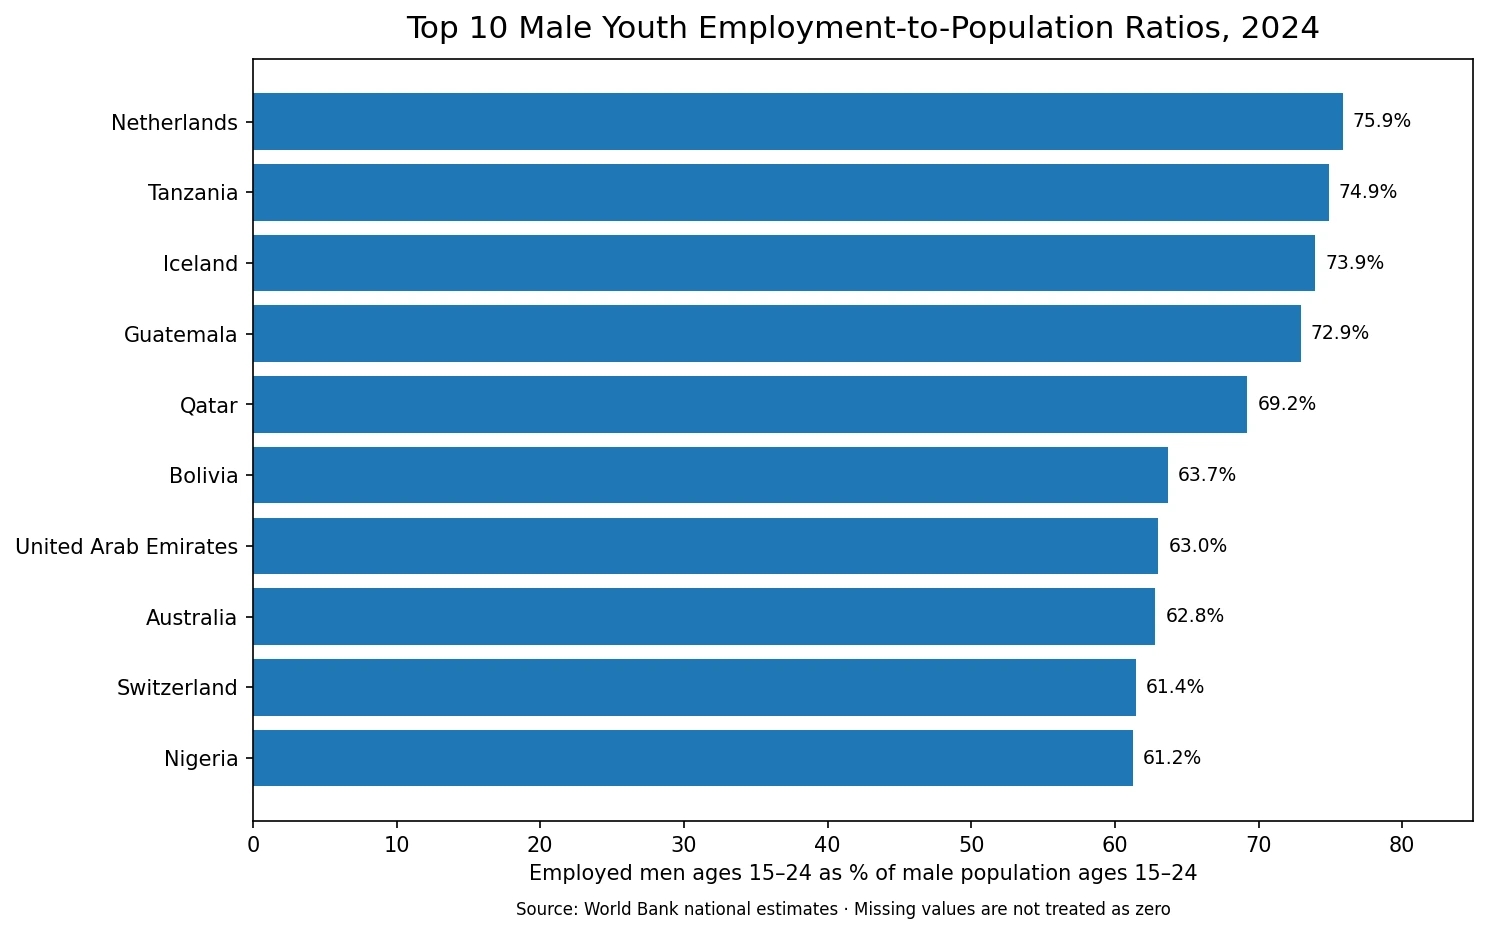
The same percentage can arise through very different pathways. In one economy, many students may hold part-time jobs while remaining in school. In another, young men may leave education earlier and enter full-time, self-employed or informal work. The indicator classifies employment status but does not tell us whether jobs are well paid, secure, formal or matched to a young worker’s skills. The upper end of the table should therefore be read as high employment participation, not as a ranking of job quality.
South Africa and Gabon sit far below the upper end of the distribution
South Africa has the lowest reported value at 12.403%, followed by Gabon at 13.151%. Greece records 20.159%, Bulgaria 20.670% and Jordan 20.818%. Bosnia and Herzegovina is at 23.469%, Romania at 23.523% and Italy at 24.004%. These values mean that a relatively small share of the entire male population aged 15–24 is employed, but they do not reveal why the remainder is not working.
A low ratio can reflect long participation in education, weak demand for young workers, high unemployment, delayed entry into the labor market or several of these factors at once. The indicator cannot identify the mechanism. That is why comparisons based only on the bottom of the ranking can be misleading. Two economies with similar ratios may have very different unemployment rates and very different shares of young men enrolled in education.
Europe shows a large internal spread rather than one common youth-employment pattern
European observations illustrate the dispersion clearly. The Netherlands reaches 75.86%, Iceland 73.95%, Denmark 58.39%, Norway 57.19% and Germany 52.27%. By contrast, Greece is at 20.16%, Bulgaria 20.67%, Italy 24.00%, Spain 26.78% and Portugal 28.66%. France records 34.72%, Finland 41.95% and Sweden 42.59%, placing them between those extremes.
These differences are consistent with the idea that the route from education into work varies sharply even among neighboring high-income economies, but the indicator alone does not identify the cause. Work-study combinations, apprenticeship structures, the timing of tertiary education, youth hiring conditions and business-cycle differences can all matter. The evidence in this dataset supports the size of the gap; it does not establish which institution or policy produced it.
Africa and the Americas also contain sharp contrasts within the same broad region
Among African reporting economies, Tanzania stands at 74.90% and Nigeria at 61.25%, while South Africa is at 12.40%, Gabon at 13.15% and Botswana at 27.05%. Angola records 37.31%, Zambia 37.09%, Zimbabwe 39.98% and Ghana 31.66%. The spread within Africa is therefore larger than the difference between many continental averages would suggest, and broad regional labels can obscure more than they explain.
In the Americas, Guatemala is at 72.94%, Honduras 59.97%, Paraguay 58.62%, Canada 53.94%, Mexico 53.82%, Peru 53.48%, Brazil 52.63% and the United States 50.90%. Chile is lower at 27.07%, Argentina at 35.04% and Uruguay at 41.31%. The range again shows that geography alone is not enough; education participation, entry age and the structure of available work can differ substantially within the same part of the world.
A male-only indicator cannot be used to infer the gender employment gap
This series contains only men ages 15–24. A male ratio of 60% does not tell us whether the female ratio in the same economy is 20%, 50% or 65%. Inferring a gender gap from the male observation alone would add information that is not present in the data. A valid comparison requires the corresponding female employment-to-population series for 2024 under the same national-estimate methodology.
The same caution applies to claims about gender equality. A high male youth employment ratio is not evidence that women and men have equal access to work, and a low male ratio does not by itself imply a narrow gender gap. Employment participation by sex, labor-force participation, unemployment, hours, earnings, informality and unpaid care all answer different parts of the broader question.
High employment participation does not automatically mean high-quality work
Employment status includes more than standard full-time jobs. Depending on national statistical definitions, people working short hours, contributing family workers, self-employed workers and people in informal activities can all be counted as employed. The ratio therefore cannot tell us whether a young man earns enough, has predictable hours, receives social protection or would prefer a different job. Those questions require additional indicators.
Nor should a low value automatically be treated as a failure. Where many young men remain in secondary or tertiary education, fewer may be employed at a given moment even if future employment prospects are strong. The most useful reading is descriptive: this ratio measures how much current employment is present across the entire male youth population. It is one piece of a transition-from-school-to-work picture, not a comprehensive score.
National estimates and a single year limit how precisely economies should be ranked
The “national estimate” label matters. Economies supply official labor-market statistics through national survey systems whose timing, sample design and detailed classification rules are not perfectly identical. The age band is standardized at 15–24, but small differences of one or two percentage points should not be treated as exact performance gaps without checking the underlying national sources. Larger differences are more informative about the broad distribution.
The comparison is also a 2024 snapshot. It does not show whether an economy is improving, deteriorating or returning to a pre-pandemic pattern. Youth employment can move with the business cycle, school calendars, seasonal industries and demographic change. A trend analysis should use several years from the same series and preferably extract them together, because international databases can revise historical observations when national statistics are updated.
Missing values remain missing, and map coverage is audited separately
Of the 217 economies in the cleaned country master, 104 contain a 2024 observation and 113 are source-missing. The mean, median, quartiles and rankings use only the 104 observed values. Replacing missing records with zero would falsely turn unavailable data into extremely low employment, so no such imputation is used. Unfilled map areas therefore need to be read as “no mapped observation,” not automatically as zero.
For the map, 93 reporting economies join directly to an offline low-resolution country polygon by ISO3 code. Eight additional small or unsupported economies with usable location coordinates are shown as point markers. Montenegro, West Bank and Gaza, and Kosovo have reported values in the statistics but no direct polygon or point representation in this base layer. These mapping limits do not remove their observations from the numerical analysis.
Other indicators help turn this percentage into a fuller labor-market picture
- Overall employment-to-population ratio for ages 15–24, to compare male youth with the full youth population.
- Male youth unemployment rate, which focuses on men ages 15–24 who are in the labor force.
- Male youth labor-force participation rate, showing how many young men are working or actively seeking work.
- NEET rate, which identifies young people outside employment, education and training.
- Hours, earnings, informality and job-security measures, which address dimensions of job quality that this ratio cannot show.
Combining these measures can distinguish situations that look identical in the employment-to-population ratio. If 40% of young men are employed and labor-force participation is 45%, most labor-force participants may be working. If employment is still 40% but participation is 70%, unemployment among participants could be much more substantial. Education and NEET measures then help explain what is happening to the remainder of the age group.
Data source and calculation
The analysis uses the World Bank indicator Employment to population ratio, ages 15-24, male (%) (national estimate), code SL.EMP.1524.SP.MA.NE.ZS for 2024. World Bank regional and income-group aggregates are excluded from the country/economy master. All descriptive statistics are calculated directly from the 104 non-missing observations, while the 113 source-missing records are preserved as missing.
All values are percentages. The map joins reporting rows to a low-resolution geographic layer by ISO3 code and adds point markers where coordinates are available for small economies without polygons. Reporting economies that cannot be drawn remain in the ranking and summary statistics. This keeps statistical coverage separate from the visual limitations of a simplified world map.
Frequently Asked Questions
Is the male youth employment-to-population ratio the same as the male youth unemployment rate?
No. The employment-to-population ratio uses all men ages 15–24 as the denominator, while the unemployment rate uses only the male youth labor force.
Does a higher male youth employment-to-population ratio always mean a better labor market?
No. It can reflect work while studying, earlier labor-market entry or different employment structures, and it does not measure wages, hours, informality or job security.
Do blank areas on the map mean 0%?
No. Missing 2024 observations remain missing, and some small reporting economies cannot be represented as polygons in the low-resolution base map.
Related Articles
Green Map creates custom-edited map images using open geographic data sources such as geoBoundaries, Natural Earth, OpenStreetMap, and government open data. These maps are edited visual materials, not raw data files, and are provided for education, documents, presentations, and graphic reference.