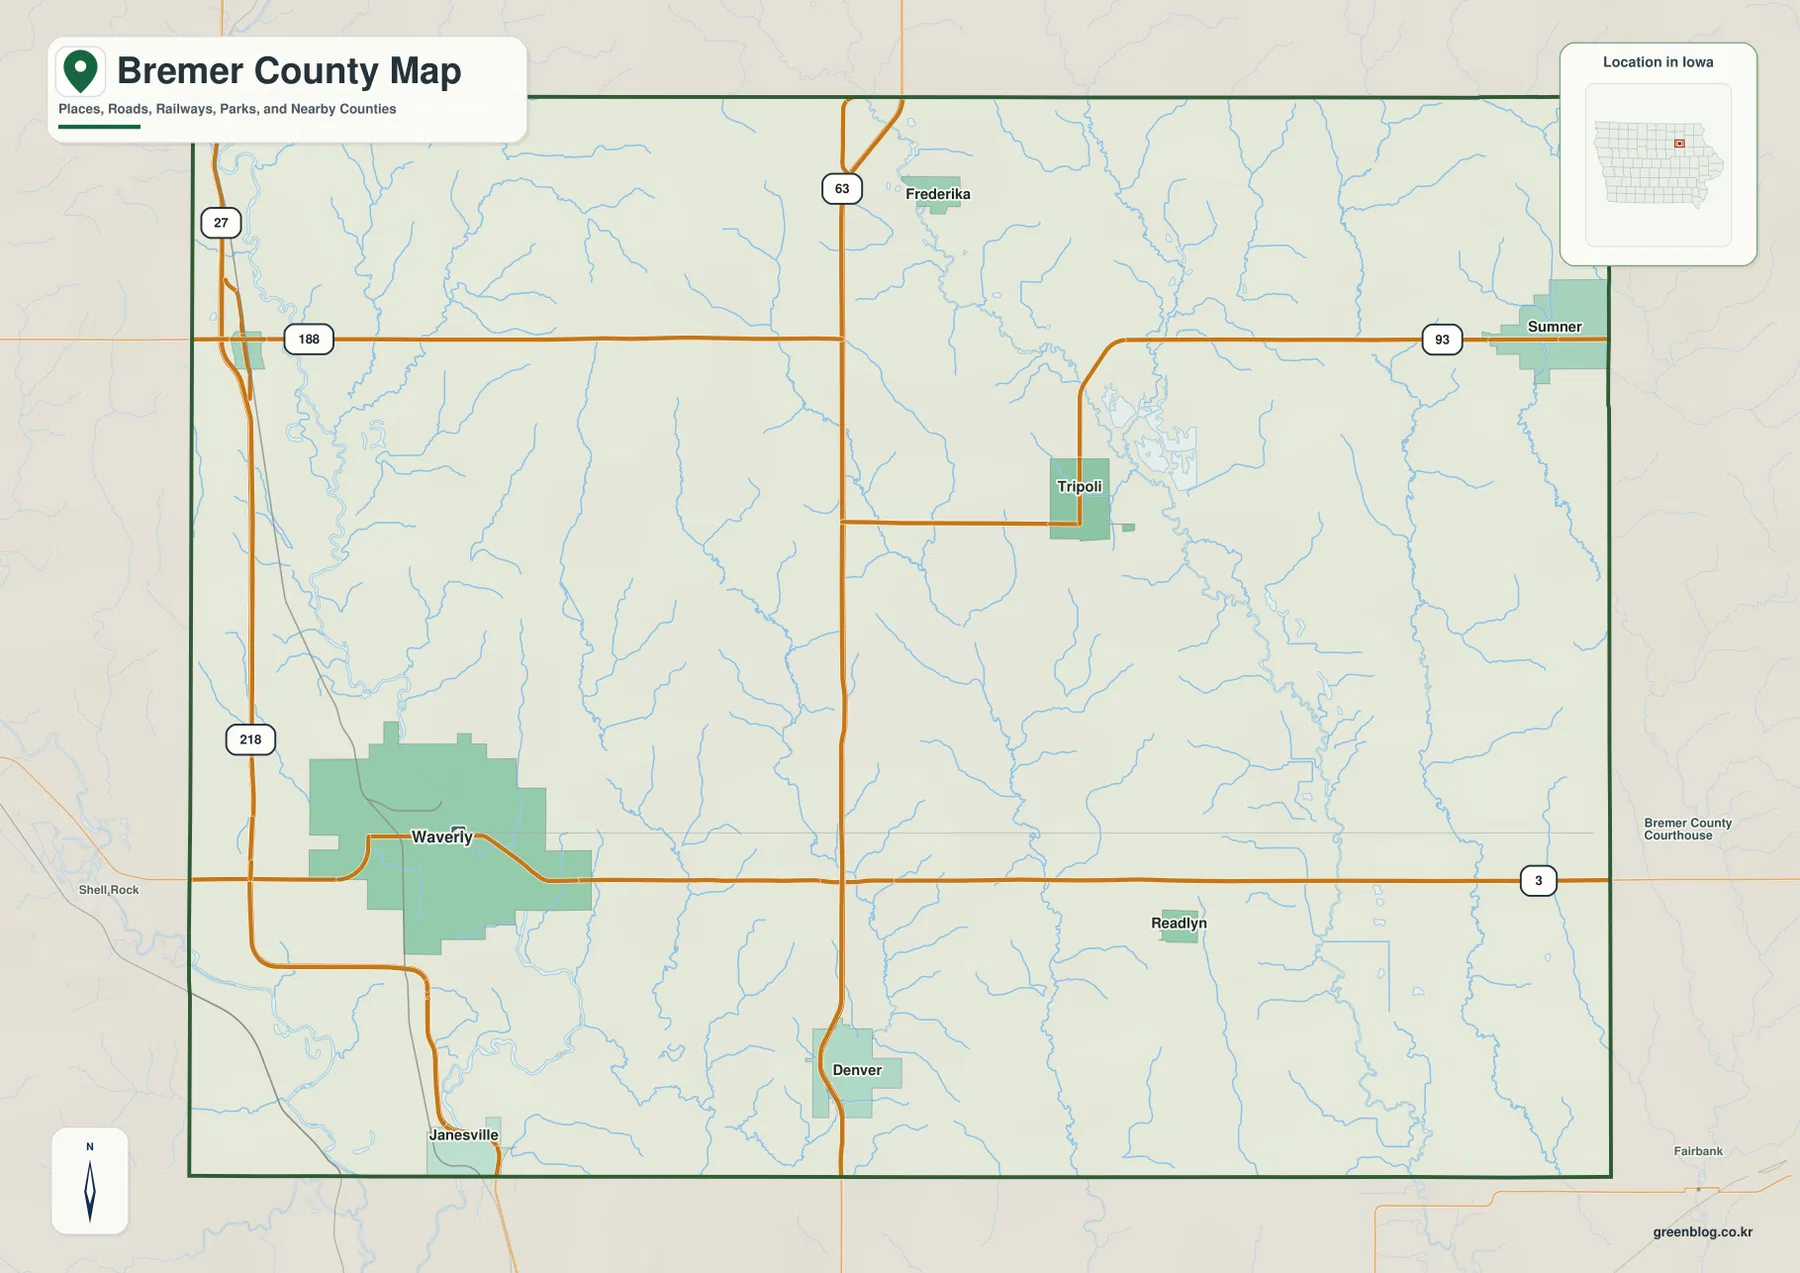
Bremer County sits in northeast Iowa, with Waverly serving as the clearest starting point for understanding its roads, towns, rivers, and changing terrain. The county map places Waverly on the western side of the county, while Denver lies to the south, Tripoli is farther north and east, and Sumner reaches the northeastern edge. The accompanying water and elevation maps add another layer: the Cedar River system influences the west, the Wapsipinicon River system crosses the eastern half, and the ground rises and falls more noticeably than a simple road map suggests. High-resolution JPG versions of all the supplied maps are also available in the download box below.
Bremer County is easy to describe as an agricultural county crossed by a few highways, but the maps show a more varied picture. U.S. 218 runs north–south near the western side, U.S. 63 forms another north–south reference through the middle, Iowa 3 crosses the southern half, and Iowa 93 reaches Sumner in the northeast. Between those roads, rivers and smaller creeks cut long valleys through otherwise rolling ground. The county’s own comprehensive plan identifies Waverly as the county seat and describes the Cedar and Wapsipinicon rivers as major waterways in the western and eastern parts of the county, matching the broad pattern visible in the supplied maps.
Table of Contents
Start with Waverly to make sense of the county road pattern
Waverly is the largest built-up area shown on the county map and provides a practical reference for locating the rest of Bremer County. Iowa 3 runs east–west through this part of the county, while U.S. 218 follows a north–south course near the western side. Farther east, U.S. 63 cuts through the middle and continues south toward Denver. Iowa 93 crosses the northeastern section near Sumner. These routes do not form a single urban corridor; instead, they connect towns that are spread across several parts of the county.
The county edges also help with orientation. Black Hawk County and Butler County appear to the west, Chickasaw County lies to the north, and Fayette and Buchanan counties are on the eastern side. Janesville sits close to the southern boundary in the west, Denver is near the south-central edge, and Readlyn occupies the southeastern portion. Tripoli is north of the county’s midpoint, while Sumner lies close to the northeastern boundary. Seeing those places together makes it easier to understand why different highways matter in different parts of the county.
This map is best used for county-scale orientation rather than street-level navigation. It shows the main communities, county boundary, major roads, rail and park context, and a large network of streams, but it does not attempt to include every local road or property line. If you are trying to find a town for the first time, locate Waverly and Iowa 3 first, then use U.S. 218, U.S. 63, or Iowa 93 to move toward the part of the county you need.
Six mapped communities show how strongly Waverly anchors the western side
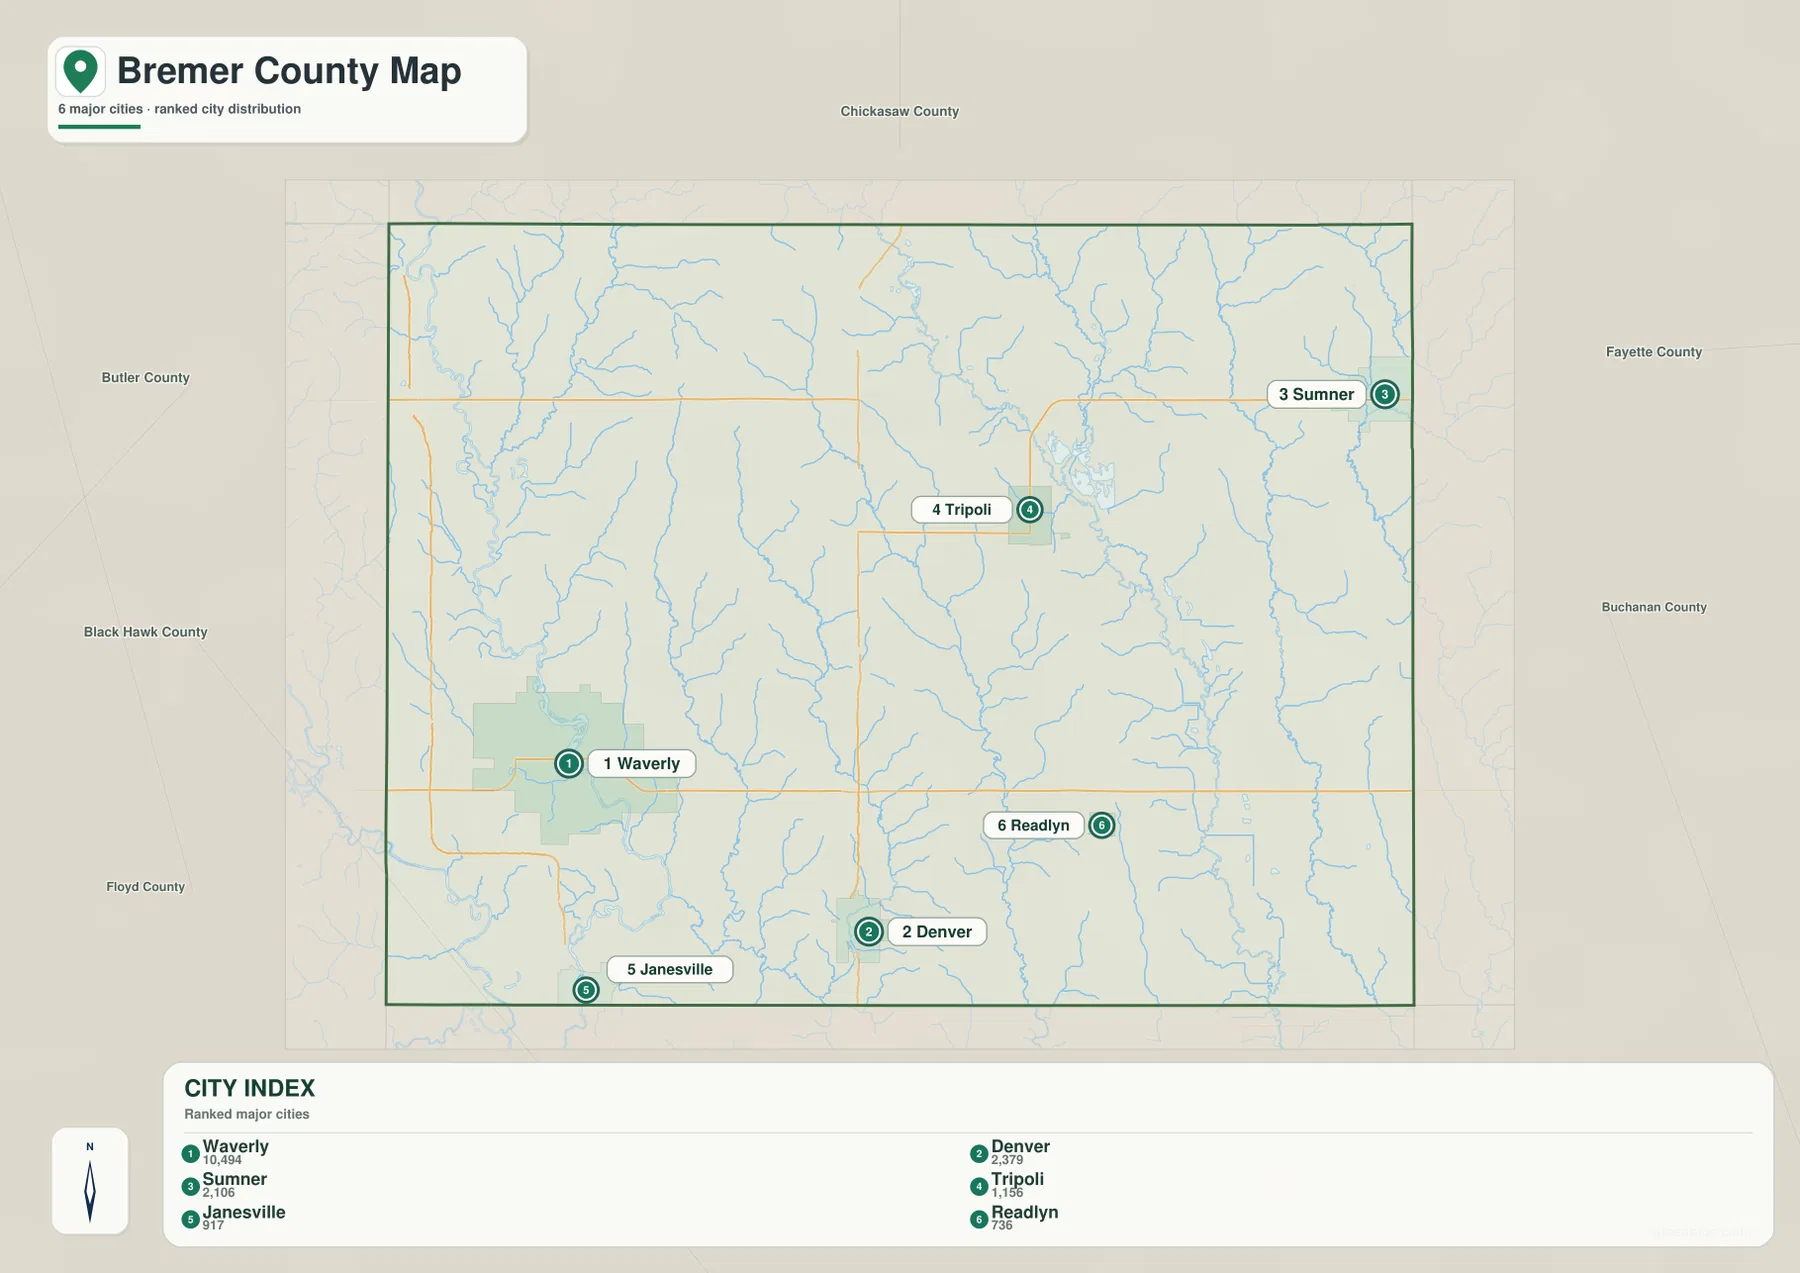
The city map ranks six communities: Waverly, Denver, Sumner, Tripoli, Janesville, and Readlyn. The index printed on the map lists Waverly at 10,494, followed by Denver at 2,379 and Sumner at 2,106. Tripoli is shown at 1,156, Janesville at 917, and Readlyn at 736. These are the values provided in the map graphic for relative comparison; readers who need the newest official population estimate should check a current statistical source rather than treating the map index as a live population counter.
The distribution is just as informative as the ranking. Waverly occupies the west, and the other communities form a loose spread toward the south, center, and east instead of merging into one continuous built-up zone. Denver and Janesville are near the southern edge, Tripoli is north of center, Sumner reaches the northeast, and Readlyn is isolated farther southeast. Large stretches between those towns are occupied by rural land and stream valleys, which is why the city map feels open even though it contains several named communities.
For practical map reading, the city ranking works best when paired with the road map. Waverly is easy to connect with Iowa 3 and U.S. 218, Denver with U.S. 63, Sumner with Iowa 93, and Readlyn with the eastern part of Iowa 3. This makes the city map useful for presentations, school projects, and general county orientation, but it should not be interpreted as a complete list of every settlement or as a map of municipal legal boundaries.
Two major river systems frame a dense network of smaller creeks
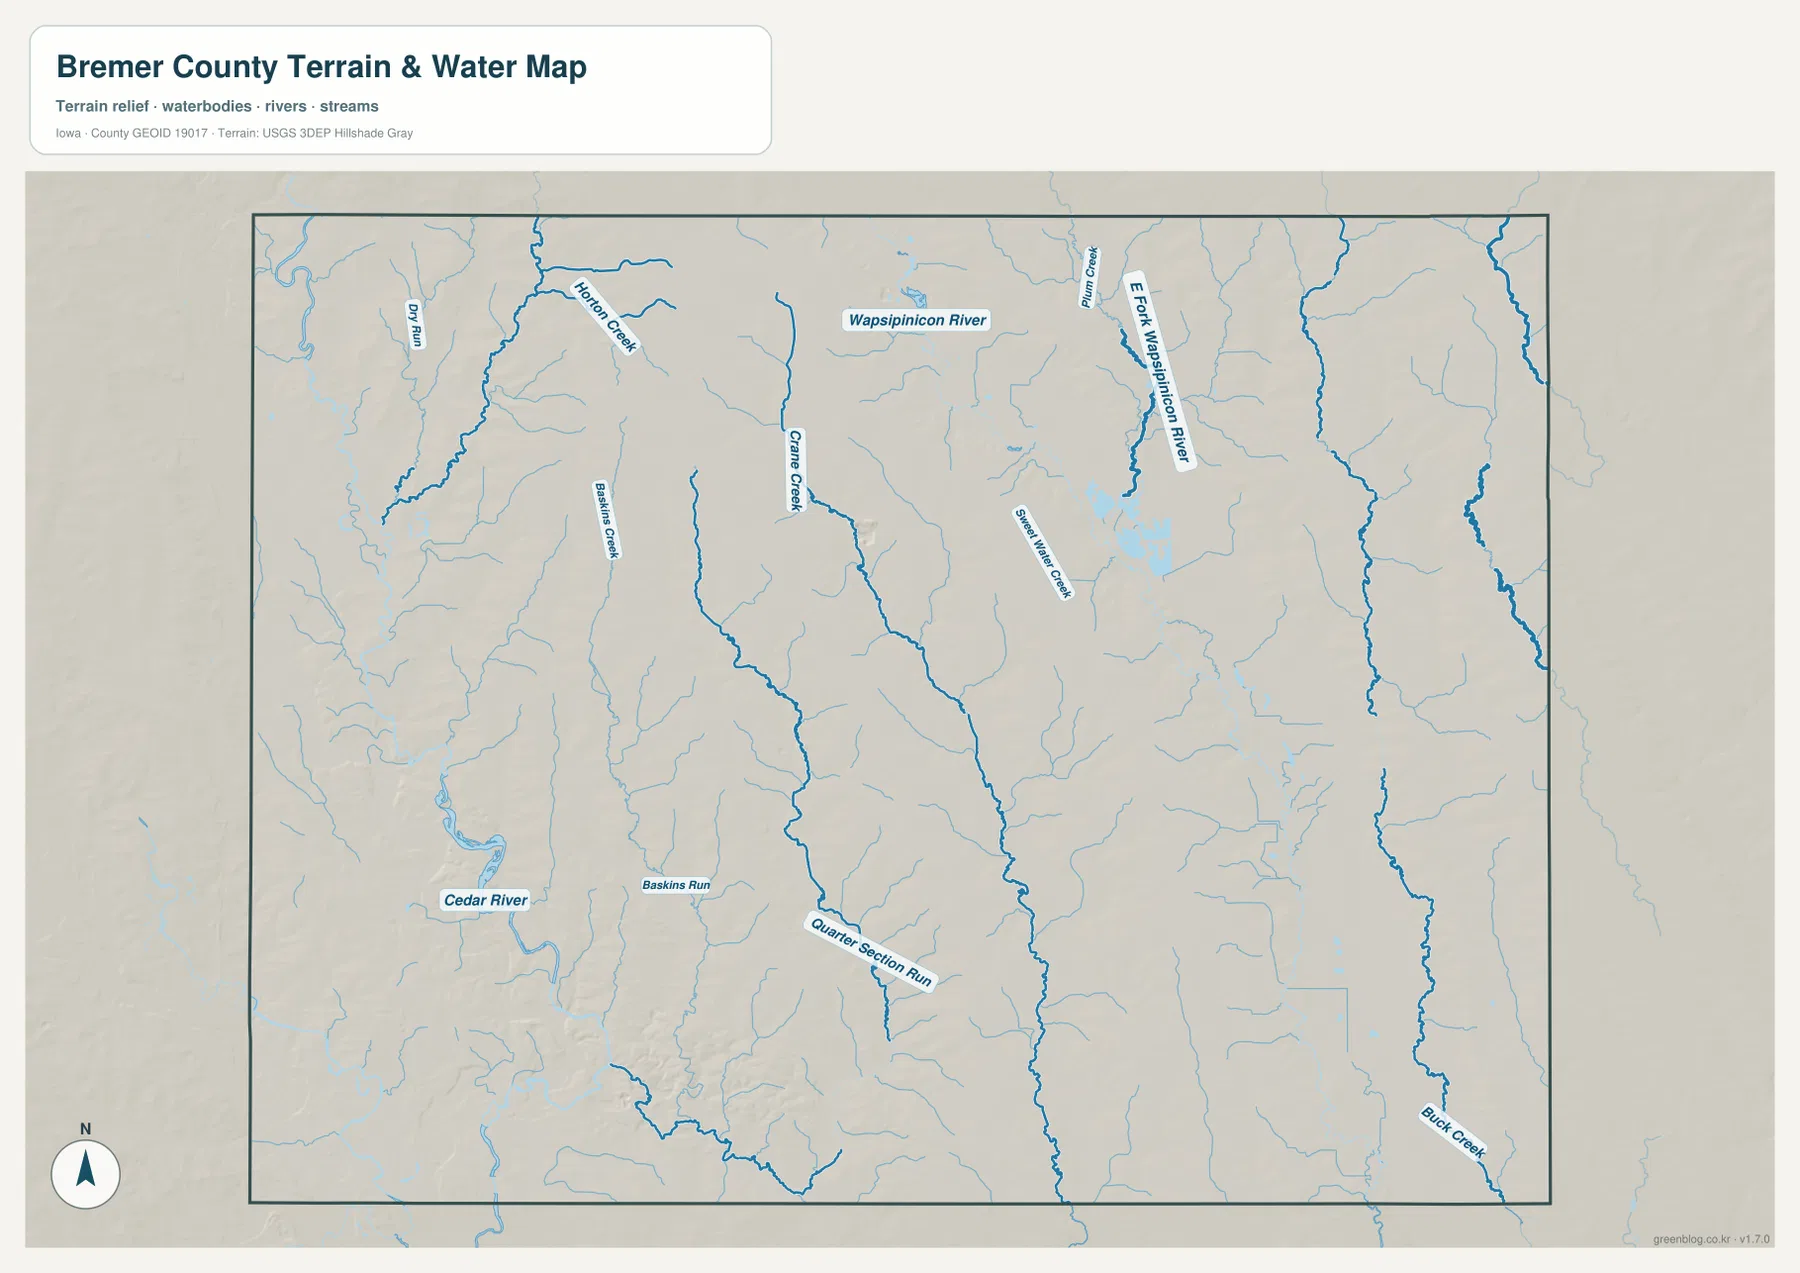
The terrain and water map gives Bremer County a very different appearance from the road map. The Cedar River is labeled in the southwest, while the Wapsipinicon River crosses the northern and eastern portions of the county. The East Fork Wapsipinicon River is also prominent in the northeast. Between them are Horton Creek, Crane Creek, Quarter Section Run, Baskins Creek, Smart Water Creek, Blust Creek, and other smaller waterways. The result is not a county divided cleanly by one river, but a landscape cut by many drainage valleys of different sizes.
The Wapsipinicon system is especially easy to follow because a broad river course and several connected tributaries appear across the northeast. The Cedar River is more visually concentrated in the southwest portion of this preview, where its bends contrast with the straighter county boundary. In the center, Crane Creek and Quarter Section Run extend southward and help explain why the middle of the county contains repeated shallow valleys instead of one uninterrupted flat surface.
This map is a reference for river locations and terrain relationships. It is not a flood-hazard map, a navigation chart, or a parcel boundary product. A stream drawn on the page does not by itself indicate public access, boating conditions, bridge clearance, or flood risk. Those questions require current information from the appropriate public agency. For county-scale reading, however, the water map is useful because it shows how river valleys divide the land between Waverly, Tripoli, Sumner, Denver, and the rural areas around them.
Lower western ground gives way to higher and more dissected terrain in the east
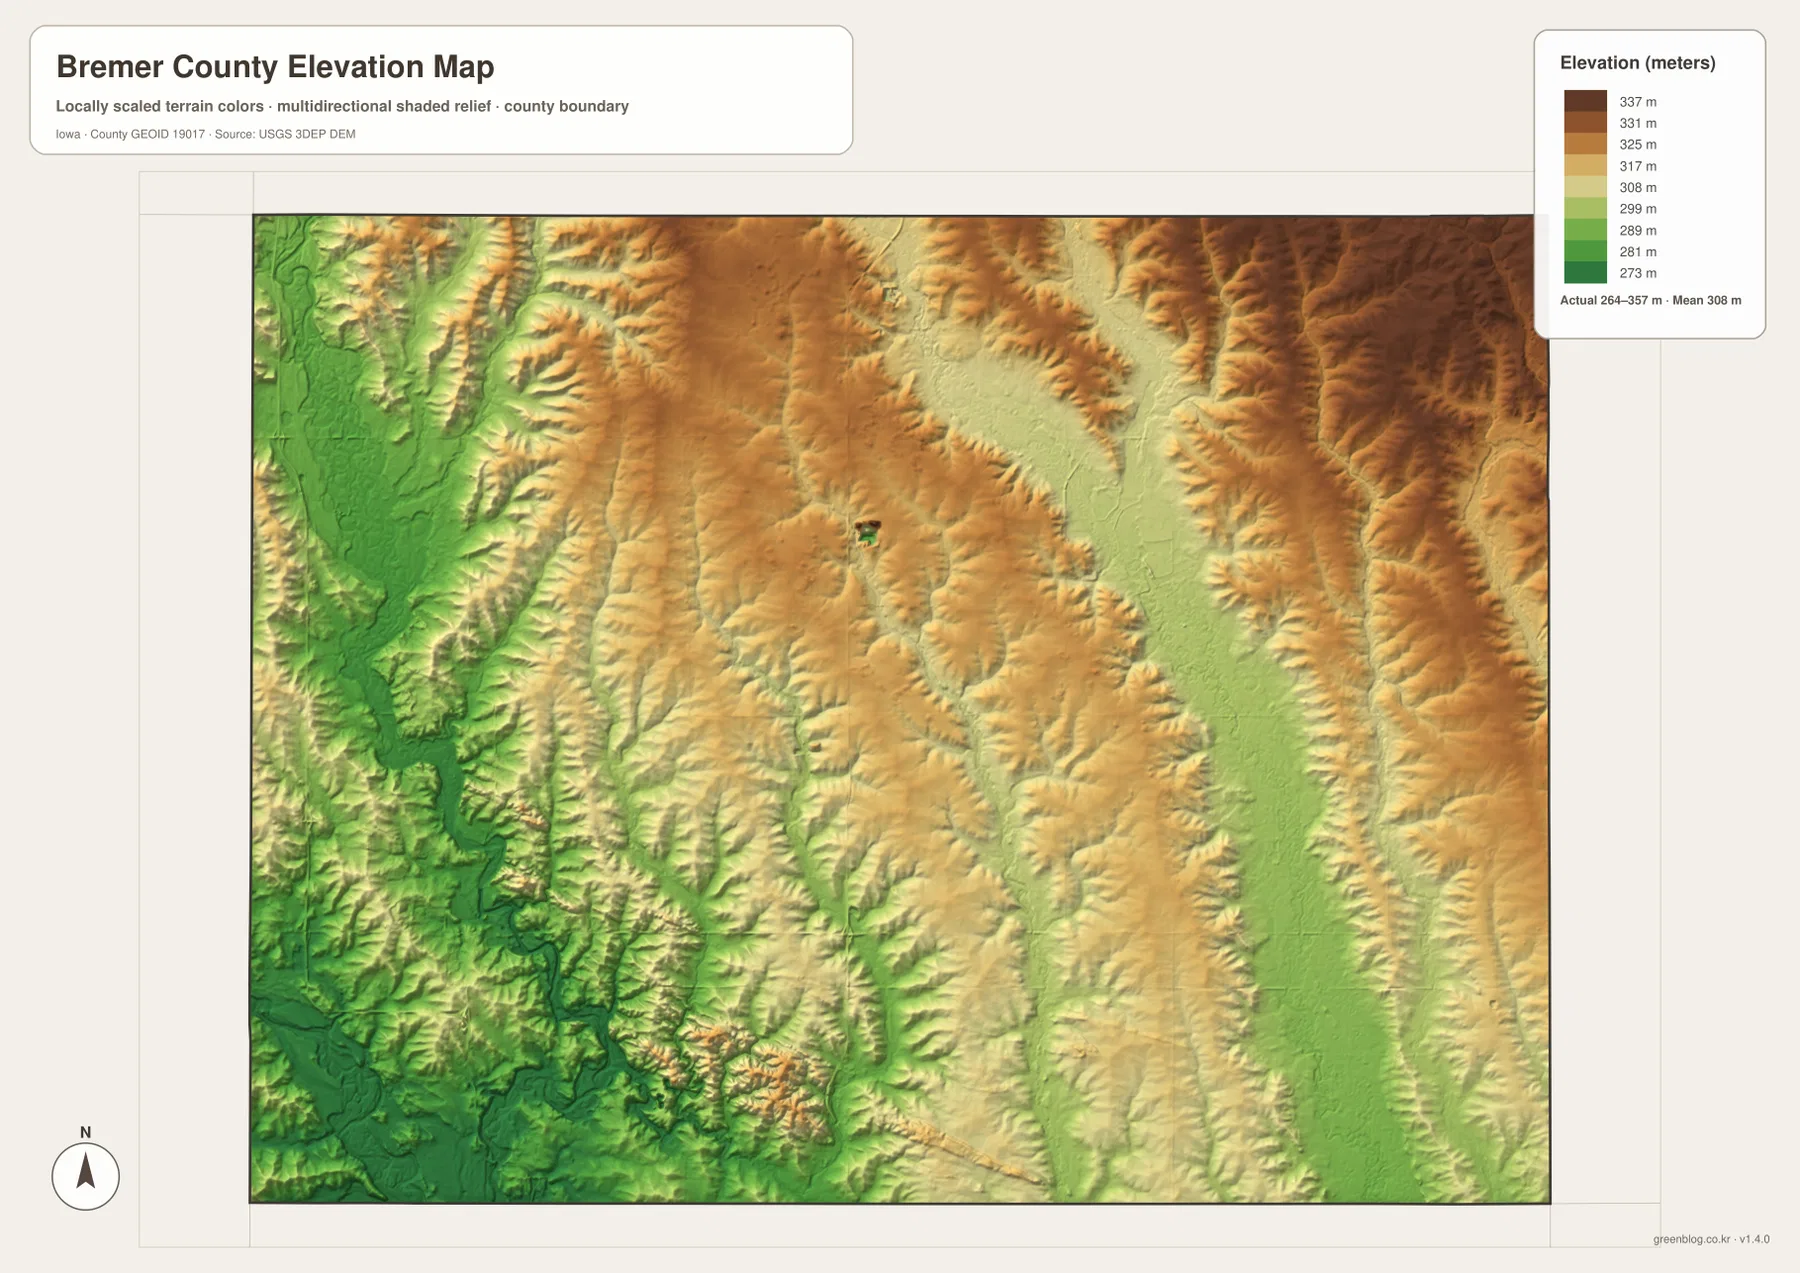
The elevation map shows a locally scaled range of roughly 264 to 357 meters, with a mean of about 308 meters. Broad green areas dominate much of the west, indicating lower ground relative to the rest of the county. The center shifts into yellow and tan colors, while the east and northeast contain more orange and brown ridges. Long green valleys cut through those higher areas, creating a strong contrast between valley floors and nearby uplands.
That pattern becomes clearer when the elevation image is compared with the water map. Several low corridors follow river and creek valleys, particularly in the eastern half where tributaries of the Wapsipinicon system pass between higher ridges. The western side is lower over a broader area, so its relief looks more open and less sharply divided. The map therefore helps explain why two places at similar latitude can sit in noticeably different local terrain depending on which river system and valley network is nearby.
The colors should be read as a county-scale comparison, not as an engineering survey. Brown does not mean mountainous terrain, and green does not automatically mean wetland or floodplain. The map generalizes elevation so that relative highs and lows are easy to see across the full county. Construction, drainage design, precise grade calculations, or property-specific elevation work requires survey-grade data and more detailed sources.
The Waverly–Sumner contrast is clearer when roads and relief are read together
Waverly and Sumner provide a useful cross-county comparison because they sit toward opposite sides of Bremer County. Waverly is embedded in the western road network near Iowa 3 and U.S. 218, while Sumner lies near the northeastern edge along Iowa 93. A road map alone makes that separation easy to see, but the water and elevation maps explain why the land between them is not uniform. Several stream valleys interrupt the central and eastern uplands, and the eastern terrain is more strongly divided into ridges and low corridors.
Tripoli works as a useful intermediate reference point. It lies north of the county center and west of Sumner, not far from the Wapsipinicon drainage shown on the water map. Denver and Readlyn tell a different story in the south: Denver is associated with the U.S. 63 corridor, while Readlyn lies farther east near Iowa 3. Switching between the road and terrain maps makes these place relationships easier to understand than trying to interpret every feature from one crowded image.
Central creeks matter when the big rivers are too far away to be useful landmarks
The Cedar and Wapsipinicon rivers are the most recognizable water features, but much of central Bremer County sits between them. In those areas, smaller named streams such as Crane Creek, Quarter Section Run, Baskins Creek, and Horton Creek become useful geographic references. They also correspond with smaller valleys in the relief image, showing that the county’s interior is broken into many local drainage areas rather than one smooth plateau.
These minor waterways are especially helpful in rural areas where town names and major highways are farther apart. A creek name can help explain why a road bends, why a low corridor appears on the elevation map, or why the land looks more dissected in one part of the county. At the same time, the county-wide map necessarily omits many small ditches and local features. Property access, exact stream widths, culverts, farm lanes, and parcel limits should be checked on more detailed official mapping.
Choose the map by the question rather than trying to use every layer at once
For a first look at Bremer County, begin with the overview map. Find Waverly, Iowa 3, and U.S. 218, then trace U.S. 63 north–south and Iowa 93 toward Sumner. That gives you the county’s road framework. The city map is the next useful step when the goal is to compare the relative size and spacing of Waverly, Denver, Sumner, Tripoli, Janesville, and Readlyn.
If the question is about rivers or terrain, reverse that order. Locate the Cedar and Wapsipinicon systems on the water map first, then open the elevation map to see which valleys are lower and which ridges rise around them. Returning to the road map afterward lets you connect those physical features with towns and highways. Separating the information across several maps keeps labels readable and avoids turning one page into an overloaded all-purpose map.
The downloadable JPG files are better suited to printing and close inspection than the WebP images embedded in the article. Each original JPG is 3638 × 2572 pixels. Because the county overview, city distribution, terrain and water, and elevation views are separate files, you can use only the map that fits a lesson, presentation, handout, or regional reference without carrying unnecessary details from the other layers.
What these maps can show clearly—and what needs a more detailed source
These maps are designed for county-wide geographic reference. They clearly show major towns, principal roads, large rivers and selected tributaries, and broad elevation differences. They do not show every building, local road, parcel, drainage structure, contour line, or legal boundary detail. The terrain and water map should not be substituted for a flood map, and the elevation image should not be treated as survey-grade measurement.
For general orientation, that simplification is useful. Start with Waverly and the major highways, add the two river systems, and then compare the green lowlands with the tan and brown higher ground. In a few steps, the county changes from a list of town names into a recognizable landscape with a western center, dispersed eastern communities, two important river systems, and a clear west-to-east change in relief.
Frequently Asked Questions
Which map is best for comparing Waverly and Sumner?
Use the county overview first. It places Waverly in the west near Iowa 3 and U.S. 218 and Sumner near the northeastern edge along Iowa 93. The city map is useful as a second view because it also shows how much larger Waverly is than the other ranked communities in the supplied graphic.
Where is the elevation contrast strongest on the Bremer County map?
The broadest low area appears in the west, while the central and eastern portions contain more tan, orange, and brown higher ground. In the east, long green valleys cut through those uplands and create a sharper local contrast. The legend shows an actual mapped range of about 264 to 357 meters, so the colors are best read as relative county-scale elevation rather than mountain-style relief.
What is included in the Bremer County map download?
The ZIP contains four high-resolution JPG files: the county overview map, city distribution map, terrain and water map, and elevation map. Each image is 3638 × 2572 pixels, making the files more suitable for printing and enlargement than the smaller WebP images used in the article.
Map File Information
The Bremer County overview, city distribution, terrain and water, and elevation maps are bundled as high-resolution JPG files. Download the ZIP when you need larger images for printing, presentations, or closer map reading.
- File Type: ZIP containing 4 JPG files
Related Maps
Sources and references
For more detailed county information and the official datasets behind common boundary, water, and elevation mapping, consult these sources.
- Bremer County Government – official county services and local information
- Bremer County Comprehensive Plan – county overview including Waverly, major highways, and the Cedar and Wapsipinicon rivers
- U.S. Census Bureau TIGER/Line Shapefiles – county boundaries, roads, and related geographic data
- USGS National Hydrography – rivers, streams, and surface-water data
- USGS 3D Elevation Program – elevation data
Green Map creates custom-edited map images using open geographic data sources such as geoBoundaries, Natural Earth, OpenStreetMap, and government open data.
These maps are edited visual materials, not raw data files, and are provided for education, documents, presentations, and graphic reference.