Putnam County is a compact Illinois county with two landscapes that look very different on a map: the broad Illinois River lowland around Hennepin and the higher, creek-cut uplands around Granville, McNabb, and Magnolia. This page combines road and boundary information, the six ranked communities, named waterways, and elevation so you can move from a place name to the surrounding terrain without guessing. You can also download the matching A3 high-resolution JPG maps in the ZIP below for printing, classroom use, or closer inspection of small labels.
A simple way to orient yourself is to find Hennepin first. It sits near the Illinois River on the western side of the main county body, while Route 71 runs east toward Mark, Granville, and Standard. Route 89 provides a second reference line along the eastern side, passing near Granville before continuing south toward McNabb and Magnolia. The terrain changes just as clearly as the roads do: the supplied elevation layer shows an actual range of about 134 to 245 meters and a mean near 184 meters, with low green river ground on the west and much higher tan and brown country across the east.
Table of Contents
Start at Hennepin: Route 71 links the river edge to the northern communities
Hennepin works well as the first reference point on the road-and-boundary map because its position is tied to both the county outline and the Illinois River. It sits near the river on the west side, and Route 71 leaves the Hennepin area and heads east across the northern part of Putnam County. Following that road brings Mark into view, then the Granville area, with Standard farther east near the county edge. The sequence gives the northern communities a clear relationship even though they are not arranged in a perfectly straight line.
Granville is especially useful as a second anchor because Route 89 runs north–south nearby. That road connects the northern cluster with McNabb in the middle-east and Magnolia near the southeast. Once Route 71 and Route 89 are identified, the smaller roads become easier to place because the two main directions form a practical frame for the eastern half of the county. The general map also shows local service points around Hennepin and Granville, which helps the labeled communities stand out from the more lightly marked countryside.
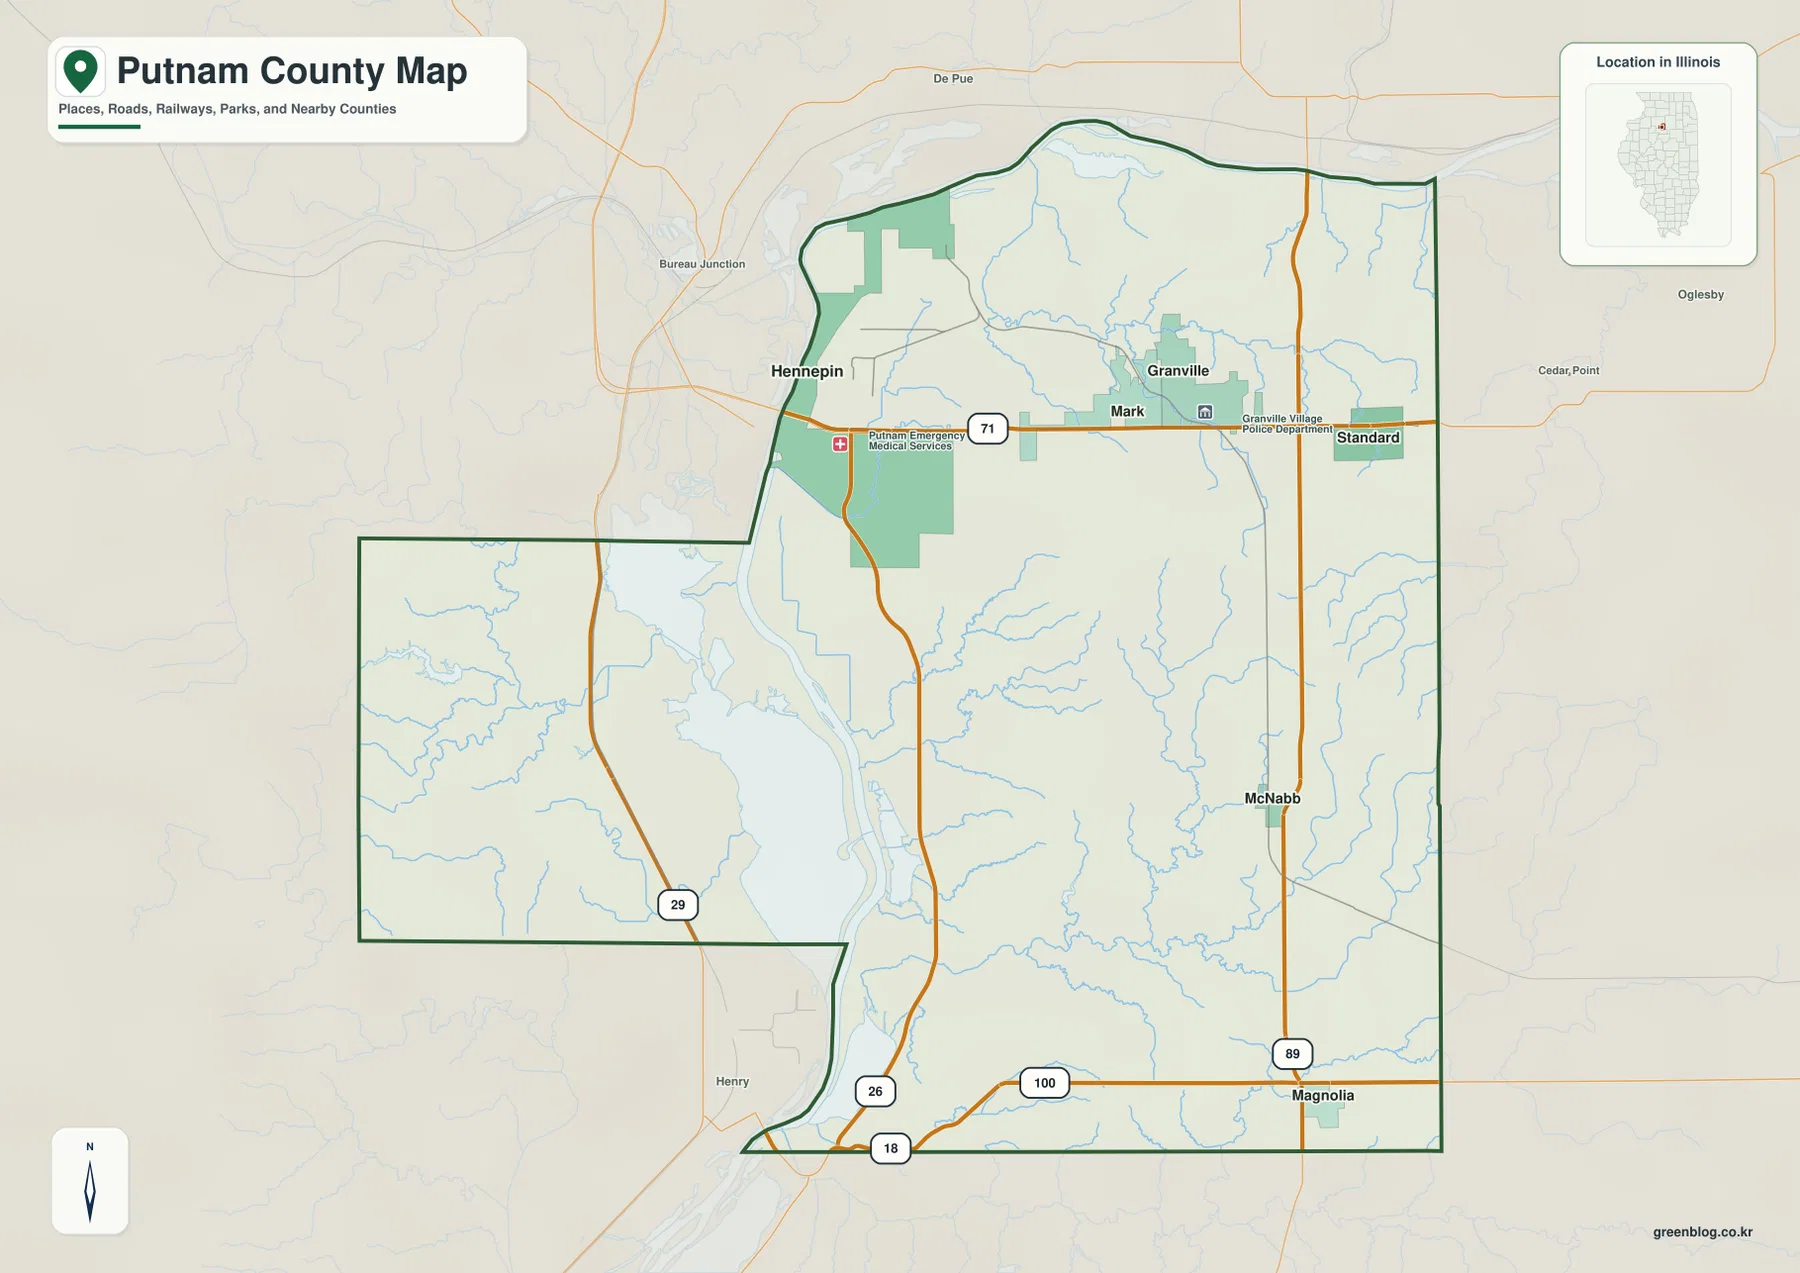
The southern road pattern is different from the north. Route 26 stays close to the Illinois River side, while Routes 18 and 100 establish east–west references near the bottom of the county. Magnolia lies close to the Route 89 and Route 100 junction, making it one of the easiest places to identify in the southeast. The western projection is crossed by Route 29, but that part of the county has fewer prominent settlement labels and much more visible relief and drainage, so the water and elevation maps become more informative there than the road map alone.
Granville to Magnolia: six communities spread along the east
The ranked community map strips away much of the road detail and concentrates on six labeled places. Granville is ranked first, Hennepin second, Mark third, Standard fourth, McNabb fifth, and Magnolia sixth. The map also prints values of 1,472 for Granville, 929 for Hennepin, 574 for Mark, 250 for Standard, 233 for McNabb, and 232 for Magnolia. These figures are best treated here as the values presented in the supplied index rather than as a claim about the latest population estimate.
Their arrangement is more important than the ranking by itself. Granville, Hennepin, Mark, and Standard occupy the northern part of the county, but Hennepin is separated from the others by its position beside the river. McNabb and Magnolia are much farther south along the eastern side. That spacing is a useful reminder that Putnam County does not have one continuous urban corridor; it has a northern concentration of named places plus two more isolated communities to the south.
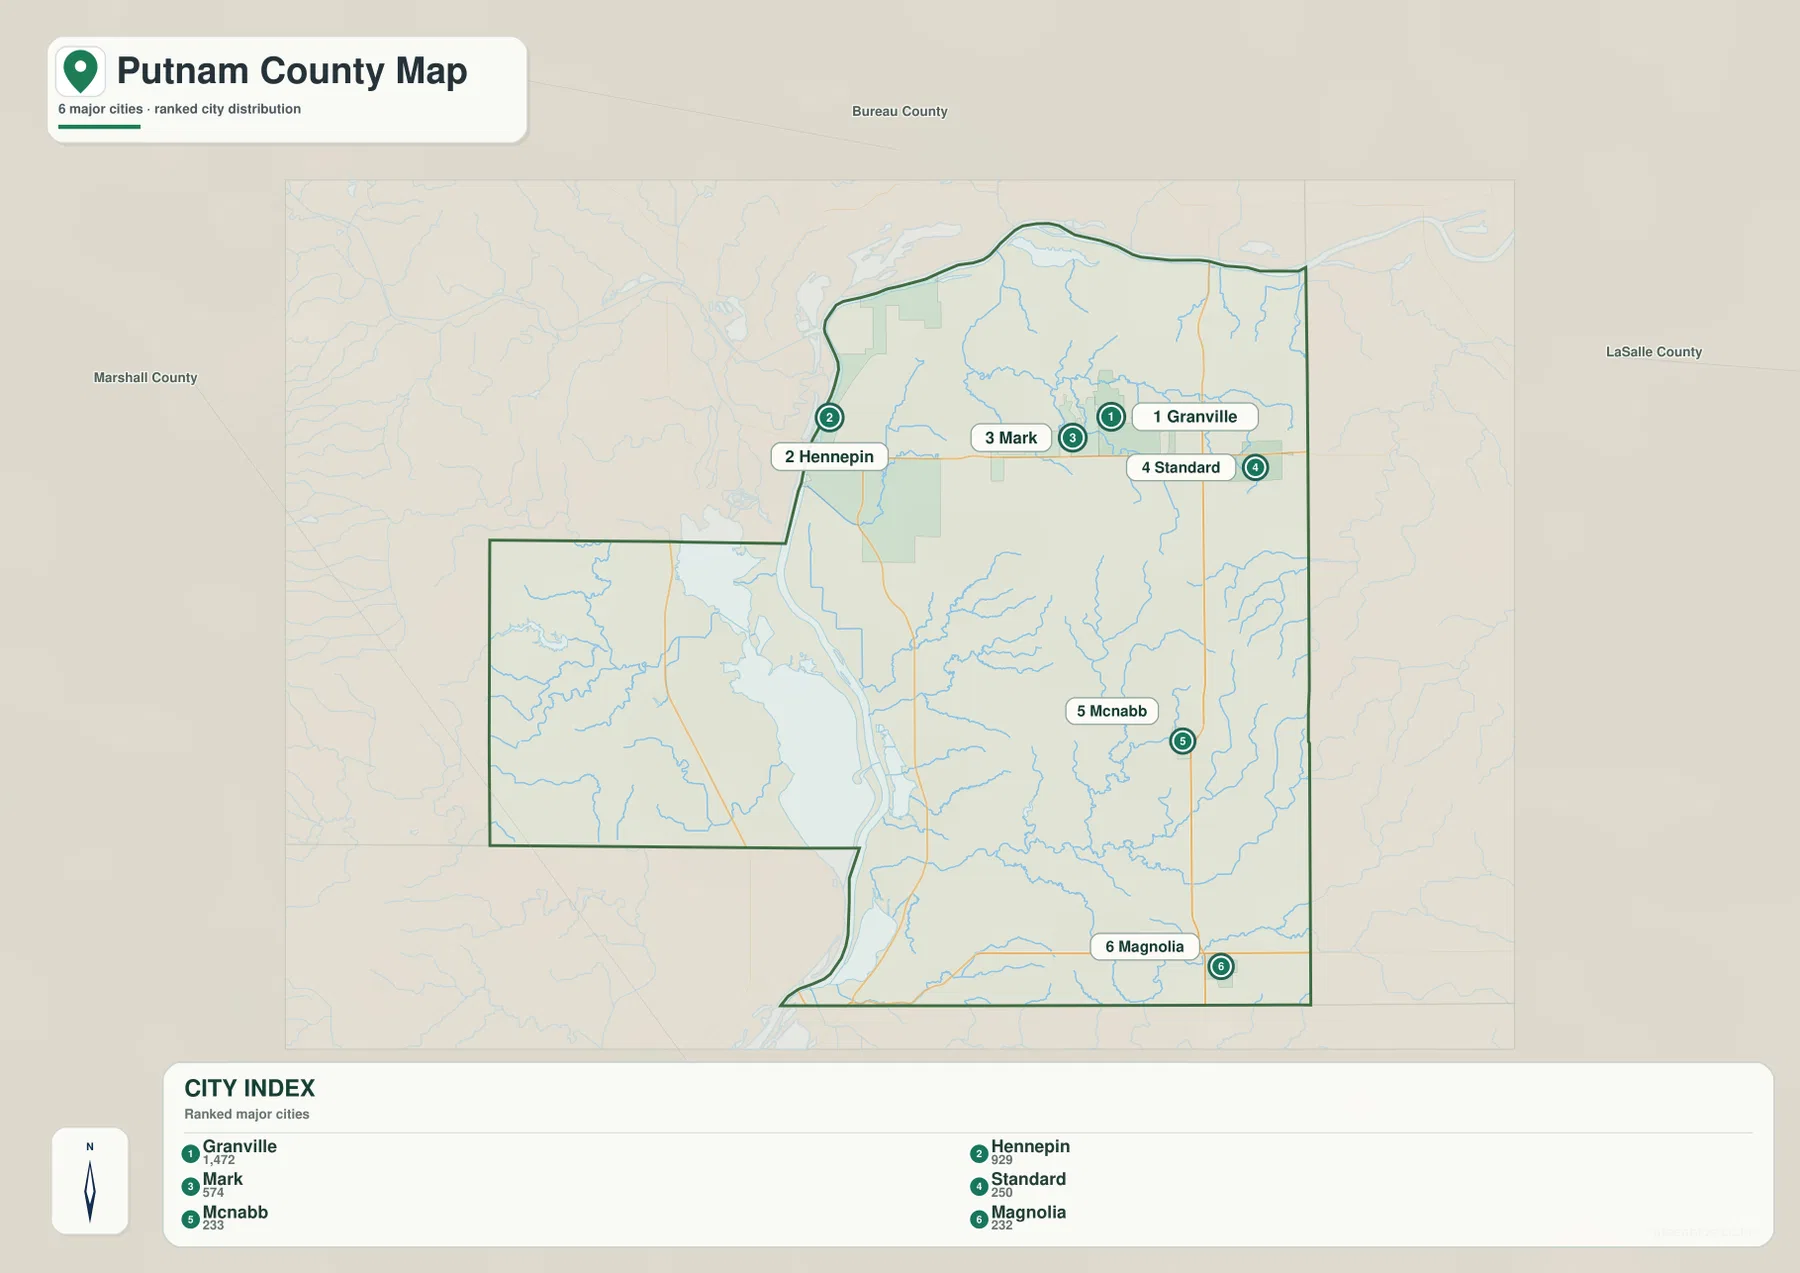
Combining the community map with the roads clarifies how those places relate to one another. Granville sits close to both the Route 71 corridor and Route 89, giving it a central position in the northeast. McNabb and Magnolia line up more naturally with Route 89, while Hennepin belongs to the river side of the county. This is why the same county can feel divided into a low western river setting and a more elevated eastern interior even before the elevation layer is opened.
Lakes and backwaters reshape the western half
The terrain-and-water map changes the visual emphasis from roads to the Illinois River system. The river occupies the major low corridor, and several named lakes or backwater areas sit beside it. Senachwine Lake is the largest and most prominent label in the central-western part of the map, with Goose Lake to the northwest, Swan Lake close to the river, and Sawmill Lake farther south. Turner Lake appears near the northern edge. Together, these features show that the western side is not simply one river channel bordered by dry land; it is a broader lowland of river bends, lakes, and connected wet areas.
The creek pattern changes as you move away from the river. Senachwine Creek crosses the western projection, while Coffee Creek and Allforks Creek appear farther north and east. Cedar Creek, Clear Creek, and Little Sandy Creek cut through the eastern interior. These streams are smaller than the Illinois River, but they matter because their valleys break up the higher terrain. The water layer therefore provides a direct explanation for many of the narrow low corridors that become visible on the elevation map.
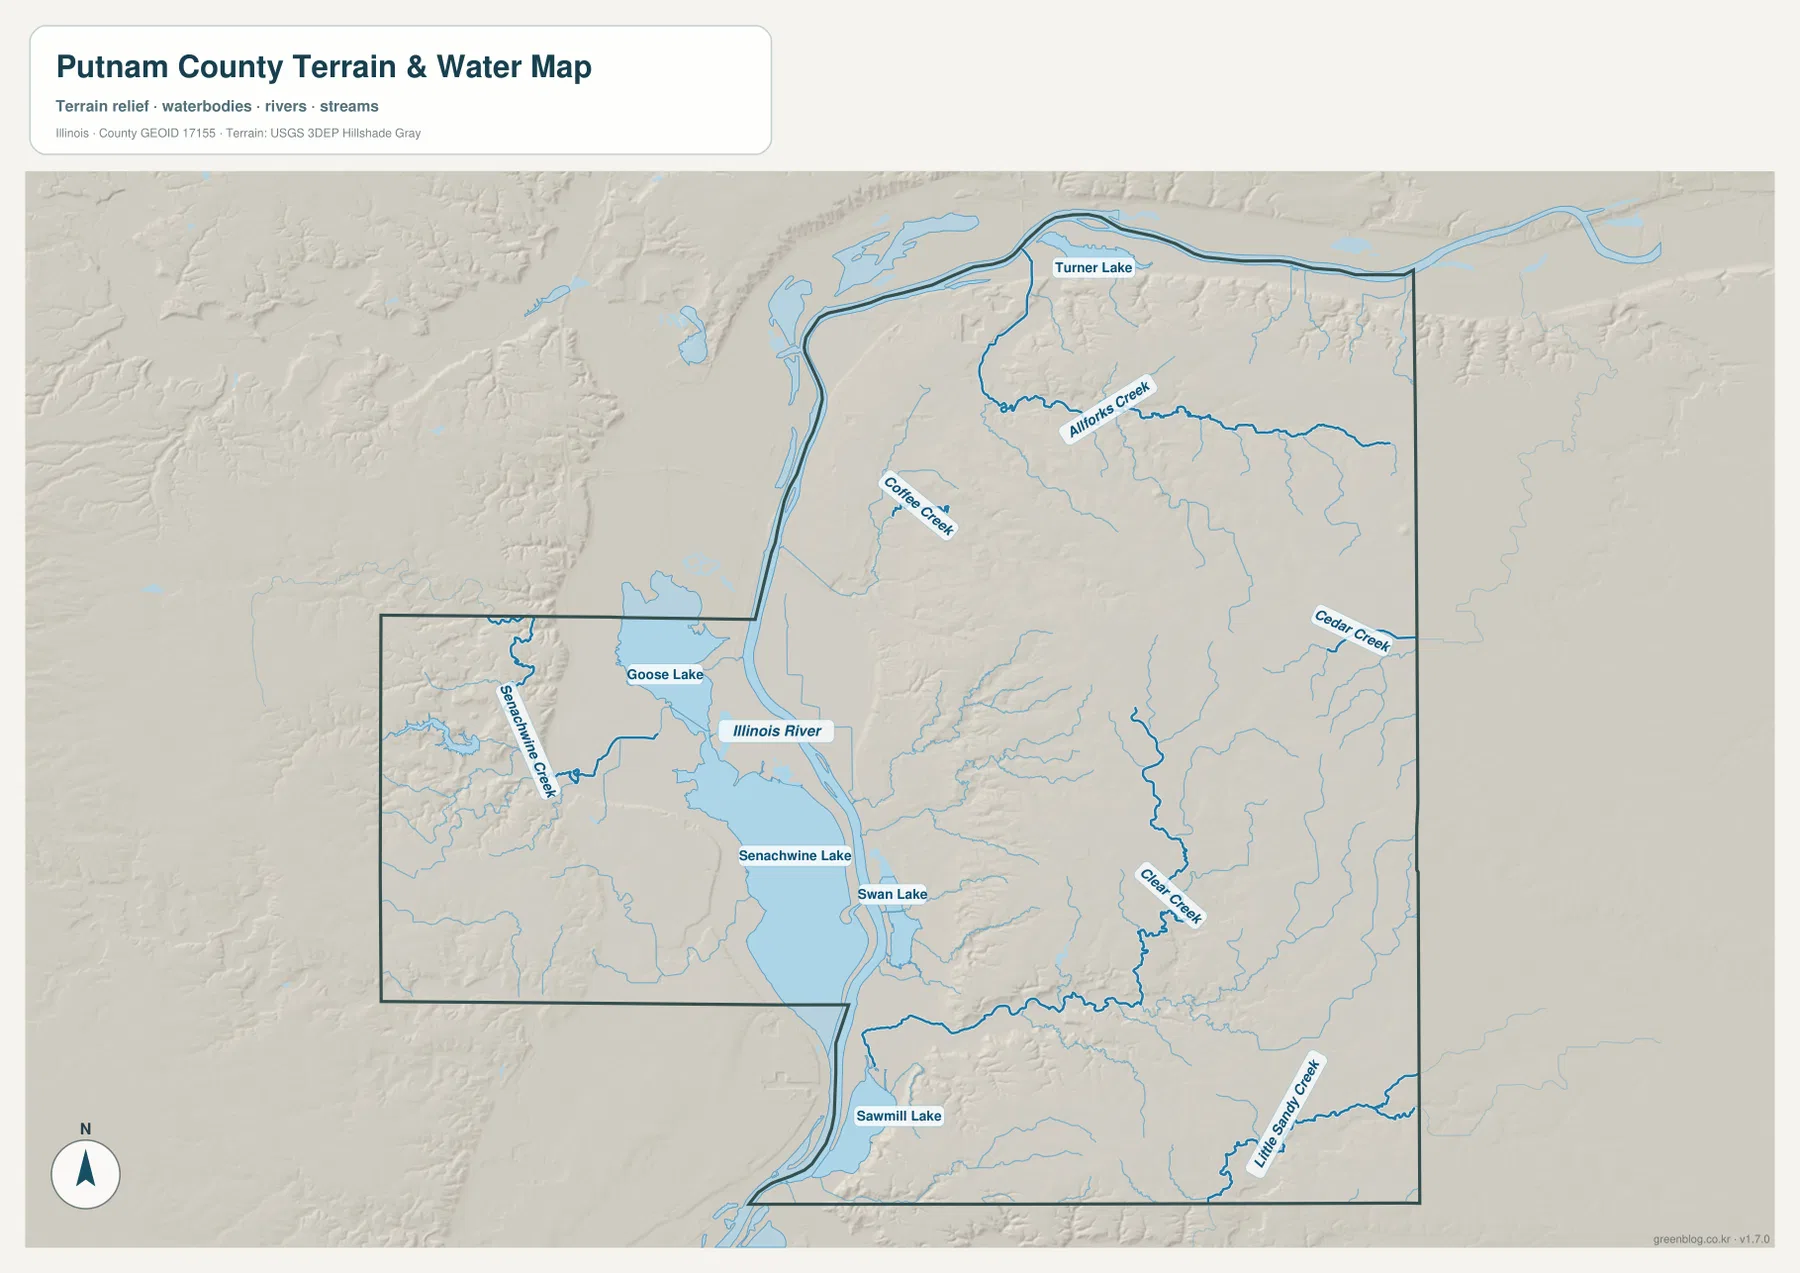
Hennepin is a good place to see how settlement and water geography overlap. It is close to the main river corridor, whereas Granville, McNabb, and Magnolia are farther east among smaller tributaries. This difference helps explain why driving directions alone do not tell the full story of the county. A short distance on the road map can cross from broad river flats into a much more dissected interior where small creeks and ridges repeat over short distances.
The terrain-and-water map is a general reference layer rather than a flood, navigation, wetland-regulation, or access map. A labeled lake does not establish public access, and a river or backwater shown on the map should not be used to determine flood risk or navigability. Its value is geographic: it makes the relationship among the Illinois River, named lakes, tributaries, and nearby terrain easy to see.
The 134–245 m elevation range explains the county’s two landscapes
The elevation map gives numerical scale to the contrast already suggested by the water map. Its legend reports an actual mapped range of about 134 to 245 meters, with a mean near 184 meters. The lowest greens form a broad corridor along the Illinois River and extend through much of the central-western lowland. East of that corridor, colors rise quickly through yellow and tan into brown, showing that a large part of the eastern county stands substantially higher than the river side.
The uplands are not smooth or uniform. Thin green fingers cut through the tan and brown areas where creek valleys descend through the higher ground. Clear Creek and Cedar Creek help explain some of these incisions, and the same pattern repeats across the northeast and central-east. Around Granville and McNabb, the terrain contains many short ridges and valleys rather than one flat plateau. Magnolia also sits in a generally higher setting than the Illinois River corridor even though local tributaries create narrow lower strips nearby.
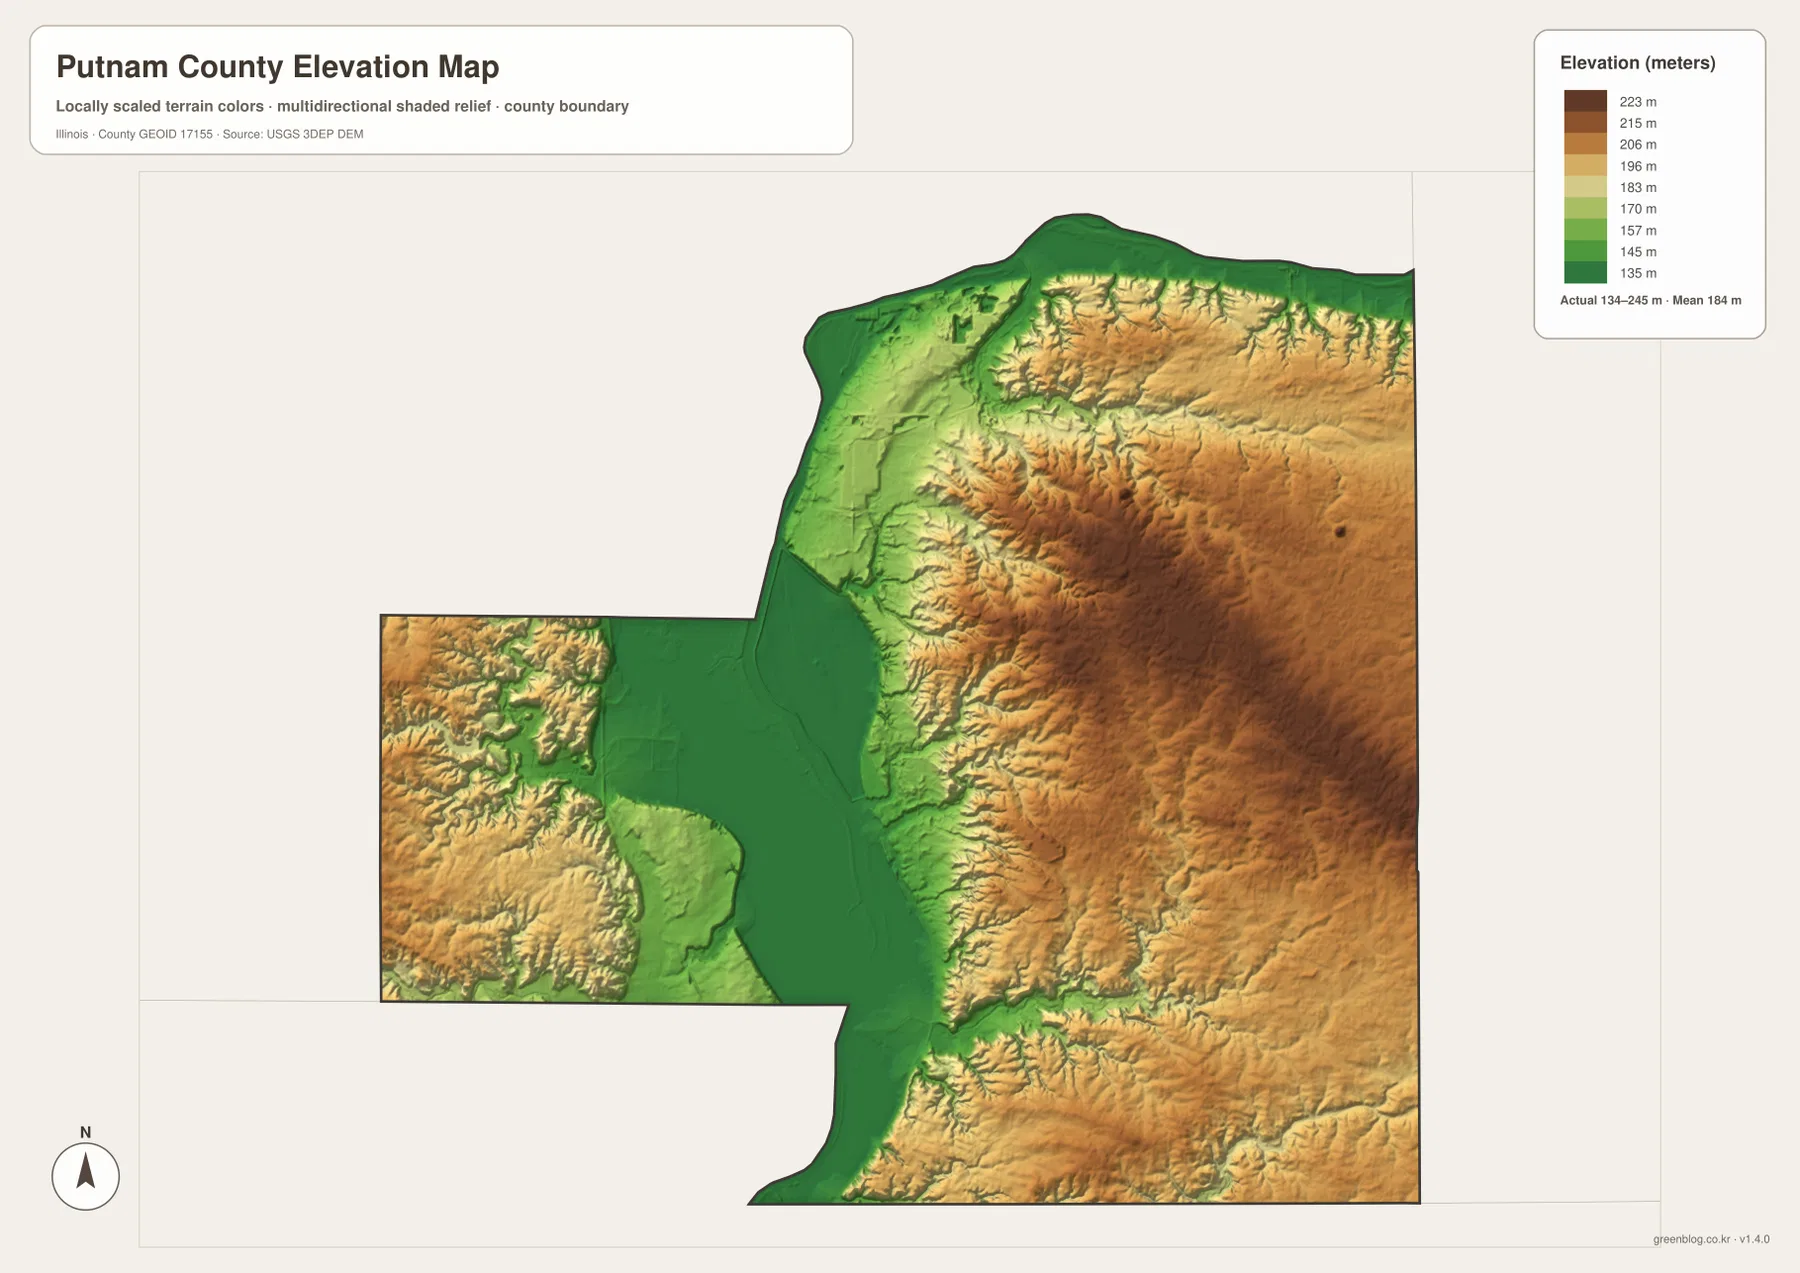
The western projection adds another wrinkle. Ground close to the river and lakes stays low, but the outer western side rises again into ridges separated by short valleys. That means the county cannot be reduced to a simple west-low, east-high formula in every location. The larger pattern is still strong, but local creek valleys and upland pockets create considerable variation. For general map reading, the elevation layer is excellent for comparing relative height; it is not a parcel survey and should not be used for construction grades or engineering elevations.
Which Putnam County map should you use first?
For general orientation, begin with the road-and-boundary map and locate Hennepin, Route 71, and Granville. That immediately separates the river side from the northern interior. If your question is about where the six named communities sit relative to one another, switch to the ranked community map, which removes much of the smaller road detail and makes the north-versus-south spacing easier to compare.
For natural features, the most useful sequence is water first and elevation second. Find Senachwine Lake, Swan Lake, or the Illinois River on the terrain-and-water layer, then look at the same area on the elevation map. The broad green lowland around the river becomes obvious. Repeat the comparison around Granville or McNabb and the pattern changes: smaller creeks occupy narrow valleys within higher tan and brown terrain. The two layers together explain why the county contains both broad low flats and closely spaced ridges.
The browser WebP images are designed for convenient on-page viewing. If you need to print the maps or zoom in on small road, creek, or community labels, use the high-resolution JPG files in the downloadable ZIP below. These are general reference maps, so current road conditions, legal parcel boundaries, flood determinations, navigation questions, and survey-grade elevation decisions should be checked with the appropriate current official sources.
Frequently Asked Questions
What is the quickest way to tell Hennepin and Granville apart on the maps?
Hennepin is the western reference beside the Illinois River, while Granville is farther east on higher interior ground. Route 71 gives you a convenient east–west connection between the two areas. The elevation layer makes the distinction even clearer because Hennepin is next to broad green lowland and Granville is surrounded by much more tan and brown upland terrain.
Which map should I use for Senachwine Lake and the Illinois River?
Start with the terrain-and-water map. It shows the Illinois River together with Senachwine Lake, Goose Lake, Swan Lake, Sawmill Lake, Turner Lake, and several named creeks. Then compare the same area with the elevation map to see how the broad river lowland differs from the narrow creek valleys farther east. The layer is for general geographic reference, not flood or navigation determinations.
What do the 134–245 m elevation values tell me?
They describe the actual mapped range shown on the supplied elevation layer, with a mean near 184 meters. The most important point is the strong contrast between the low Illinois River corridor and the higher eastern uplands. Numerous narrow valleys cut into those uplands, so the map helps explain the county’s relief at a broad scale but should not be treated as survey-grade elevation data for a specific property.
Map File Information
The ZIP contains the Putnam County road-and-boundary map, ranked community map, terrain-and-water map, and elevation map as A3 high-resolution JPG files.
- Printable Size: 3638 × 2572 pixels each
- File Type: ZIP containing 4 JPG files
Related Maps
Sources and references
- Putnam County, Illinois official website – county government and local information
- Putnam County Conservation District – local natural areas and Senachwine Lake context
- U.S. Census Bureau TIGER/Line Shapefiles – county boundaries, roads, and place reference
- USGS National Hydrography – rivers, streams, and water features
- USGS 3D Elevation Program – elevation and terrain reference
Green Map creates custom-edited map images using open geographic data sources such as geoBoundaries, Natural Earth, OpenStreetMap, and government open data.
These maps are edited visual materials, not raw data files, and are provided for education, documents, presentations, and graphic reference.