Birth registration is the official recording of a child’s birth by the state. World Bank series SP.REG.BRTH.Q3.ZS does not cover all children under five. It measures the percentage of registered births among children living in households in the middle wealth quintile, Q3. When households are divided into five relative wealth groups, Q3 is the central 20%, roughly the 40th to 60th percentile within each country.
The table contains 105 latest non-missing country and area observations dated from 2006 to 2021. Their median is 89.4% and the unweighted mean is 75.2%. The dates are not synchronized: 2014 accounts for 19 observations, while only three are from 2021. The map is therefore a latest-observation map, not a 2021 global ranking.
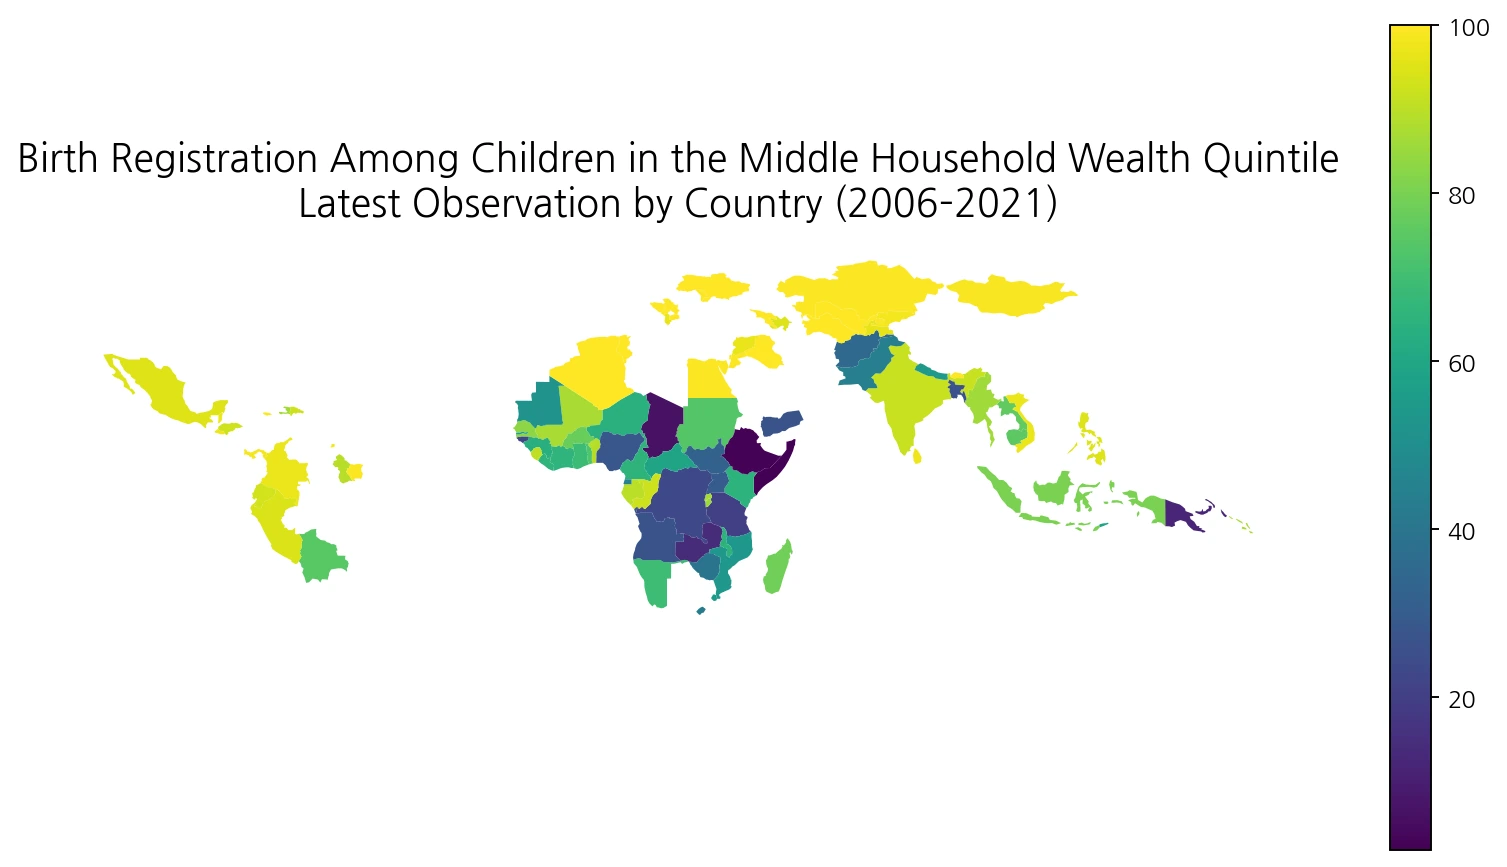
Table of Contents
Q3 is the middle 20% of households
Q3 is the third of five wealth quintiles, not a statistical quartile. Q1 is the lowest 20%, Q5 is the highest 20%, and Q3 is the group in the middle. In percentile terms it roughly represents households from the 40th to the 60th percentile of the national wealth distribution.
DHS- and MICS-style wealth quintiles are generally constructed from household assets and living conditions rather than a single monthly-income figure. The position is relative within each country. A Q3 household in one country does not necessarily have the same absolute income or asset level as a Q3 household in another country.
Registration includes caregiver reports, not only certificates seen
World Bank metadata defines completeness of birth registration as the percentage of children under age five whose births were registered at the time of the survey. The numerator includes children whose birth certificate was seen by an interviewer and children whose mother or caretaker reported that the birth had been registered. The indicator is therefore broader than certificate possession alone.
Birth registration can support legal identity and access to public administration, but the percentage does not by itself measure access to education, health care, or social protection. A low value also cannot be attributed to household wealth alone. Administrative distance, procedures, conflict, mobility, legal rules, awareness, and survey design can all matter.
The median latest observation is 89.4%
Across the 105 equally weighted country or area observations, the median is 89.4% and the mean is 75.2%. Fifty observations are at least 90%, and 40 are at least 95%. At the lower end, 40 observations are below 75% and 20 are below 50%. The distribution shows that registration in the middle household group varies sharply across countries.
| Birth-registration rate | Countries/areas | Share of 105 |
|---|---|---|
| Below 50% | 20 | 19.0% |
| 50% to <75% | 20 | 19.0% |
| 75% to <90% | 15 | 14.3% |
| 90% to <95% | 10 | 9.5% |
| 95% to <99% | 18 | 17.1% |
| 99% to <100% | 15 | 14.3% |
| 100% | 7 | 6.7% |
The 75.2% mean is not a population-weighted global registration rate for children in Q3 households. A small country and a very populous country each contribute one row to this simple average. A true global share would require country-specific numbers of children in the middle wealth quintile and the appropriate survey weights.
The lowest latest observations are Somalia, Ethiopia, and Chad
The lowest retained values are Somalia at 1.8% in 2006, Ethiopia at 2.4% in 2016, and Chad at 6.1% in 2015. Papua New Guinea is 12.1% in 2018, Zambia 13.7% in 2018, Tanzania 20.0% in 2016, Guinea-Bissau 21.9% in 2014, and the Democratic Republic of the Congo 23.5% in 2014. Bangladesh is 26.2% and Angola 26.9%.
| Country/area | Observation year | Q3 birth registration |
|---|---|---|
| Somalia, Fed. Rep. | 2006 | 1.8% |
| Ethiopia | 2016 | 2.4% |
| Chad | 2015 | 6.1% |
| Papua New Guinea | 2018 | 12.1% |
| Zambia | 2018 | 13.7% |
| Tanzania | 2016 | 20.0% |
| Guinea-Bissau | 2014 | 21.9% |
| Congo, Dem. Rep. | 2014 | 23.5% |
| Bangladesh | 2018 | 26.2% |
| Angola | 2016 | 26.9% |
| Yemen, Rep. | 2013 | 26.9% |
| Nigeria | 2013 | 28.2% |
| Uganda | 2016 | 30.1% |
| South Sudan | 2010 | 32.2% |
| Afghanistan | 2015 | 34.9% |
The observation year is essential to interpretation. Somalia’s value is from 2006, while Papua New Guinea and Zambia are from 2018. Treating observations more than a decade apart as a current league table would confuse time differences with country differences.
Among observations dated 2018–2021, Papua New Guinea, Zambia, and Bangladesh are lowest
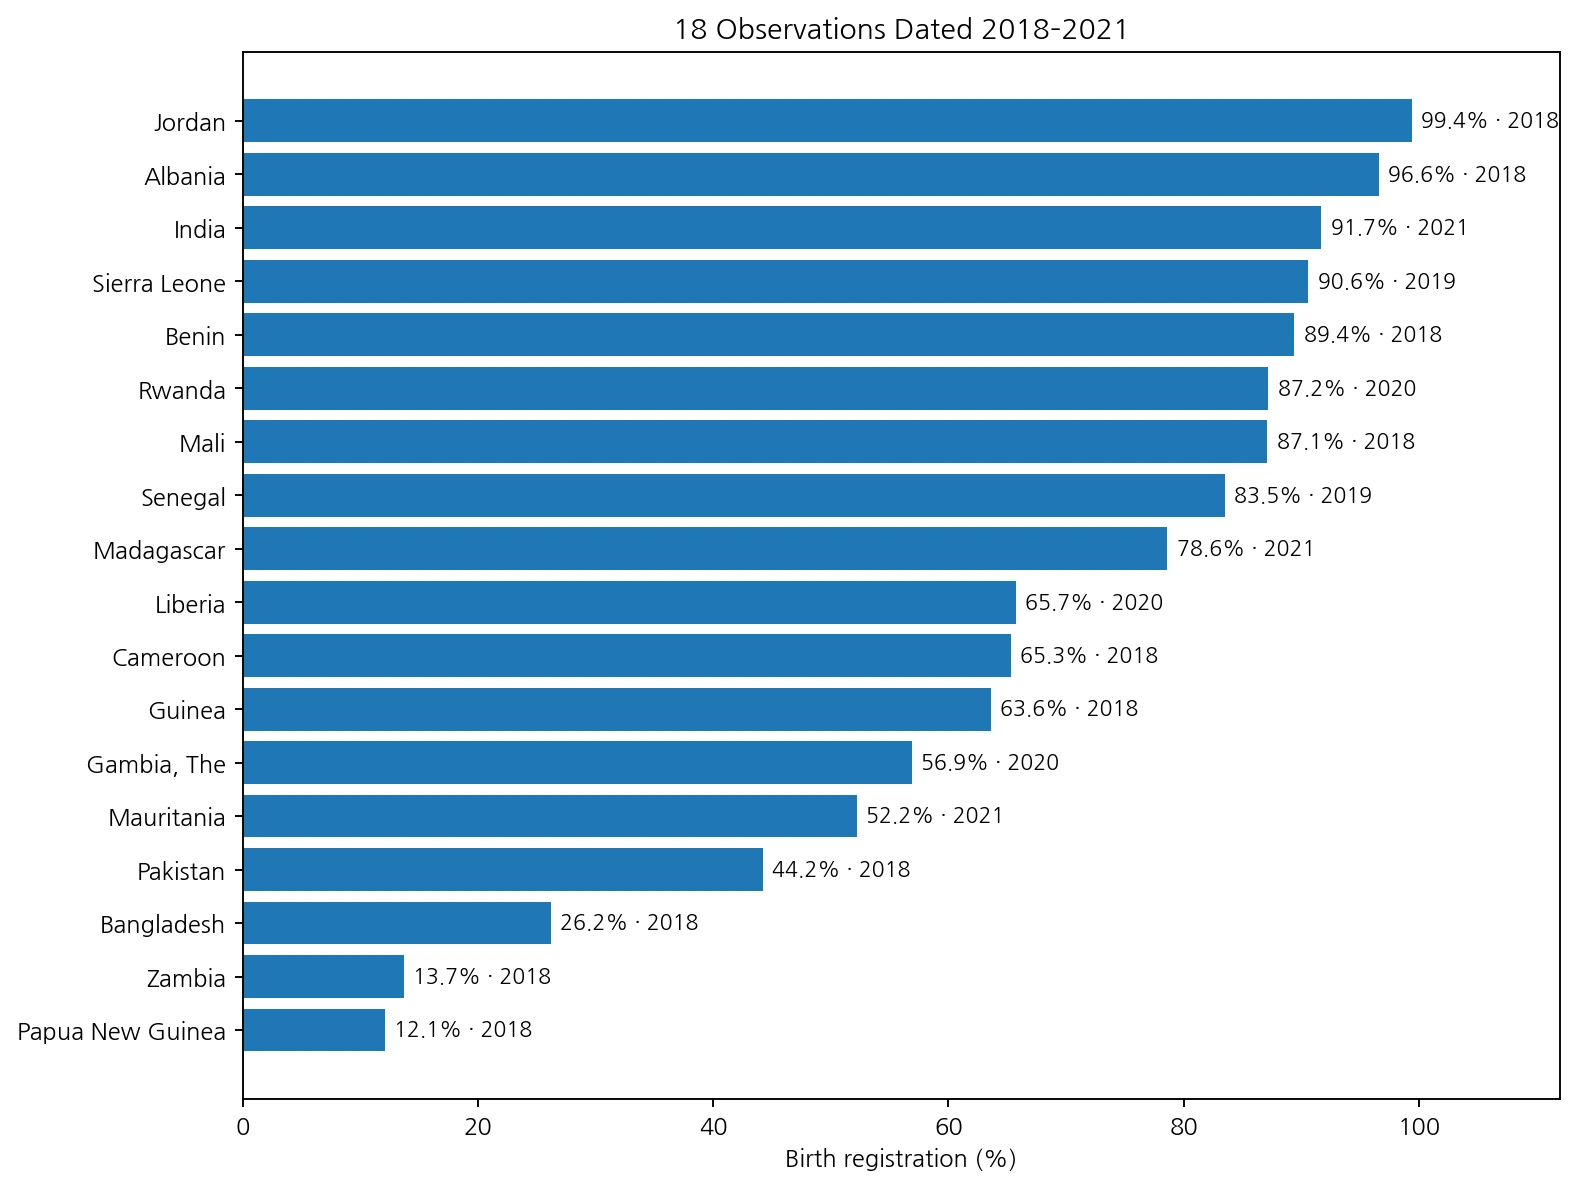
Restricting the data to 2018–2021 leaves 18 countries. Their median is 72.2% and their unweighted mean is 66.9%. Papua New Guinea is lowest at 12.1%, followed by Zambia at 13.7%, Bangladesh at 26.2%, Pakistan at 44.2%, Mauritania at 52.2%, and the Gambia at 56.9%.
| Country/area | Observation year | Q3 birth registration |
|---|---|---|
| Papua New Guinea | 2018 | 12.1% |
| Zambia | 2018 | 13.7% |
| Bangladesh | 2018 | 26.2% |
| Pakistan | 2018 | 44.2% |
| Mauritania | 2021 | 52.2% |
| Gambia, The | 2020 | 56.9% |
| Guinea | 2018 | 63.6% |
| Cameroon | 2018 | 65.3% |
| Liberia | 2020 | 65.7% |
| Madagascar | 2021 | 78.6% |
| Senegal | 2019 | 83.5% |
| Mali | 2018 | 87.1% |
| Rwanda | 2020 | 87.2% |
| Benin | 2018 | 89.4% |
| Sierra Leone | 2019 | 90.6% |
| India | 2021 | 91.7% |
| Albania | 2018 | 96.6% |
| Jordan | 2018 | 99.4% |
The upper end of this recent subset includes Guinea at 63.6%, Cameroon at 65.3%, Liberia at 65.7%, Madagascar at 78.6%, Senegal at 83.5%, Mali at 87.1%, Rwanda at 87.2%, Benin at 89.4%, Sierra Leone at 90.6%, India at 91.7%, Albania at 96.6%, and Jordan at 99.4%. Because only 18 countries remain, the subset should not be presented as a recent global ranking.
Registration is higher in Q4 and Q5 in many matched countries
Matching the same 105 countries and survey years across Q3, Q4, and Q5 reveals a socioeconomic gradient. Q4 is higher than Q3 in 74 countries, equal in 6, and lower in 25. The median Q4-minus-Q3 gap is 1.8 percentage points.
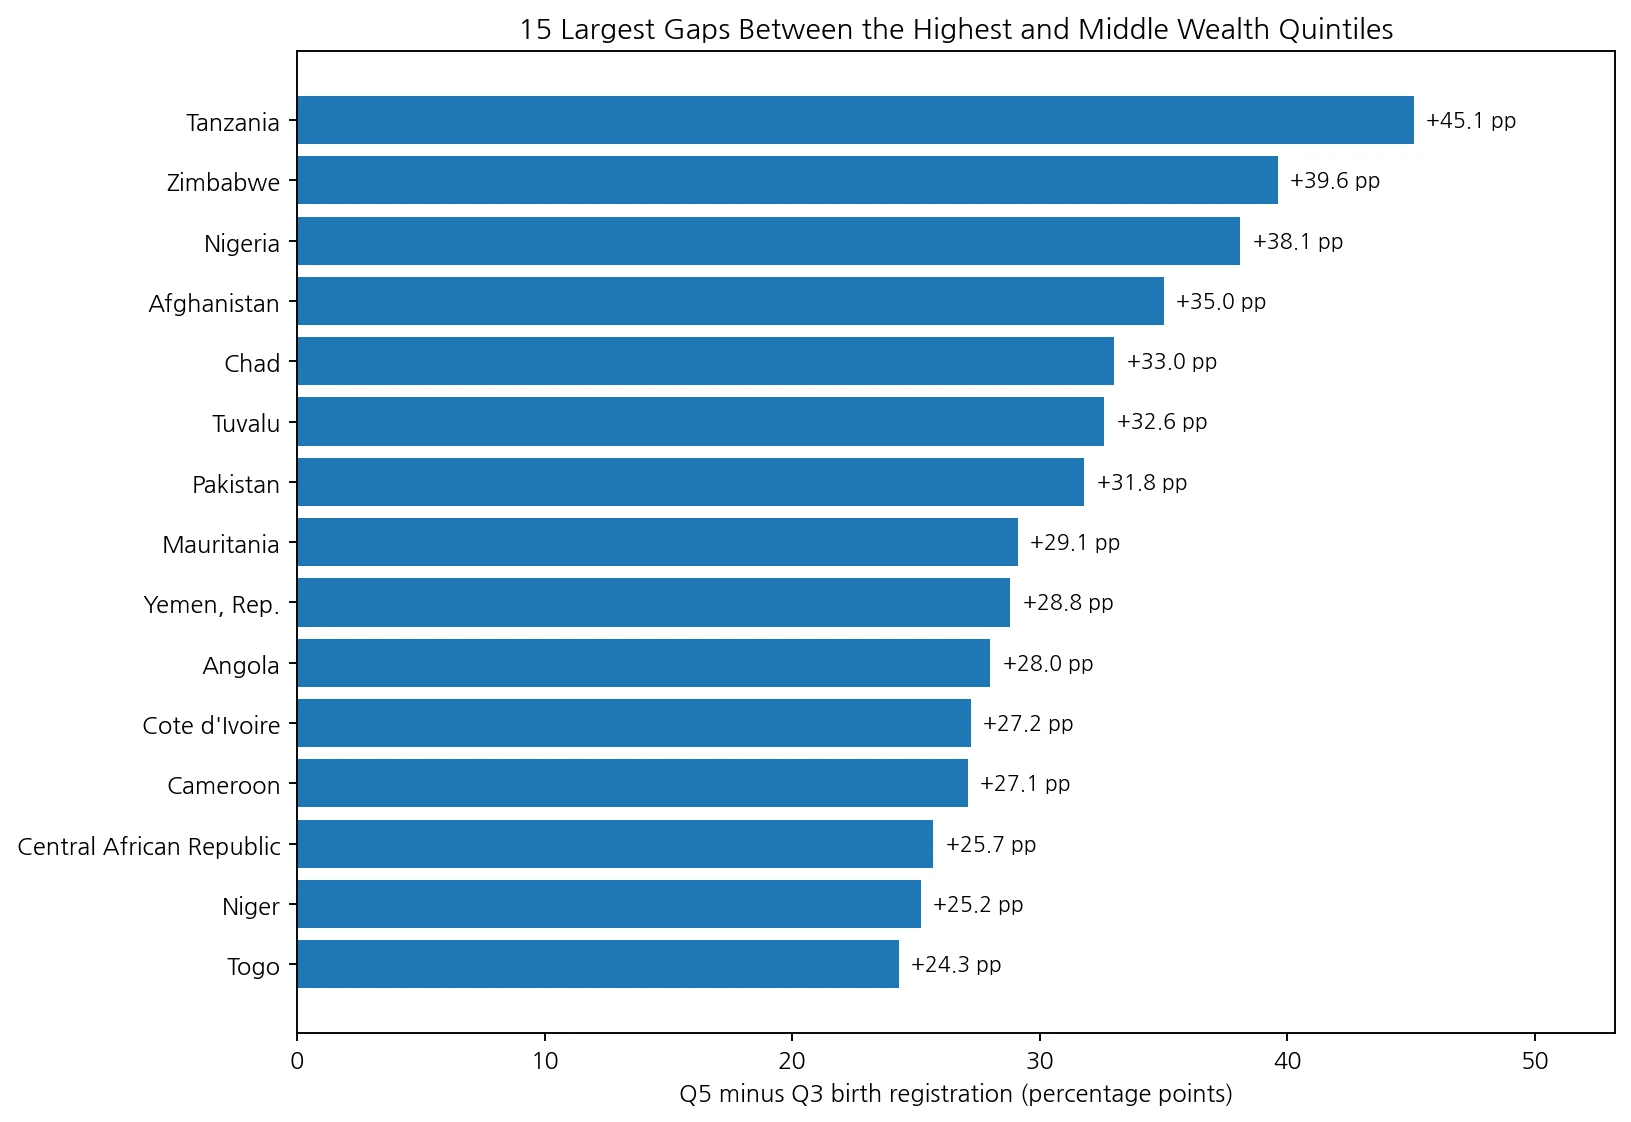
The difference is larger when Q3 is compared with the highest wealth quintile, Q5. Q5 is higher than Q3 in 87 countries, equal in 3, and lower in 15. The median Q5-minus-Q3 gap is 4.3 points, and the unweighted mean gap is 9.6 points. In many countries, children in the highest household group had substantially higher registration than those in the middle group.
| Country/area | Year | Q3 | Q4 | Q5 | Q5-Q3 gap |
|---|---|---|---|---|---|
| Tanzania | 2016 | 20.0% | 37.2% | 65.1% | +45.1 pp |
| Zimbabwe | 2015 | 39.4% | 54.3% | 79.0% | +39.6 pp |
| Nigeria | 2013 | 28.2% | 46.2% | 66.3% | +38.1 pp |
| Afghanistan | 2015 | 34.9% | 48.2% | 69.9% | +35.0 pp |
| Chad | 2015 | 6.1% | 8.0% | 39.1% | +33.0 pp |
| Tuvalu | 2007 | 38.0% | 59.6% | 70.6% | +32.6 pp |
| Pakistan | 2018 | 44.2% | 63.4% | 76.0% | +31.8 pp |
| Mauritania | 2021 | 52.2% | 66.3% | 81.3% | +29.1 pp |
| Yemen, Rep. | 2013 | 26.9% | 40.6% | 55.7% | +28.8 pp |
| Angola | 2016 | 26.9% | 30.7% | 54.9% | +28.0 pp |
| Cote d’Ivoire | 2012 | 65.5% | 81.6% | 92.7% | +27.2 pp |
| Cameroon | 2018 | 65.3% | 81.6% | 92.4% | +27.1 pp |
| Central African Republic | 2010 | 59.0% | 71.2% | 84.7% | +25.7 pp |
| Niger | 2012 | 64.1% | 61.7% | 89.3% | +25.2 pp |
| Togo | 2014 | 73.1% | 93.8% | 97.4% | +24.3 pp |
Tanzania has the largest Q5-Q3 gap at 45.1 percentage points, followed by Zimbabwe at 39.6, Nigeria at 38.1, Afghanistan at 35.0, Chad at 33.0, Tuvalu at 32.6, and Pakistan at 31.8. Mauritania is 29.1 points, Yemen 28.8, and Angola 28.0. These differences show where wealth-group disparities were large, but the three series alone do not explain their causes.
Q3, Q4, and Q5 do not rise perfectly in every survey
A simple expectation is that birth registration should rise steadily with household wealth, but Q3 Larger and repeated gaps are more informative. When Q3 and Q5 differ by 20 to 40 percentage points, the within-survey contrast is large enough to justify further investigation. Country-specific DHS or MICS reports can then be used to examine residence, region, parental education, administrative access, and other variables that are not contained in the quintile indicator itself. Nineteen of the 105 observations are from 2014, 14 from 2012, and ten each from 2015 and 2016. Ten are from 2018, but only two are from 2019 and three each from 2020 and 2021. The presence of 2021 as the maximum year does not mean that the full table describes the world in 2021. To make that limitation visible, the world map is labeled as a latest-observation view and the 2018–2021 values are separated. A current global comparison would require newer harmonized observations or a larger common-year subset from UNICEF or the World Bank. This wealth-disaggregated series covers 105 countries and separately reported areas. Countries such as Korea, the United States, Japan, and Germany are not present in this table and must not be assigned a zero. Wealth-quintile birth-registration statistics depend on detailed household surveys, so coverage is narrower than the general birth-registration indicator. Gray areas on the map likewise indicate no matched Q3 observation or no distinct low-resolution polygon, not zero birth registration. Keeping missing data separate from measured low values is essential for interpreting the map correctly. The primary statistical source is World Bank SP.REG.BRTH.Q3.ZS, Completeness of birth registration (%): Q3. The general World Bank birth-registration definition covers children under five whose births were registered at the time of the survey, including births verified by a certificate and births reported as registered by a mother or caretaker. The underlying data are largely compiled by UNICEF from household surveys such as DHS and MICS. All map and distribution statistics use 105 latest non-missing Q3 observations dated 2006–2021. The Q4 and Q5 gap analysis matches World Bank SP.REG.BRTH.Q4.ZS and SP.REG.BRTH.Q5.ZS for the same country and survey year. ISO-3 codes are joined to a Natural Earth low-resolution world layer, with 95 polygons directly matched. Q3 is the middle 20% group when households are divided into five relative wealth quintiles, roughly the 40th to 60th percentile within each country. No. It covers children under five living in households in the middle wealth quintile. No. Observation years range from 2006 to 2021, so the map represents the latest retained observation for each country or area. Not always, but Q5 is higher than Q3 in 87 of the 105 matched country observations, and some countries show large gaps. Green Map creates custom-edited map images using open geographic data sources such as geoBoundaries, Natural Earth, OpenStreetMap, and government open data. These maps are edited visual materials, not raw data files, and are provided for education, documents, presentations, and graphic reference.The 2006–2021 spread in observation years is the main limitation
Countries missing from the Q3 table are not zero
Data source and calculation method
Frequently Asked Questions
What does Q3 mean in this indicator?
Does this indicator cover all children under five?
Can the 105 values be treated as a 2021 country ranking?
Is birth registration always higher in wealthier quintiles?
Related Articles