The Carroll County Illinois Land Cover Map set shows a strong east-west contrast. Agriculture covers 72.47% of the 2025 summary and dominates the interior and eastern half, while forest, water, and wetlands become more prominent toward the Mississippi River. Developed land accounts for 7.19%, forest for 12.81%, water for 4.04%, and wetlands for 2.60%.
Four views are included: current land cover, forest and farmland, impervious surface and developed land, and a 1985–2025 class-difference comparison. The WebP images can be read directly on the page, and the four original 2480 × 1754-pixel JPG maps are available together in one ZIP download for county profiles, farm-and-forest lessons, river-corridor discussion, and presentation graphics.
Table of Contents
Farm country dominates the east while the Mississippi River side becomes more wooded
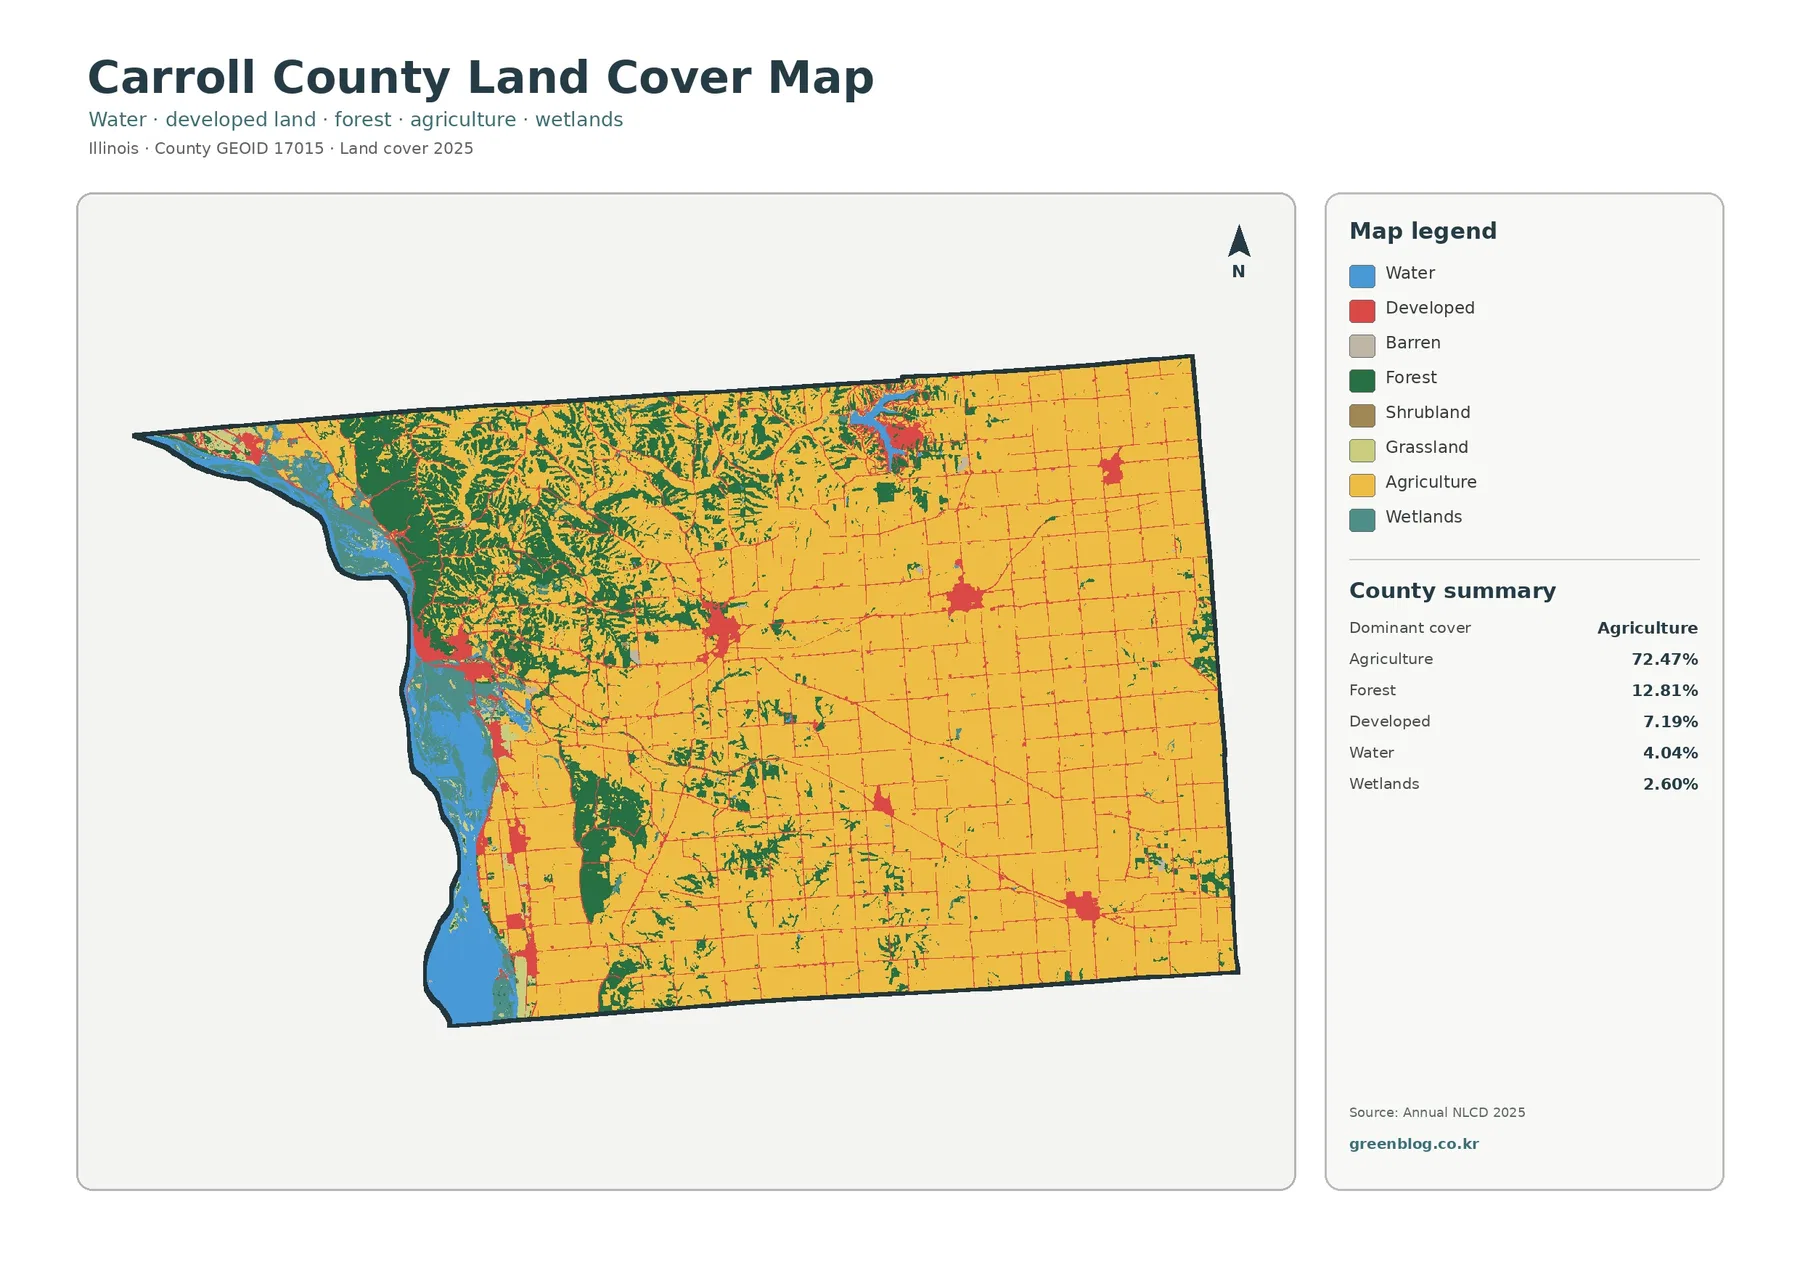
Agriculture is the dominant class at 72.47%. Yellow field blocks cover most of the east, extend across the center, and remain broad through the south. The farm pattern is especially regular in the eastern half, where development and forest occupy much smaller pieces. Moving west, fields are broken more often by woodland, wetlands, open water, and river settlements.
Forest covers 12.81%. Dark green is concentrated in the northwest and along much of the western side, with smaller wooded patches extending through the center and southwest. Illinois DNR describes Mississippi Palisades State Park, north of Savanna in Carroll County, as a landscape of river bluffs and wooded ravines. That description helps explain why the western part of the map contains much more forest than the open farm country to the east.
Developed land is 7.19%. A major red cluster sits along the western river edge and aligns with Savanna, whose official city site describes it as a Mississippi River town between the river and the bluffs of northwest Illinois. Another noticeable cluster lies farther inland near Mount Carroll, which Illinois State Archives identifies as the current county seat. Additional town clusters appear east and southeast, but the raster map does not label municipal boundaries.
Land cover is a surface classification, not a zoning or ownership map. A developed cell can contain lawns, trees, and bare soil along with buildings or pavement. Agricultural color does not identify a parcel owner, crop, or legal land use.
Water and wetlands give the western edge a different character
Blue water follows the Mississippi River side and widens into larger river and backwater shapes in the west-central and southwest parts of the county. The City of Savanna identifies the Mississippi River as part of its riverfront setting, while Illinois DNR places Mississippi Palisades State Park near the confluence of the Mississippi and Apple rivers. Those references match the strong river context visible on the map.
Open water accounts for 4.04% and wetlands for 2.60%. Wetlands appear beside portions of the river and in several low-lying interior patches. The classes should remain separate. Open water represents exposed water surfaces, while wetland classes can include saturated ground and water-influenced vegetation.
The river-edge forest, water, and wetlands sit close together in the northwest and west-central area. Mississippi Palisades is described as having wooded ravines and steep river cliffs, which helps explain why the western county does not resemble the flatter-looking agricultural east. The land-cover cells remain generalized observations rather than park or regulatory boundaries.
The vegetation view separates the wooded west from the agricultural east
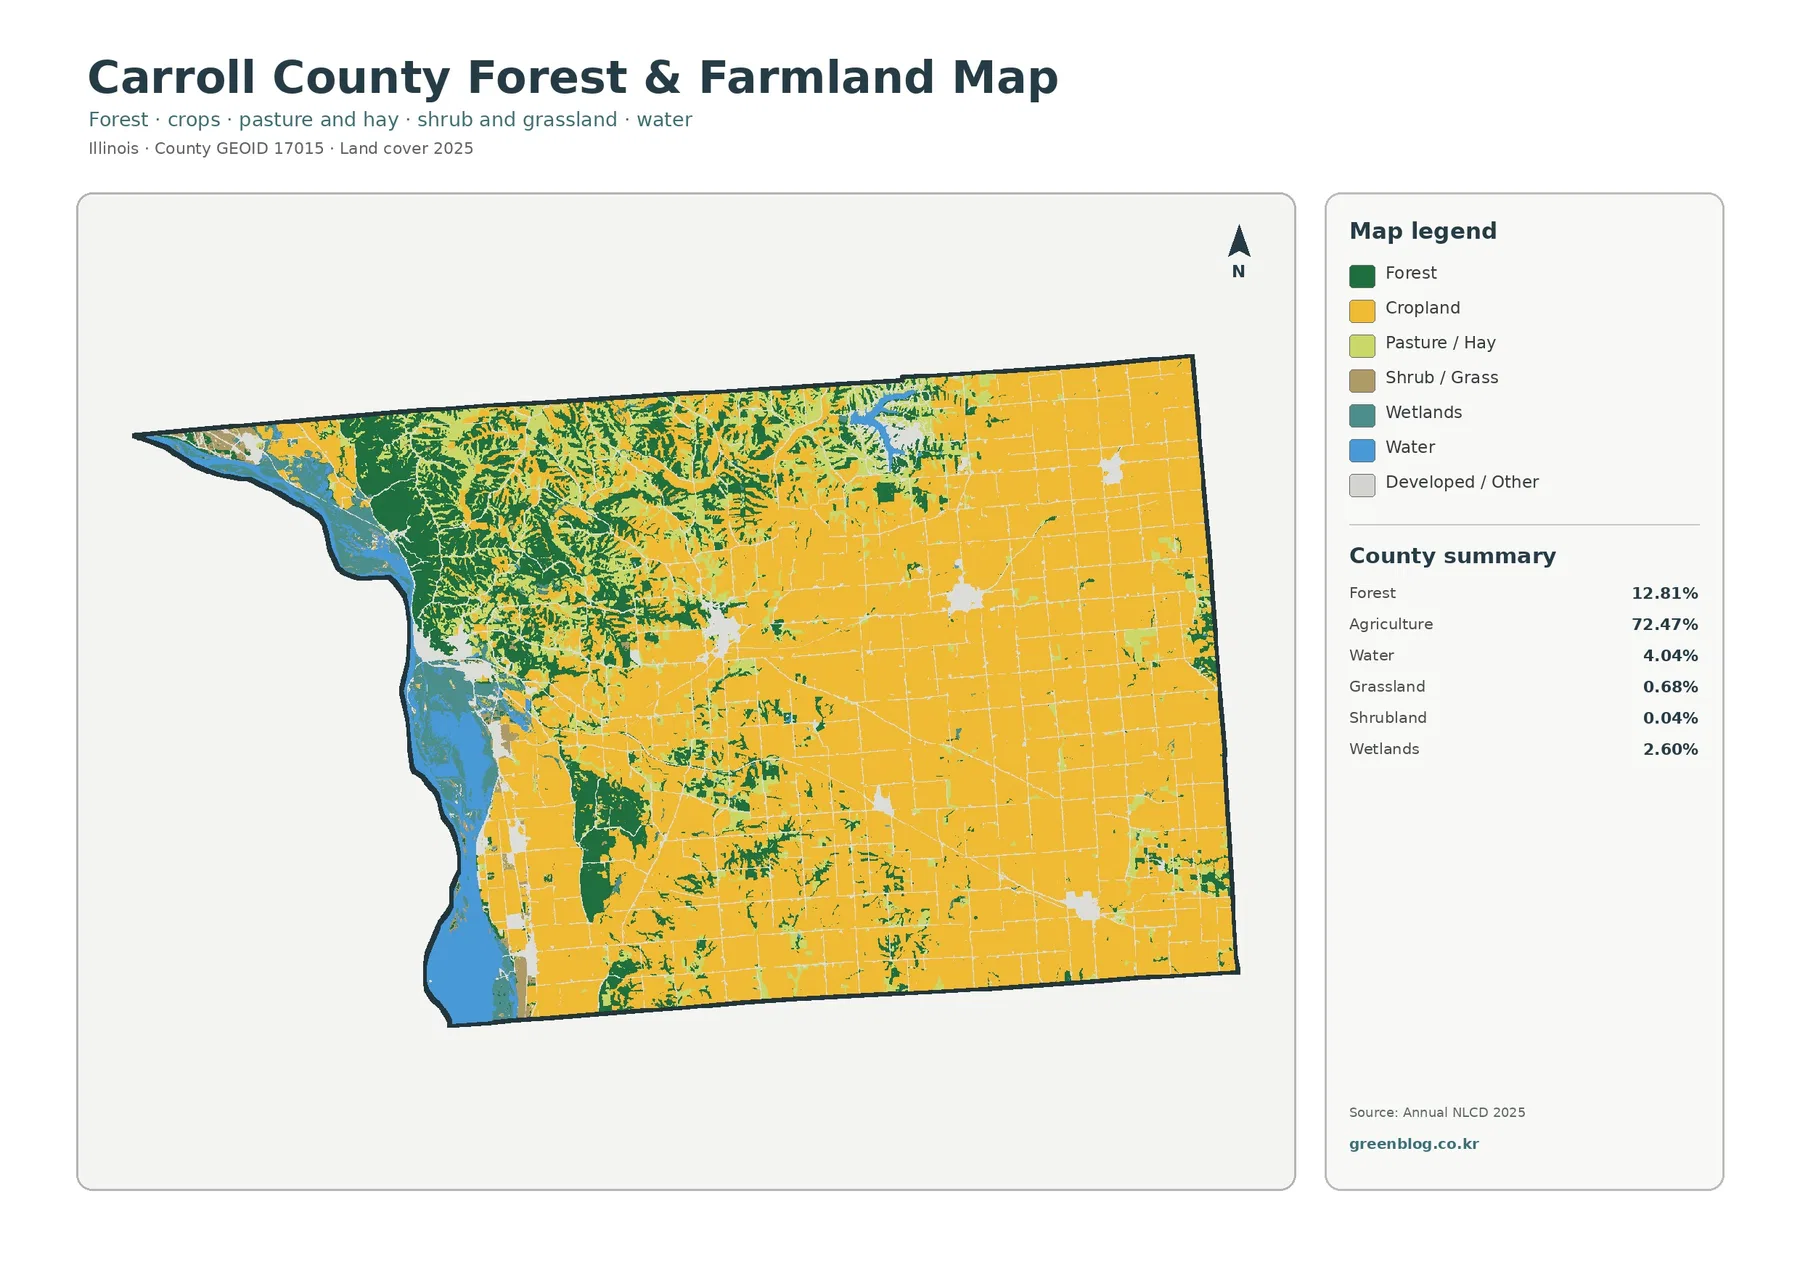
Once developed and miscellaneous surfaces are faded, the countywide agricultural dominance is even clearer. The eastern half becomes a broad field matrix with only scattered forest and water, while the west contains larger green blocks and more broken agricultural shapes. Mount Carroll and the riverfront settlement around Savanna appear as lighter openings within those two different settings.
Forest becomes especially prominent in the northwest and along the western bluffs. South of the main riverfront forest, smaller wooded blocks continue among fields and wet areas. The 12.81% forest share can sound modest in a table, yet the class controls large parts of the map where it is concentrated.
Grassland is 0.68% and shrubland only 0.04%, so neither defines the county. The more useful vegetation comparison is between the 72.47% agricultural base and the forest, wetland, and water environments associated with the Mississippi River side.
University of Illinois Extension serves Carroll, Lee, and Whiteside Counties and maintains a Carroll County office in Mount Carroll. Its agriculture and natural-resource programs provide useful local context, while the land-cover percentages on this page come from the supplied Annual NLCD map.
Impervious cover isolates the small town centers from the rural matrix
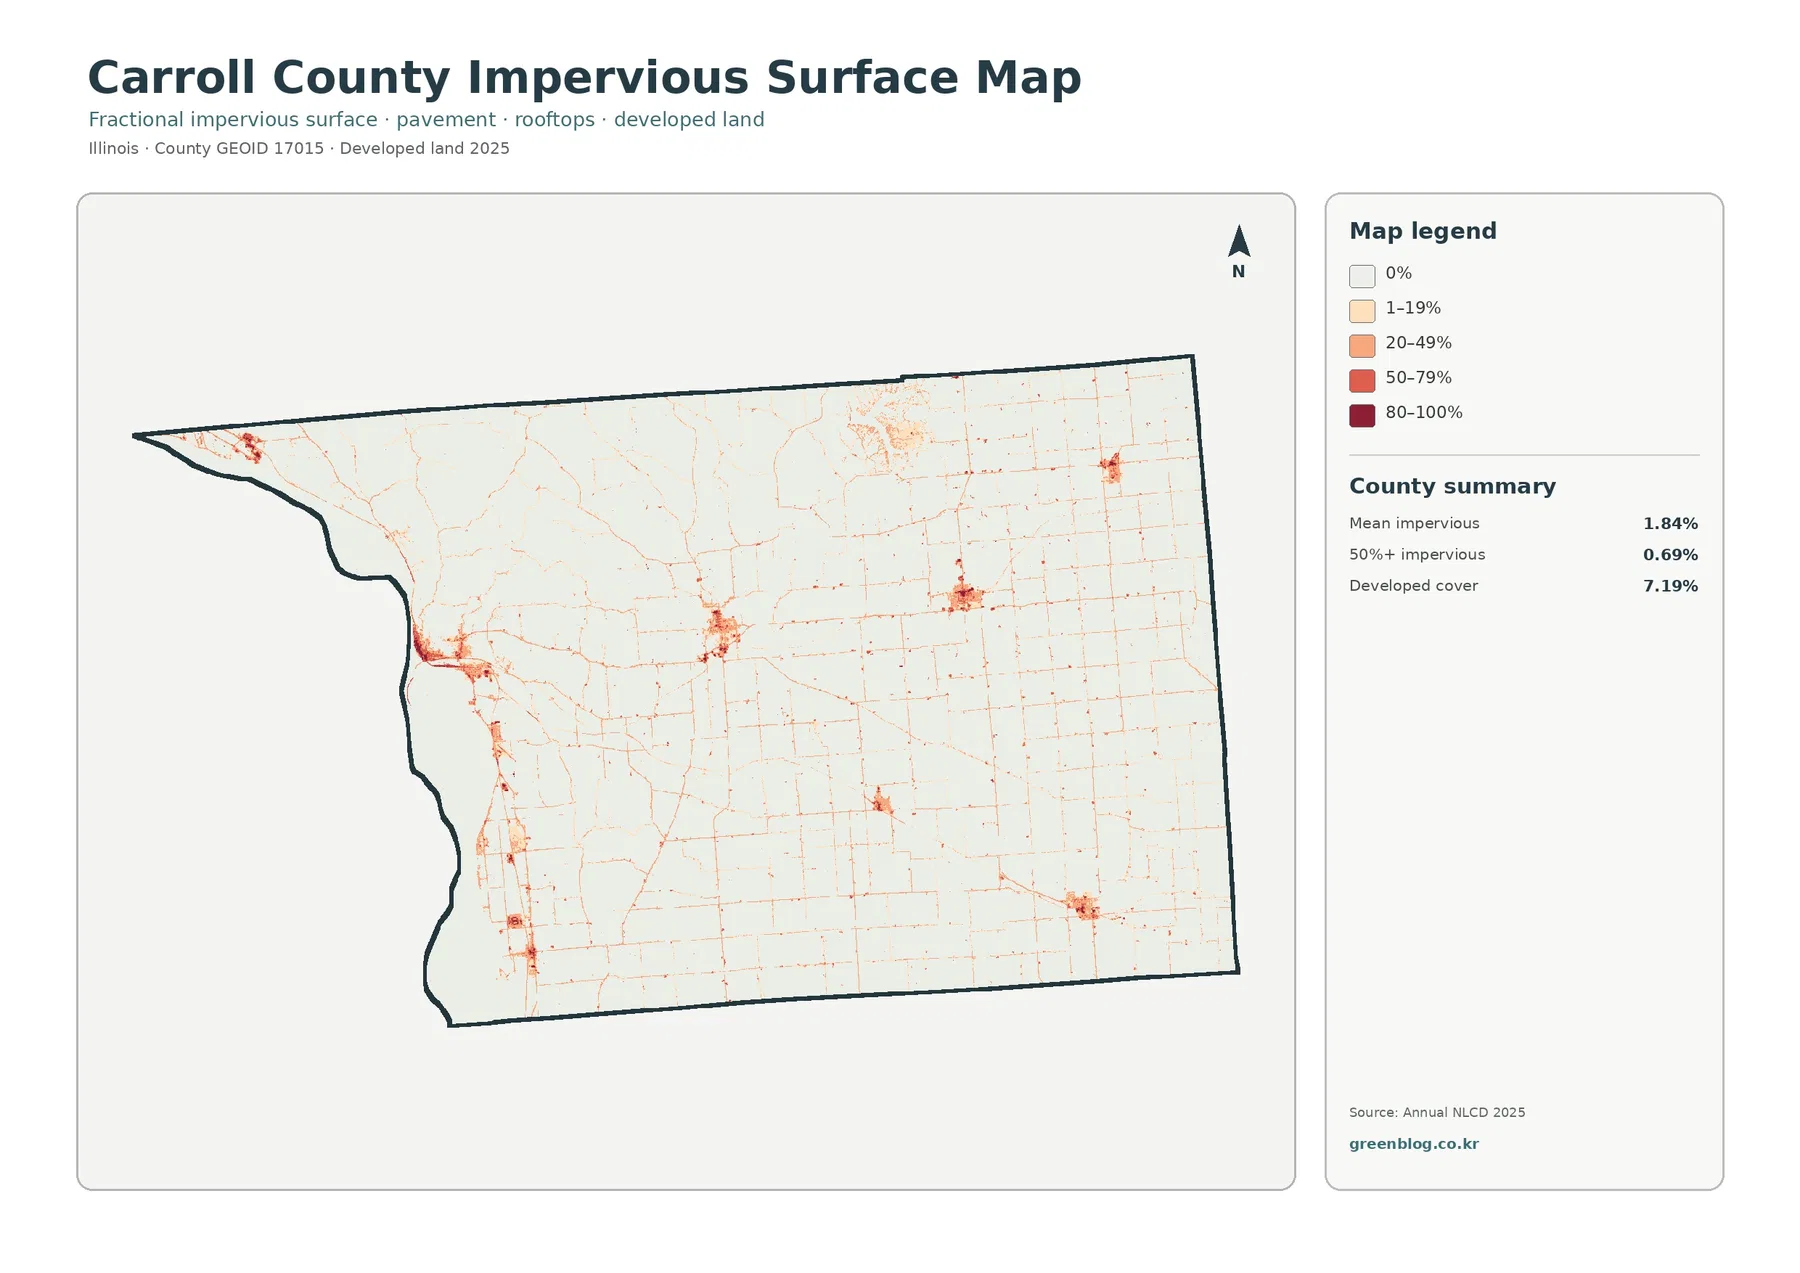
Mean impervious cover is 1.84%, and 0.69% of the county is mapped at 50% impervious or greater. Those values are below the 7.19% developed land-cover share because developed classes can include lawns, trees, bare soil, and other permeable ground. Impervious cover narrows the question to harder surfaces such as roofs and pavement.
The strongest hard-surface cluster on the western edge aligns with Savanna. Another distinct cluster appears inland near Mount Carroll, and several smaller concentrations are visible in the eastern and southeastern farm country. Between them, faint linear traces form a road-like network through areas that otherwise have little impervious cover.
This pattern is useful for comparing settlement intensity, but impervious surface is not a flood-risk layer. River level, floodplain position, drainage, terrain, soil, and wetlands are especially important near the Mississippi River. A low countywide hard-surface average does not mean every riverfront location has low flood exposure.
The 1985–2025 comparison reports 8.90% total class difference
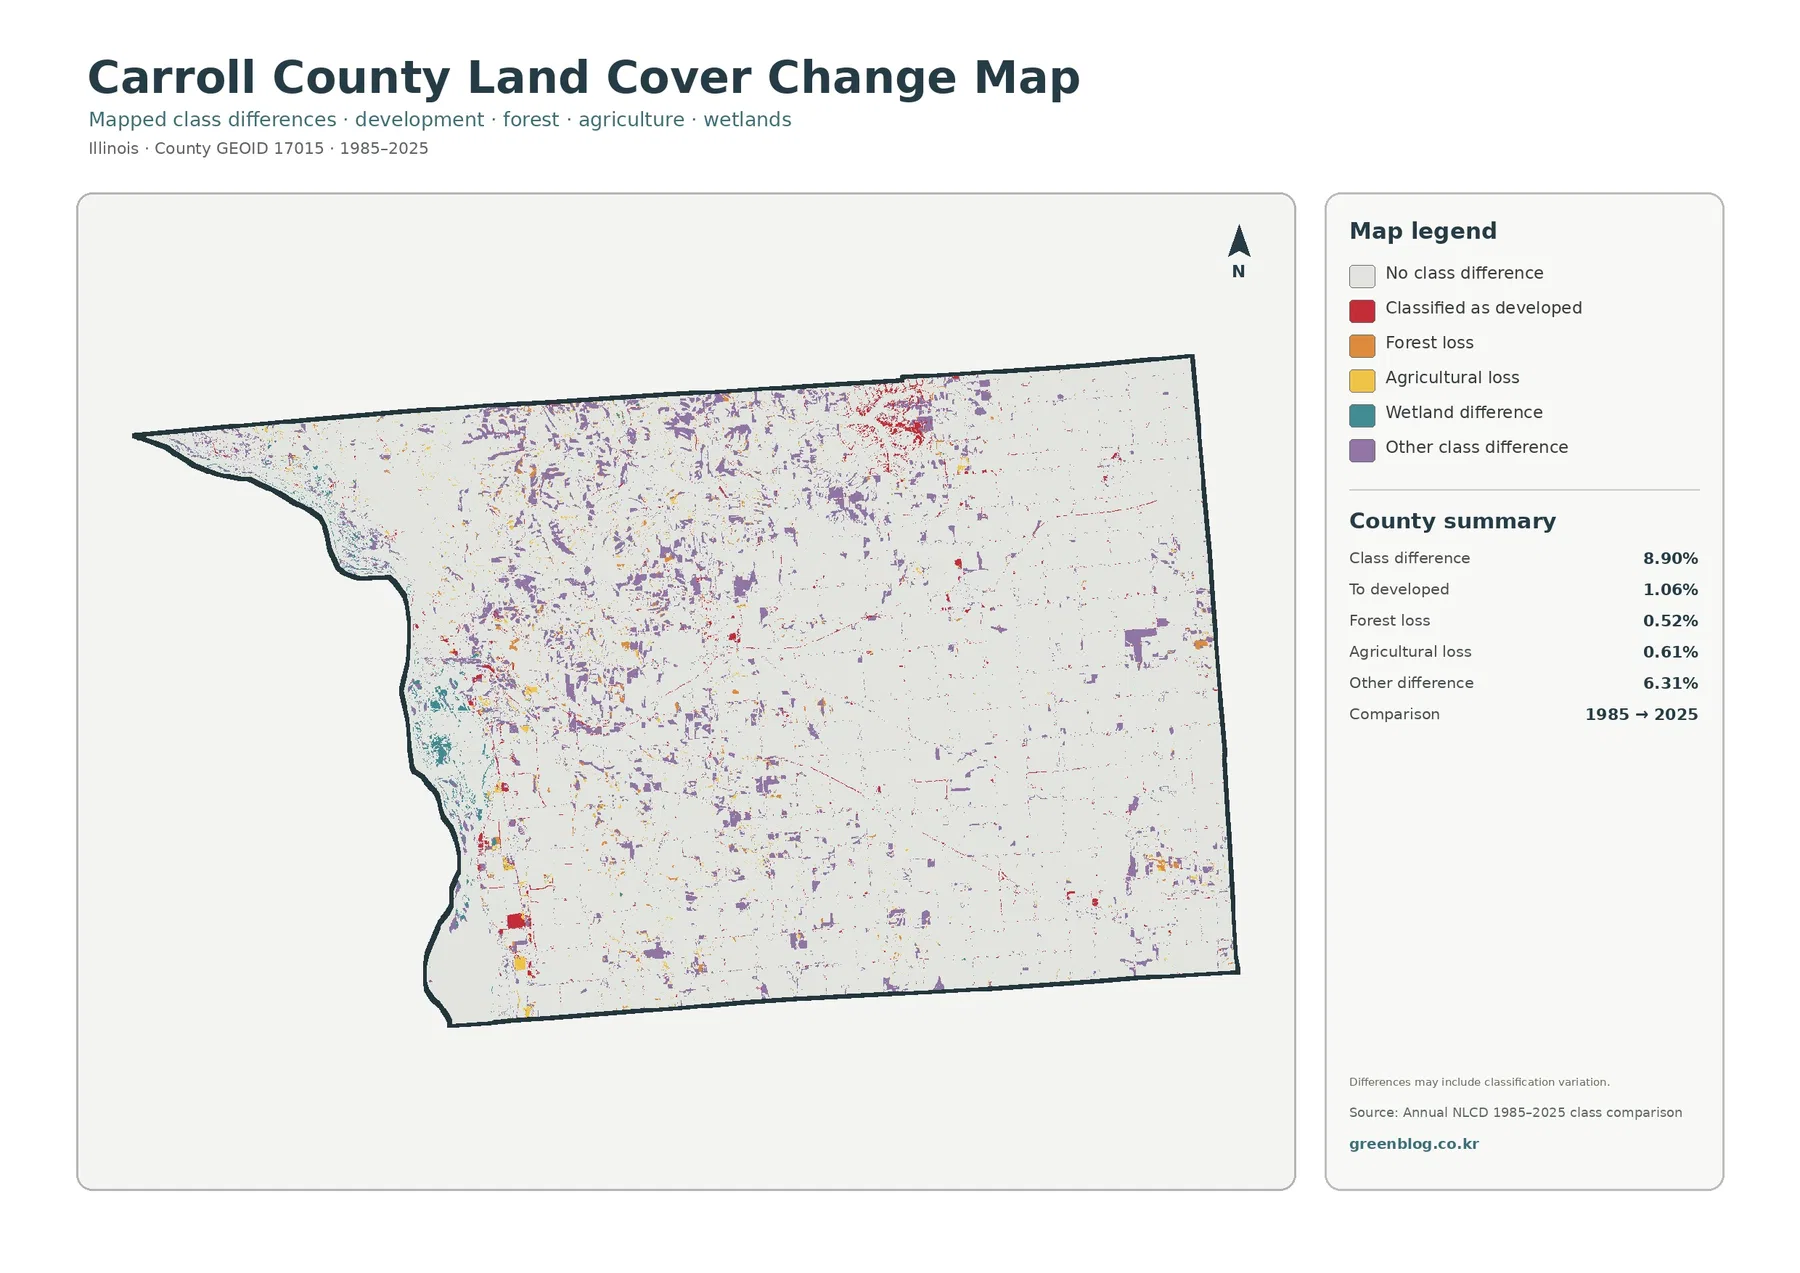
The endpoint comparison reports 8.90% total class difference. Listed components are 1.06% classified as developed, 0.52% forest loss, 0.61% agricultural loss, and 6.31% other difference. Wetland difference appears in the legend without a printed percentage, so it should not be estimated visually or treated as an official residual.
Purple other-difference cells are most noticeable in the north, northwest, and west-central portions of the county, with smaller patches elsewhere. Red developed-conversion marks appear around Savanna, Mount Carroll, and other settlement clusters. Wetland-difference cells are also visible near portions of the western river corridor.
Loss in this legend means a different class at the two endpoints. It does not prove logging, farm abandonment, construction, flooding, or another cause. Real surface change can contribute, but mixed 30-meter pixels, seasonal conditions, and classification variation can also matter. Intermediate imagery and local records are needed for a detailed history.
Choose the map that matches the question
For a general Carroll County profile, begin with the 2025 overview. It places the farm-dominated east, the forested Mississippi River side, and the main settlement clusters in one frame. The forest-and-farmland view works well when the goal is to explain the western woodland concentration or the continuity of the eastern farm matrix.
The impervious map is the better choice for comparing town centers. Its 1.84% mean makes sense only when viewed beside the localized dark clusters and the long rural stretches with very little hard surface. The change map belongs last so present-day cover is not confused with endpoint class differences.
Annual NLCD uses generalized 30-meter raster cells. A crop field, tree line, drainage ditch, road, lawn, and building can share a cell while only one predominant class is displayed. Each original JPG measures 2480 × 1754 pixels, and the package does not state that the files meet an A3 high-resolution reference. Large-format prints should therefore be tested first.
Files included in the four-map JPG download
The ZIP contains one JPG each for 2025 land cover, forest and farmland, impervious surface and developed land, and 1985–2025 land-cover change. Together they provide a consistent county boundary for comparing Carroll County’s eastern farm country, Mississippi River forest and wetlands, river towns, and endpoint class differences.
Frequently Asked Questions
How agricultural is Carroll County in the 2025 map?
Agriculture covers 72.47% of the supplied 2025 summary. It dominates the east and much of the south and center. The western Mississippi River side is different, with more forest, water, wetlands, and several settlement clusters interrupting the farm pattern.
Can the western developed cluster be treated as the exact boundary of Savanna?
No. Savanna’s official site confirms that it is a Mississippi River town, so the western cluster is reasonably associated with the Savanna area. The land-cover map does not show legal municipal limits, and an official city or county map is required for exact boundaries.
Does the 8.90% class-difference value equal the amount of land physically changed since 1985?
No. It is the share of cells receiving different classifications at the 1985 and 2025 endpoints. Real change can contribute, but mixed pixels, seasonal conditions, and classification variation can also matter. Intermediate imagery and local records are needed to determine cause and timing.
Sources and Reference Data
- MRLC Annual NLCD Data – official access point for annual land-cover and comparison products
- USGS Annual NLCD Land Cover Classification – official guidance for the 30-meter land-cover classes
- U.S. Census Bureau TIGER/Line Shapefiles – official county-boundary reference for Carroll County
- City of Savanna – official city context for the Mississippi River riverfront and surrounding bluffs
- Illinois DNR – Mississippi Palisades State Park – official description of river bluffs and wooded ravines north of Savanna in Carroll County
- University of Illinois Extension – Carroll, Lee and Whiteside Counties – local agriculture and natural-resource programs and the Carroll County office in Mount Carroll
Map File Information
The ZIP contains four original JPG maps for comparing Carroll County's agricultural interior, Mississippi River forest, water and wetlands, Savanna and Mount Carroll hard surfaces, and 1985–2025 class differences.
- Included Files: General land cover, forest and farmland, impervious/developed surface, and land-cover change maps
- File Type: Four original JPG map files bundled in one ZIP archive
- Intended Use: Printing, education, presentations, and map-based projects
Related Maps
- Adams County Illinois Land Cover Map
- Alexander County Illinois Land Cover Map
- Bond County Illinois Land Cover Map
Green Map creates custom-edited map images using open geographic data sources such as geoBoundaries, Natural Earth, OpenStreetMap, and government open data. These maps are edited visual materials, not raw data files, and are provided for education, documents, presentations, and graphic reference.