The Bibb County Georgia Land Cover Map is first and foremost an urban land-cover map. Developed land accounts for 40.15% of the supplied 2025 summary, followed by forest at 30.28%, wetlands at 15.11%, agriculture at 9.08%, water at 2.34%, grassland at 1.09%, and shrubland at 1.06%. The strongest developed footprint occupies the center and north, while forest, farms, water, and wetlands become more prominent toward the outer parts of the county.
This page includes four different views of Bibb County: current land cover, forest and farmland, impervious surface, and a 1985–2025 class comparison. WebP previews are placed in the article for quick inspection, and the four original JPG maps are available together in the ZIP below. The set is useful for comparing Macon’s built footprint with the Ocmulgee River corridor, western water bodies, surviving forest, and smaller agricultural areas.
Table of Contents
The hard-surface map shows where Macon’s urban footprint is most intense
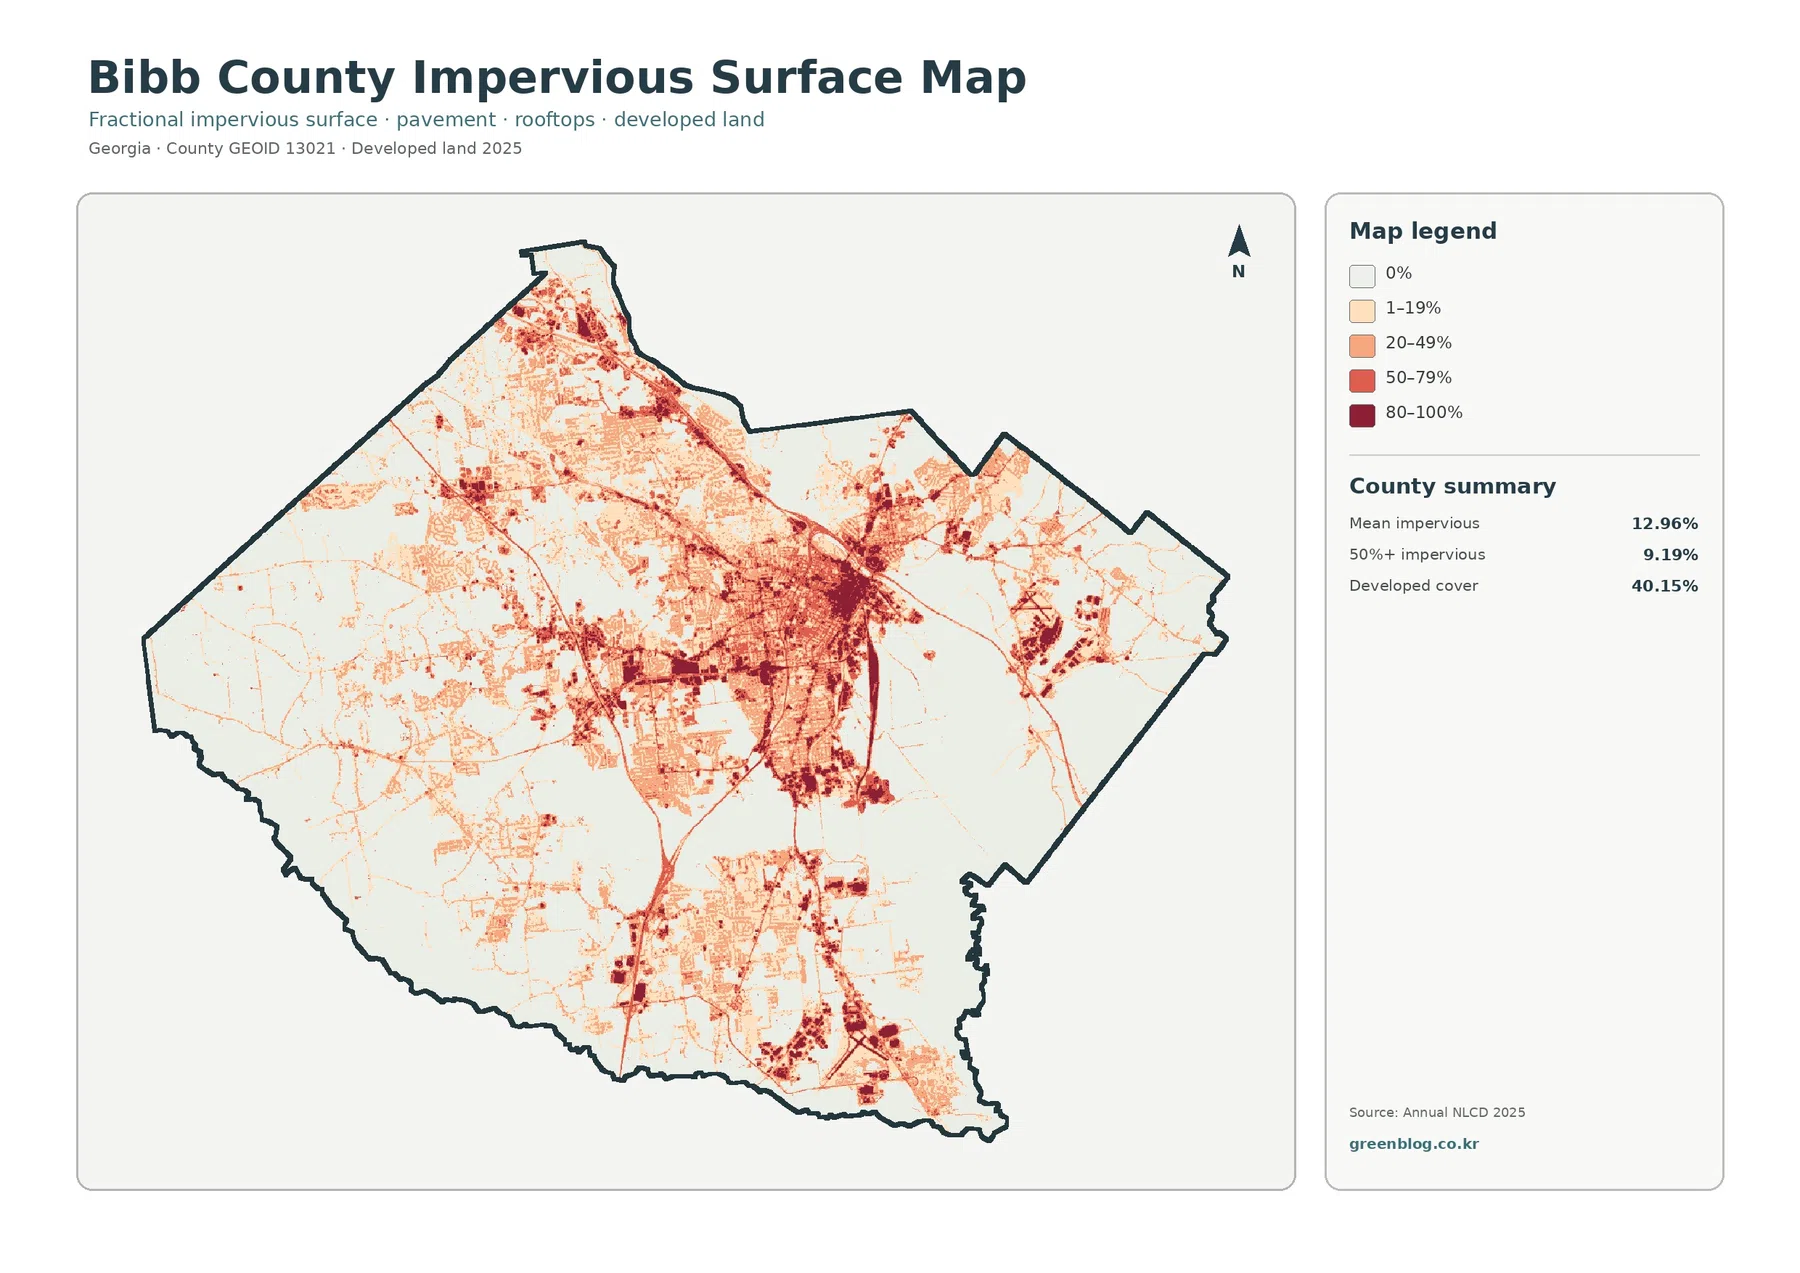
Bibb County has a mean impervious value of 12.96%, and 9.19% of the county is mapped at 50% or greater impervious cover. Impervious surfaces are rooftops, pavement, parking areas, and similar materials that do not readily absorb rainfall. Those values are much lower than the 40.15% developed-land share because developed neighborhoods can still contain lawns, trees, parks, and exposed soil.
The darkest values form a dense central concentration and continue northward along several connected bands. Another strong developed area appears in the southern part of the county, while smaller high-value patches are spread to the north and east. Most western forest and farmland and much of the eastern outer county remain pale. This makes the difference between a broad developed classification and a heavily hardened urban surface easy to see.
Macon-Bibb Planning & Zoning Commission is the official local body that plans physical development and administers zoning for Macon-Bibb County. Its current comprehensive-planning work addresses land use, transportation, housing, economic development, and quality of life. That planning context is useful for understanding why the developed footprint matters, but the impervious layer itself is not a zoning map and cannot identify what a particular parcel is legally allowed to become.
Developed land is the largest 2025 class, but forest still covers nearly one third
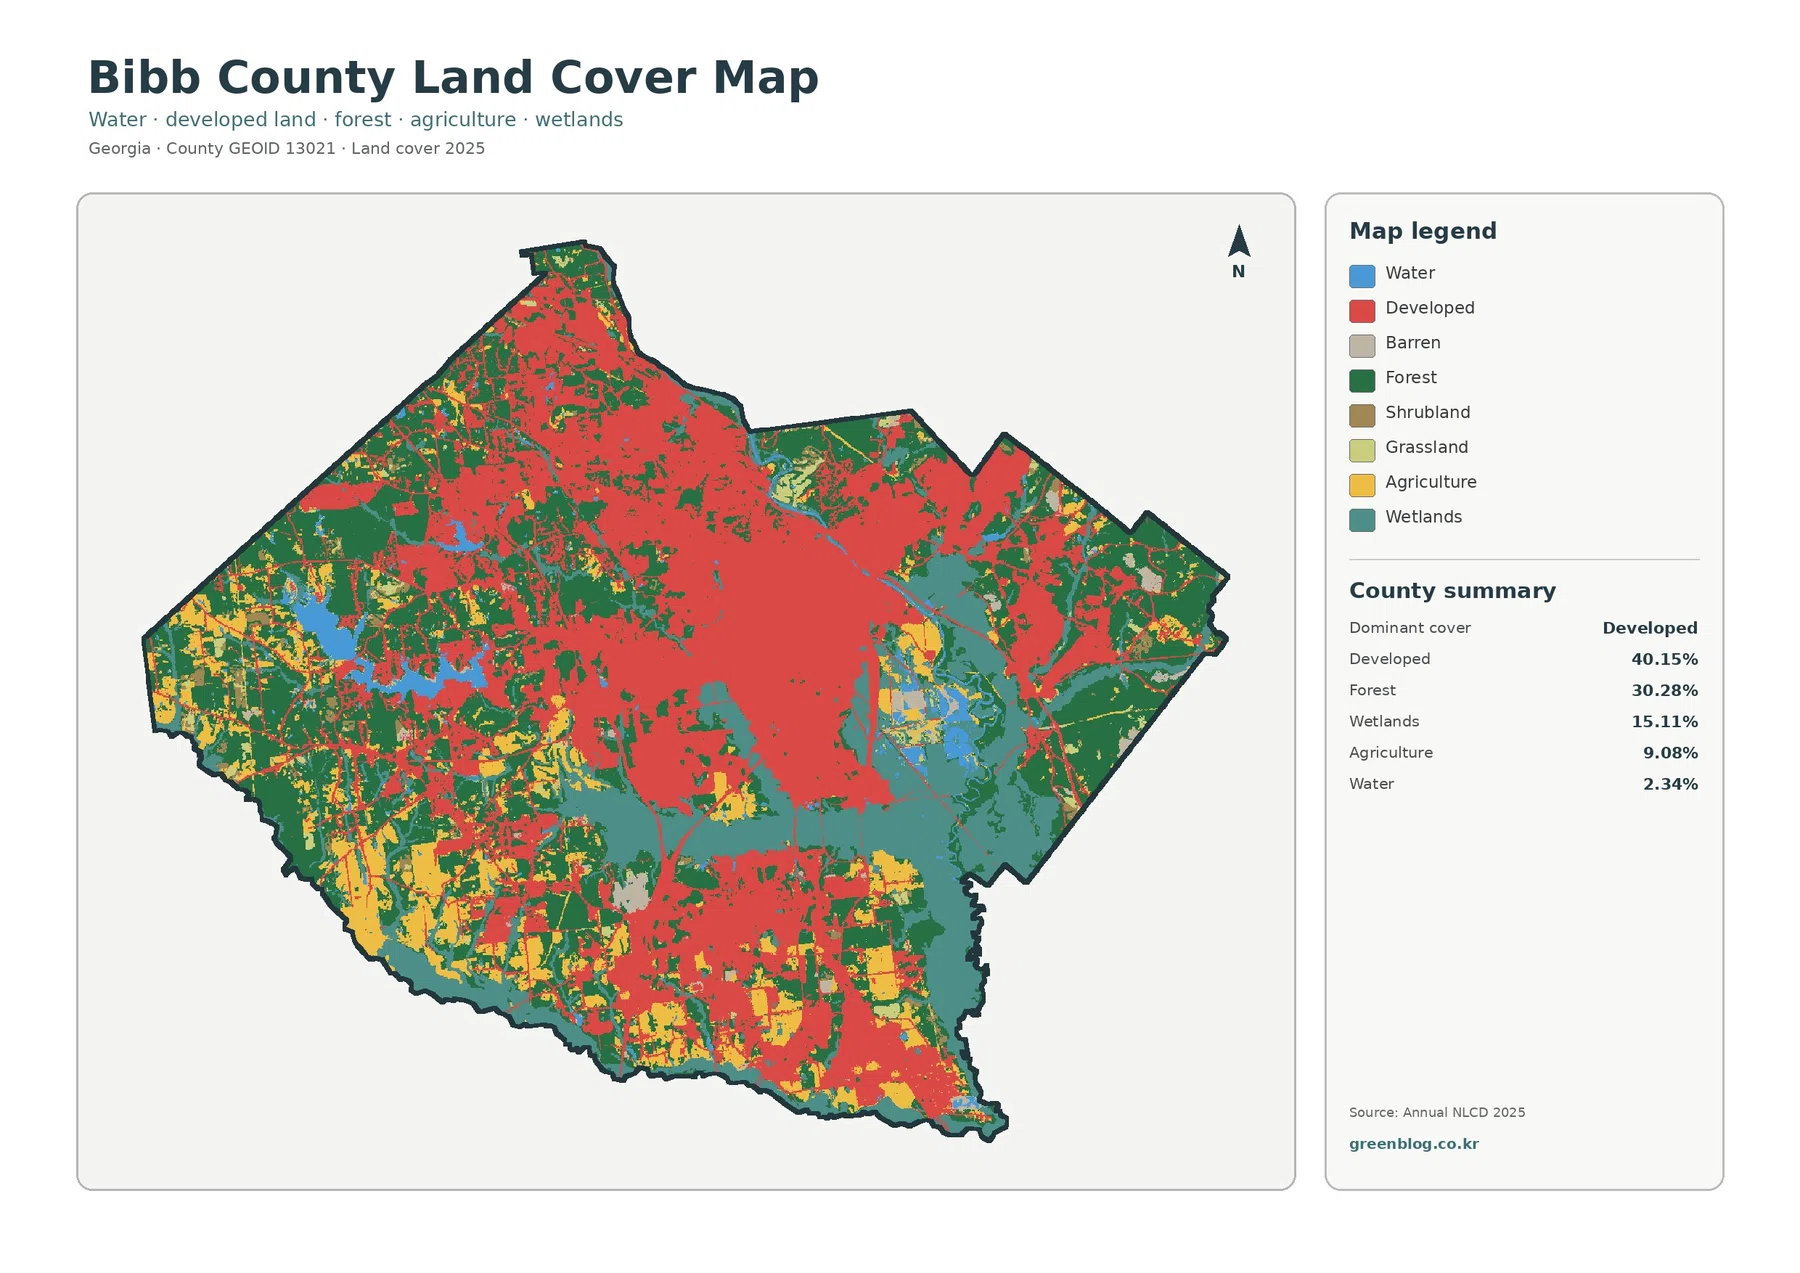
Red developed cover spreads across a large central area and continues into the north. The southern portion also contains a distinct developed concentration, and thinner red traces connect smaller patches elsewhere. With 40.15% of the county classified as developed, urban and suburban surfaces are not a minor interruption in the landscape; they are the largest single class.
Forest remains substantial at 30.28%. Dark-green blocks are especially noticeable along the western and eastern outer areas and through the southeast. Smaller wooded areas survive within the broader developed matrix as well. This combination explains why a map dominated by Macon’s urban footprint can still retain extensive natural cover within the same county boundary.
Agriculture is 9.08%. Yellow areas occur mostly in the southwest, south, and western outer county, with smaller blocks elsewhere. These farm areas are repeatedly divided by forest, developed land, and wetlands rather than forming one continuous agricultural zone. Grassland and shrubland are both close to 1%, adding smaller open-vegetation areas along rural and developed edges.
The Ocmulgee River and western water areas break up the built landscape
USGS operates an official monitoring location named “Ocmulgee River at Macon, GA” in Bibb County. On the land-cover map, blue water and teal wetland areas extend along the eastern side of the main urban concentration and continue toward the southeast. That relationship gives the county an important river-and-wetland element even though developed land dominates the overall percentage summary.
Wetlands account for 15.11%, a larger share than agriculture. Teal cover is widespread in the east and southeast and also appears in central and western locations. Open water is only 2.34%, so blue water should not be treated as a complete measure of the county’s wet environment. Wetland cells represent wet ground or wetland vegetation rather than simply an open water surface.
A large branching blue area also stands out in the western portion of the county. Macon-Bibb County manages Lake Tobesofkee as a county recreation area, providing useful local context for the western water pattern. The land-cover image does not label the reservoir or show water level, shoreline ownership, or recreational facilities, so those details belong to dedicated local water and recreation sources.
Fading development reveals the forest, farms, and wetlands outside the urban core
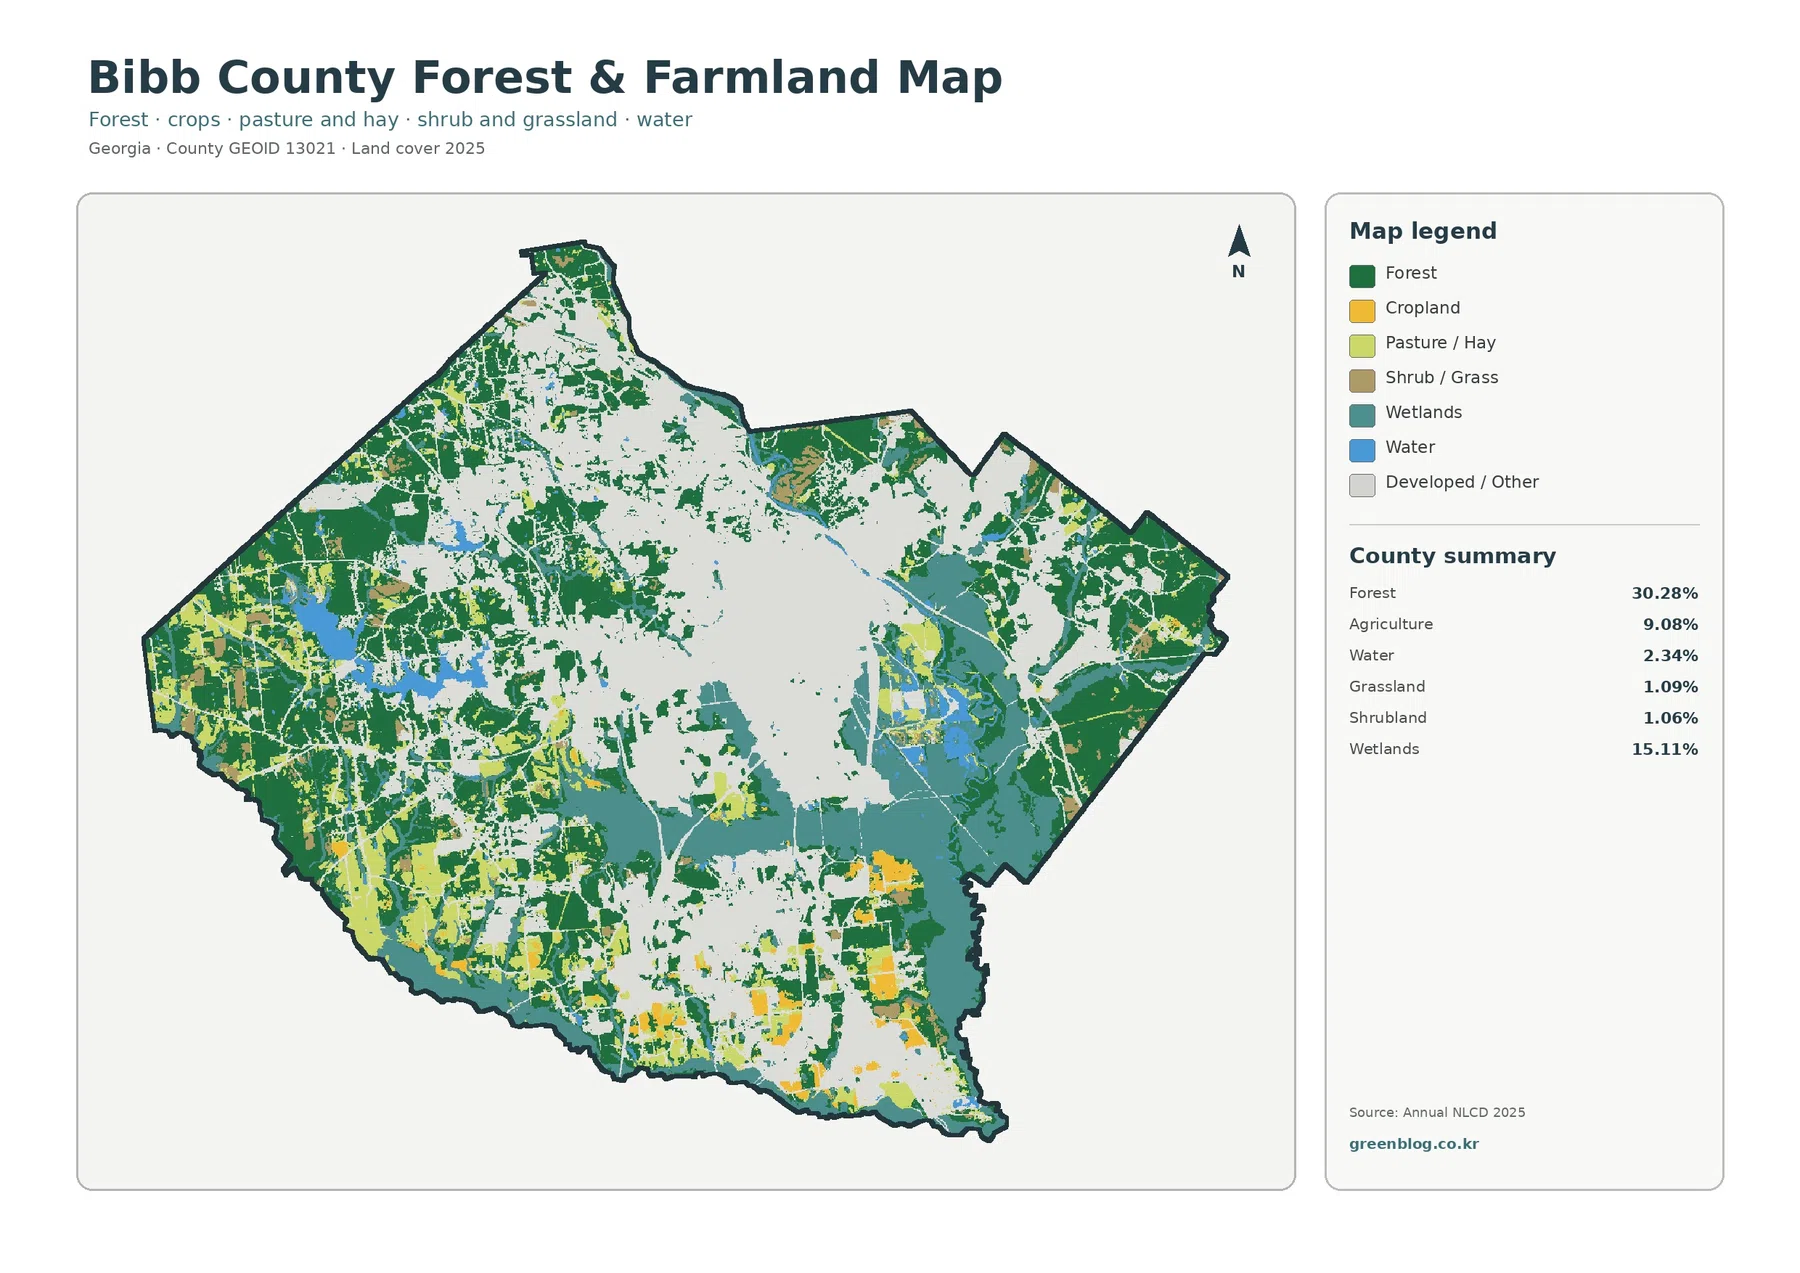
The forest-and-farmland view changes the visual balance dramatically because the urban footprint is pushed into the background. Forest becomes a strong feature on both sides of the county, and yellow farm areas are easier to follow through the southwest and south. Wetlands remain prominent in the east and southeast, while western water bodies stand out clearly against the simplified background.
The package provides a verified agriculture total of 9.08%, but it does not supply exact county percentages for cropland and pasture or hay separately. The legend can be used to compare their locations, not to create new subtype statistics by counting pixels. In Bibb County, the more useful observation is that agriculture survives mainly around the outer urban edge and is often fragmented by forest or development.
UGA Extension Bibb County provides agriculture and environmental education and maintains information about native plant gardens in the Macon area. Its local resources emphasize native vegetation, water conservation, and wildlife value in an urbanized county. That is useful environmental context for the green and open-space portions of the map, while the raster itself does not identify individual gardens, parks, or managed habitats.
The 1985–2025 endpoint comparison contains both development and broad “other” differences
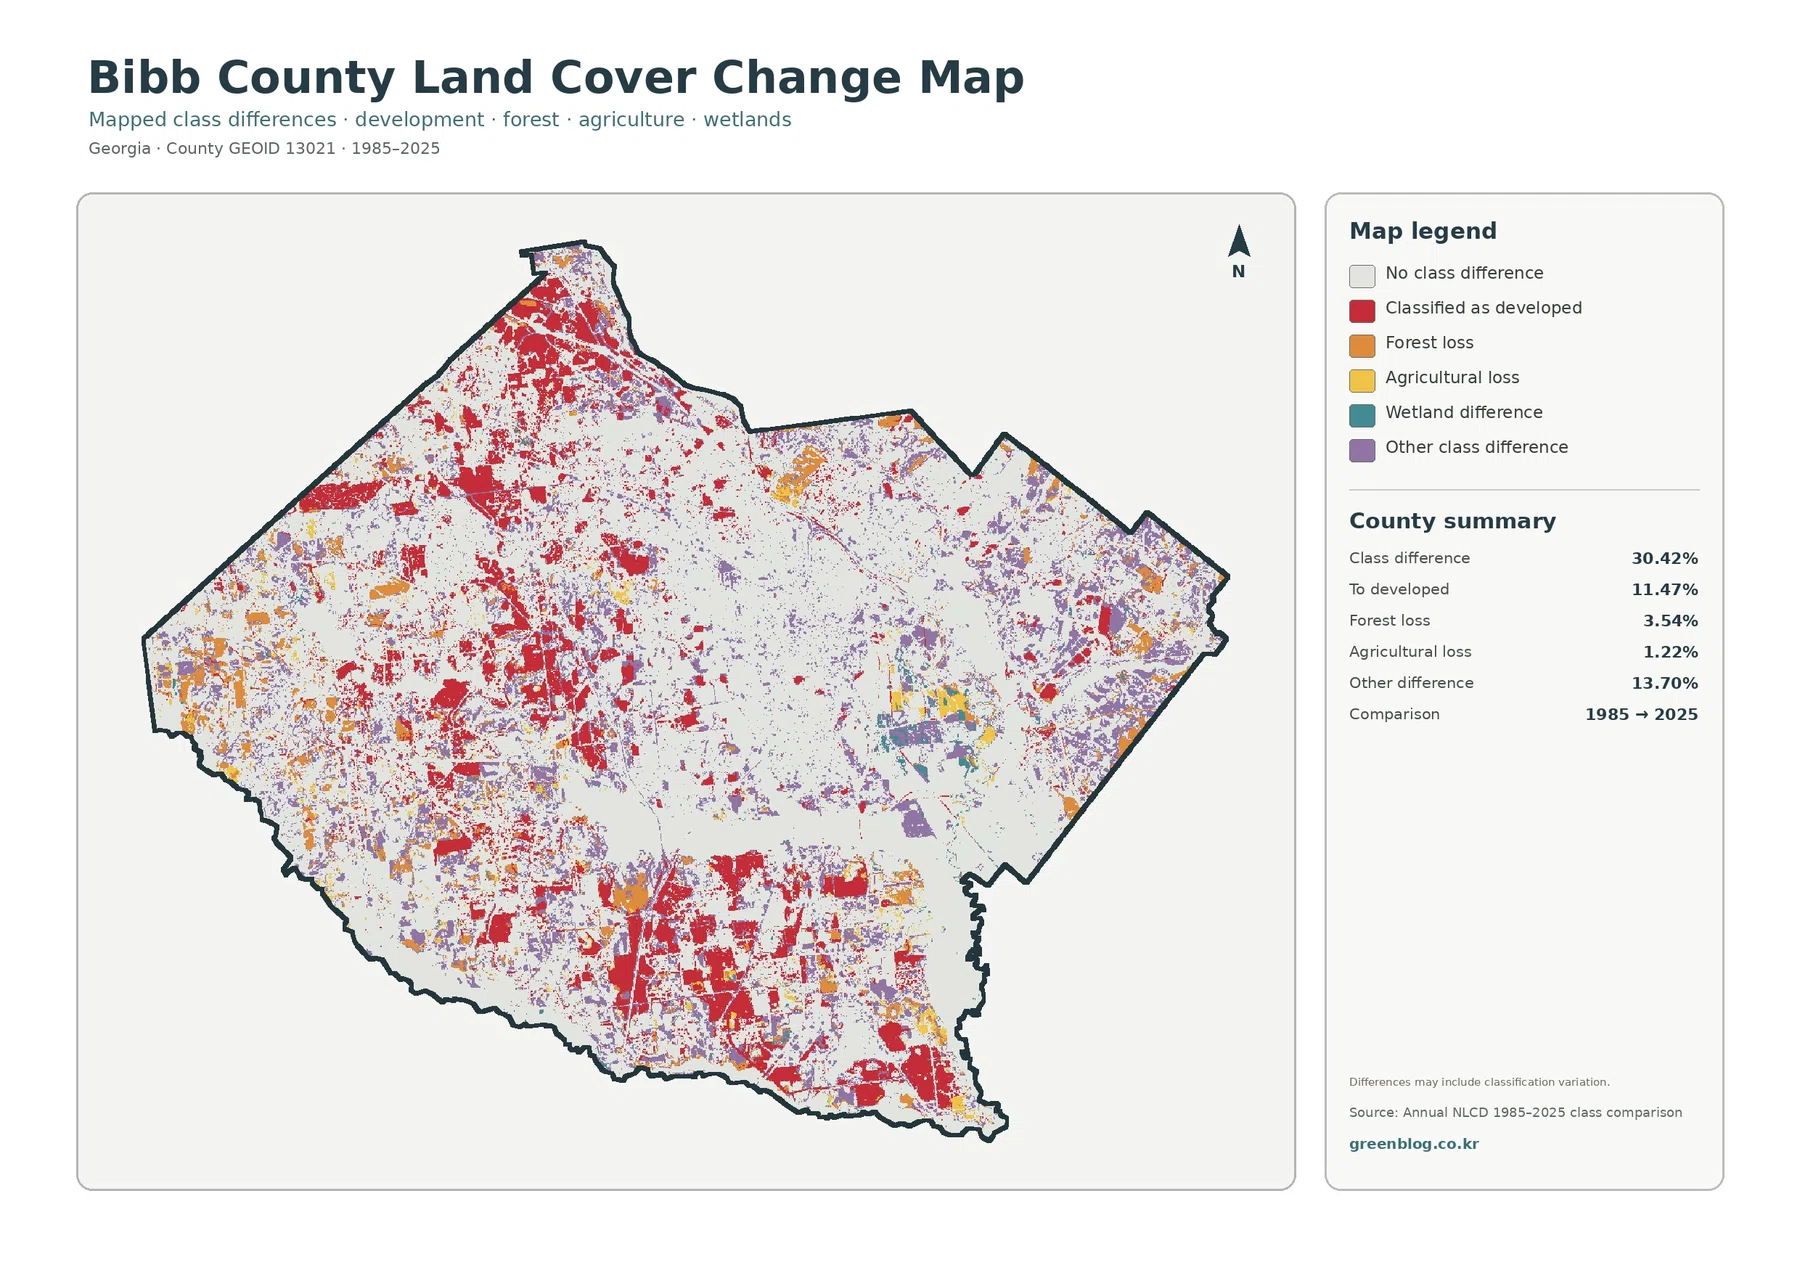
The total class difference between 1985 and 2025 is 30.42%. That number is not a direct measurement of the area physically converted from one land use to another. It is the share of raster cells assigned different cover classes at the two endpoints. Actual land change can contribute, but image conditions, season, mixed cells, and classification methods may also affect the result.
Cells classified as developed account for 11.47% of the comparison. Red difference areas are extensive in the north, west-central portion, and south, with smaller patches elsewhere. The current 40.15% developed share describes 2025 conditions, whereas the 11.47% value belongs to a two-date comparison. Combining them mathematically would not produce a valid earlier developed percentage.
Forest loss is 3.54%, agricultural loss 1.22%, and other class difference 13.70%. The purple other-difference category is slightly larger than the developed component and is widely distributed, especially through eastern and southern areas. Wetland difference is shown in the legend without its own verified county percentage, so an exact value should not be inferred from the colored pixels.
Color proximity is not proof of cause. A forest-loss cell beside a developed-difference cell does not establish that development caused the forest change. Intermediate aerial or satellite imagery, parcel history, or planning records would be needed to explain what happened at a particular location.
Three urban statistics describe different parts of the Macon-Bibb landscape
The 40.15% developed share tells us how much land is classified as developed in 2025. Mean impervious cover of 12.96% describes the average hard-surface fraction, and the 11.47% developed component belongs to the 1985–2025 endpoint comparison. All three relate to urbanization, but they measure current extent, current intensity, and class difference respectively.
This distinction is obvious in the central urban area. Red developed cover spans a very large area on the general map, whereas the darkest impervious colors concentrate in a smaller core and several connected corridors. Residential neighborhoods with trees, lawns, and open space can belong to the developed class while having far less hard surface than commercial or industrial areas.
Water and wetlands require a similar separation. Open water is 2.34%, but wetlands cover 15.11%. A reader who looks only at lakes and the visible river would underestimate the amount of wet ground and wetland vegetation, especially on the eastern and southeastern side of the county.
The maps work well for an urban-versus-natural-cover presentation
A useful presentation can begin with the 2025 overview because it places Macon’s large built footprint beside forest, the Ocmulgee corridor, western water, and outer-county farms. The impervious map is a logical second image when the question is how intensely different parts of the developed area are built.
If the subject is green space, rural land, or watershed context, the forest-and-farmland view is easier to read because development fades into the background. The change map belongs later, after the audience understands that its colors represent differences between 1985 and 2025 rather than current cover. Comprehensive-planning maps can complement this set, but future land-use policy and present land cover should not be treated as the same layer.
Raster land cover is not a zoning, municipal-boundary, or parcel map
Annual NLCD divides the ground into grid cells and assigns one representative cover class to each. A real urban cell can contain a house, pavement, lawn, trees, bare soil, and drainage features within a small area. Along the Ocmulgee River or at the outer edge of Macon, the real transition between surfaces can therefore be more detailed than the color boundary suggests.
A developed cell does not establish zoning or development rights, and forest or wetland colors do not identify ownership or regulatory status. Macon-Bibb Planning & Zoning Commission and current parcel records are the appropriate sources when the question concerns a specific property’s legal use, redevelopment status, or boundary.
The four source JPGs are each 2480×1754 pixels. Enlarging them can make smaller colored areas easier to inspect, but it cannot create detail beyond the underlying data. The package manifest does not flag the images as meeting its A3 high-resolution reference. They remain useful for screens, presentations, routine printing, and county comparisons, while large-format output should be checked at the intended print size.
Frequently Asked Questions
What is the largest 2025 land-cover class in Bibb County?
Developed land is largest at 40.15%, followed by forest at 30.28%, wetlands at 15.11%, agriculture at 9.08%, and water at 2.34%. The developed class is strongest through the center and north, while forest, farms, and wetlands become more prominent toward the outer county.
Why is developed land 40.15% while mean impervious cover is 12.96%?
Developed land can include lawns, trees, parks, soil, and other permeable surfaces around roads and buildings. Impervious cover isolates harder surfaces such as rooftops, pavement, and parking lots. The county area mapped at 50% or greater impervious cover is 9.19%, much smaller than the full developed class.
Does the 30.42% class difference equal the area that physically changed?
No. Instead, 30.42% is the portion of mapped cells whose assigned classes differ between the 1985 and 2025 endpoints. Supplied components include 11.47% classified as developed, 3.54% forest loss, 1.22% agricultural loss, and 13.70% other difference. Classification effects may be included, so a specific cause requires additional evidence.
Sources and Reference Data
- MRLC Annual NLCD Data – annual source data for Bibb County’s 2025 map and 1985–2025 endpoint comparison.
- USGS Annual NLCD Land Cover Classification – definitions for developed, forest, wetland, agricultural, and other cover classes.
- U.S. Census Bureau TIGER/Line Shapefiles – official county-boundary reference for Bibb County.
- UGA Extension Bibb County – Native Plant Gardens – county-specific native vegetation and environmental education resources.
- Macon-Bibb County Planning & Zoning Commission – official planning, zoning, and development context for Macon-Bibb County.
- USGS – Ocmulgee River at Macon – official monitoring-location information for the Ocmulgee River in Bibb County.
Map File Information
The ZIP contains four original JPG maps covering Bibb County's 2025 land cover, forest and farmland, impervious surface, and 1985–2025 class differences.
- Included Files: 4 original JPG land cover map files shown in this article
- File Type: JPG files in a ZIP archive
- Intended Use: Printing, education, presentations, and map-based projects
Related Maps
- Appling County Georgia Land Cover Map
- Atkinson County Georgia Land Cover Map
- Bacon County Georgia Land Cover Map
Green Map creates custom-edited map images using open geographic data sources such as geoBoundaries, Natural Earth, OpenStreetMap, and government open data.
These maps are edited visual materials, not raw data files, and are provided for education, documents, presentations, and graphic reference.