Mean years of schooling measures the accumulated educational attainment of the adult population rather than the schooling that today’s children may receive in the future. In the 2023 UNDP Human Development Report dataset, 193 countries and territories have a value for the average number of years of education received by people aged 25 and older. The range is wide: Niger records 1.41 years and Germany 14.30 years. The median is 9.93 years and the simple mean is 9.17. Because every observation in this cross-section refers to 2023, the comparison is not affected by a mixture of reporting years.
This indicator should not be confused with expected years of schooling. Expected years describes the educational path implied by current enrolment patterns for a child entering school. Mean years of schooling looks backward at the education already accumulated by adults. It therefore moves more slowly and carries the imprint of several generations. A recent expansion of secondary or tertiary education can be very important for young adults while still taking years to lift the average for everyone aged 25 and older.
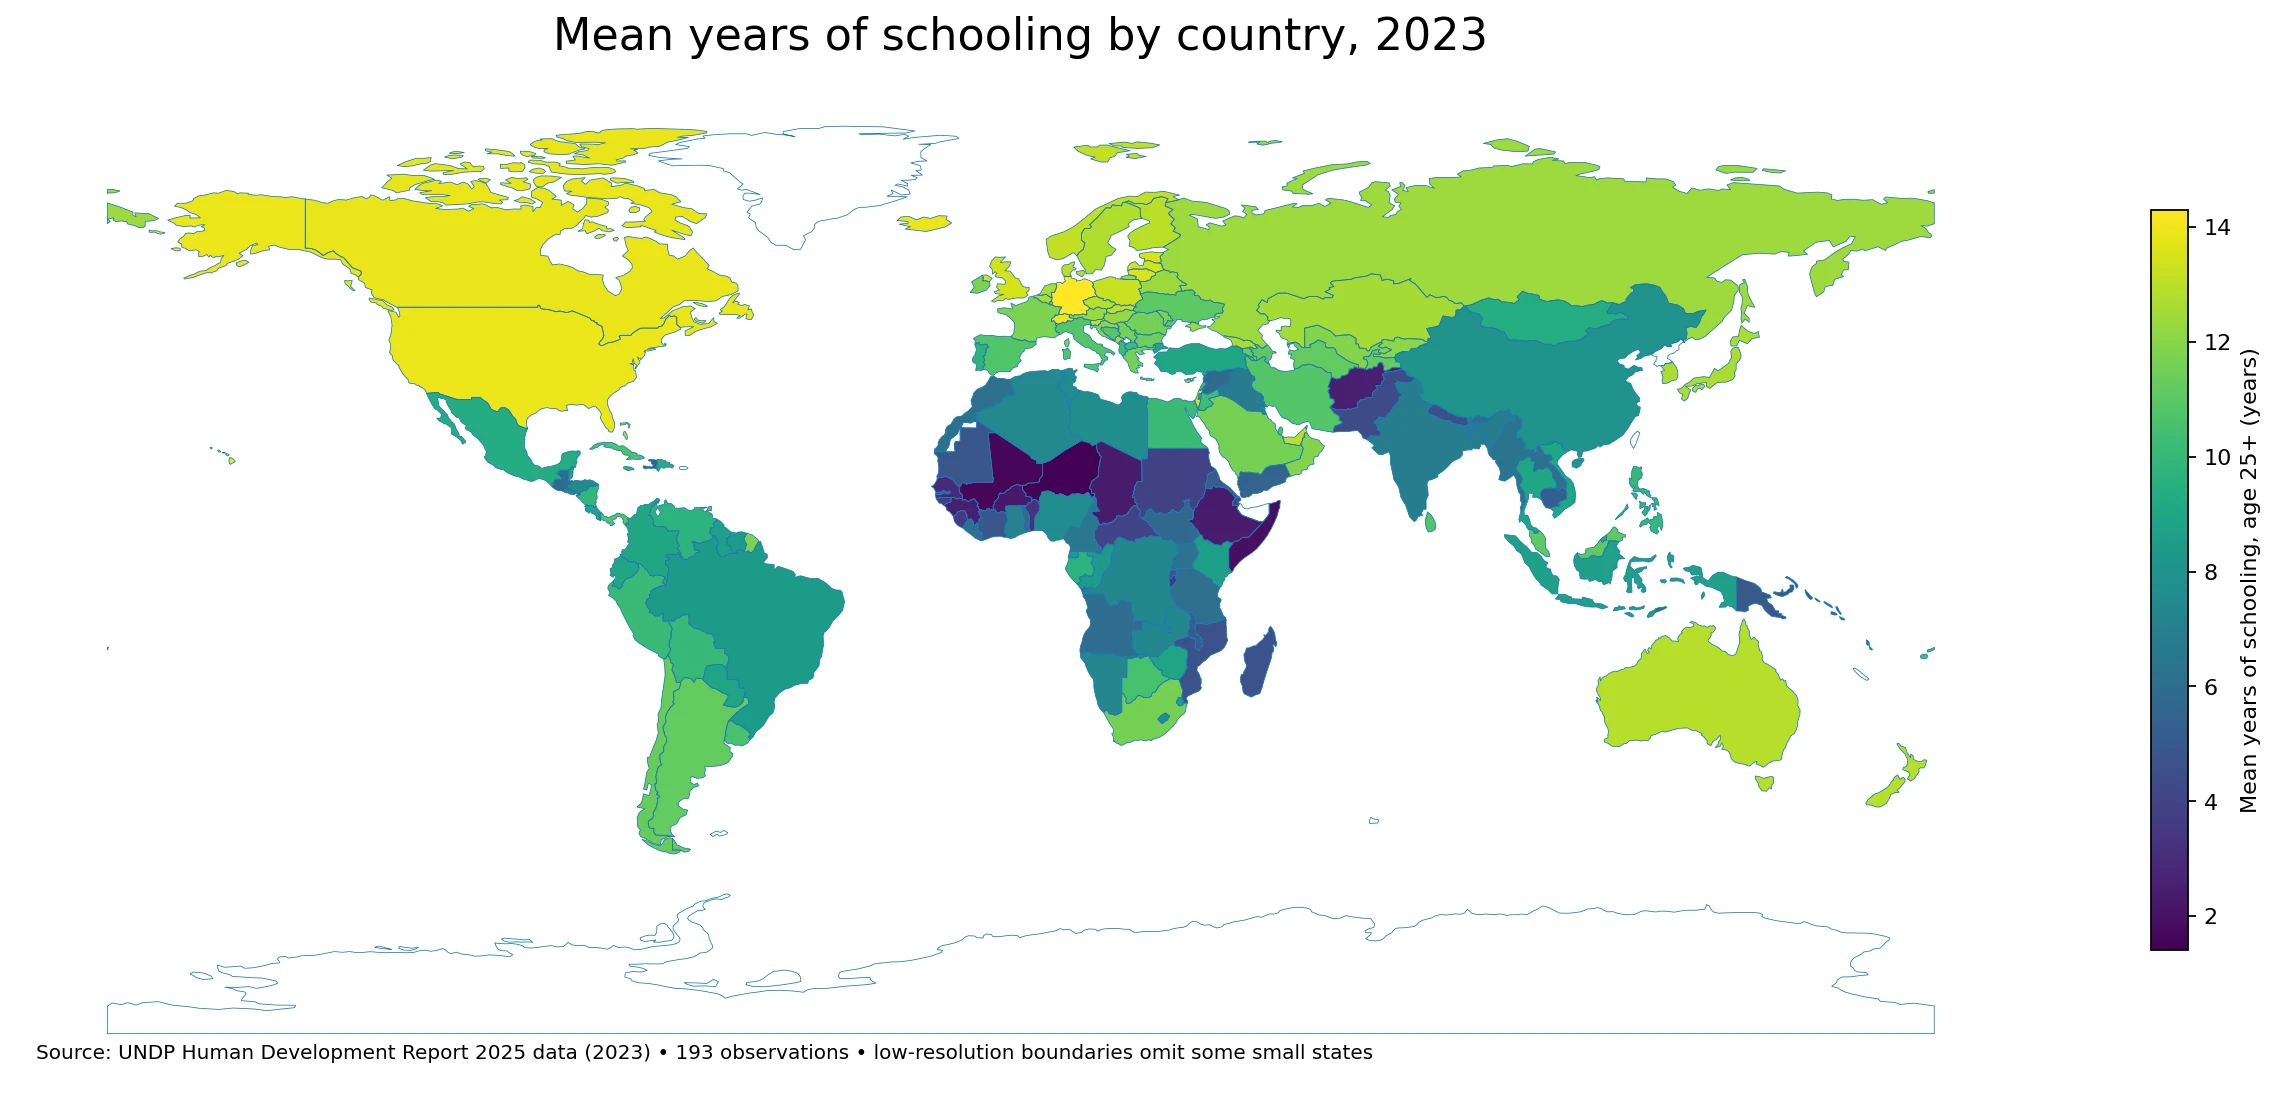
Table of Contents
What mean years of schooling actually measures
UNDP defines mean years of schooling as the average number of years of education received by people ages 25 and older, with educational attainment levels converted into years using the official duration of each level. That conversion matters because primary, secondary and tertiary structures are not identical across countries. Expressing attainment as years creates a common unit that can be compared internationally. Mean years of schooling is one of the two education indicators used in the Human Development Index.
The second HDI education indicator is expected years of schooling. The pair deliberately captures two time perspectives. Adult mean years reflects the stock of education accumulated through past participation and completion, while expected years is more sensitive to current enrolment among children and young people. A country can therefore have relatively modest adult attainment but much stronger current participation, or the reverse. Reading the two together is more informative than treating either as a complete picture of education.
The upper end clusters around 13 to 14 years
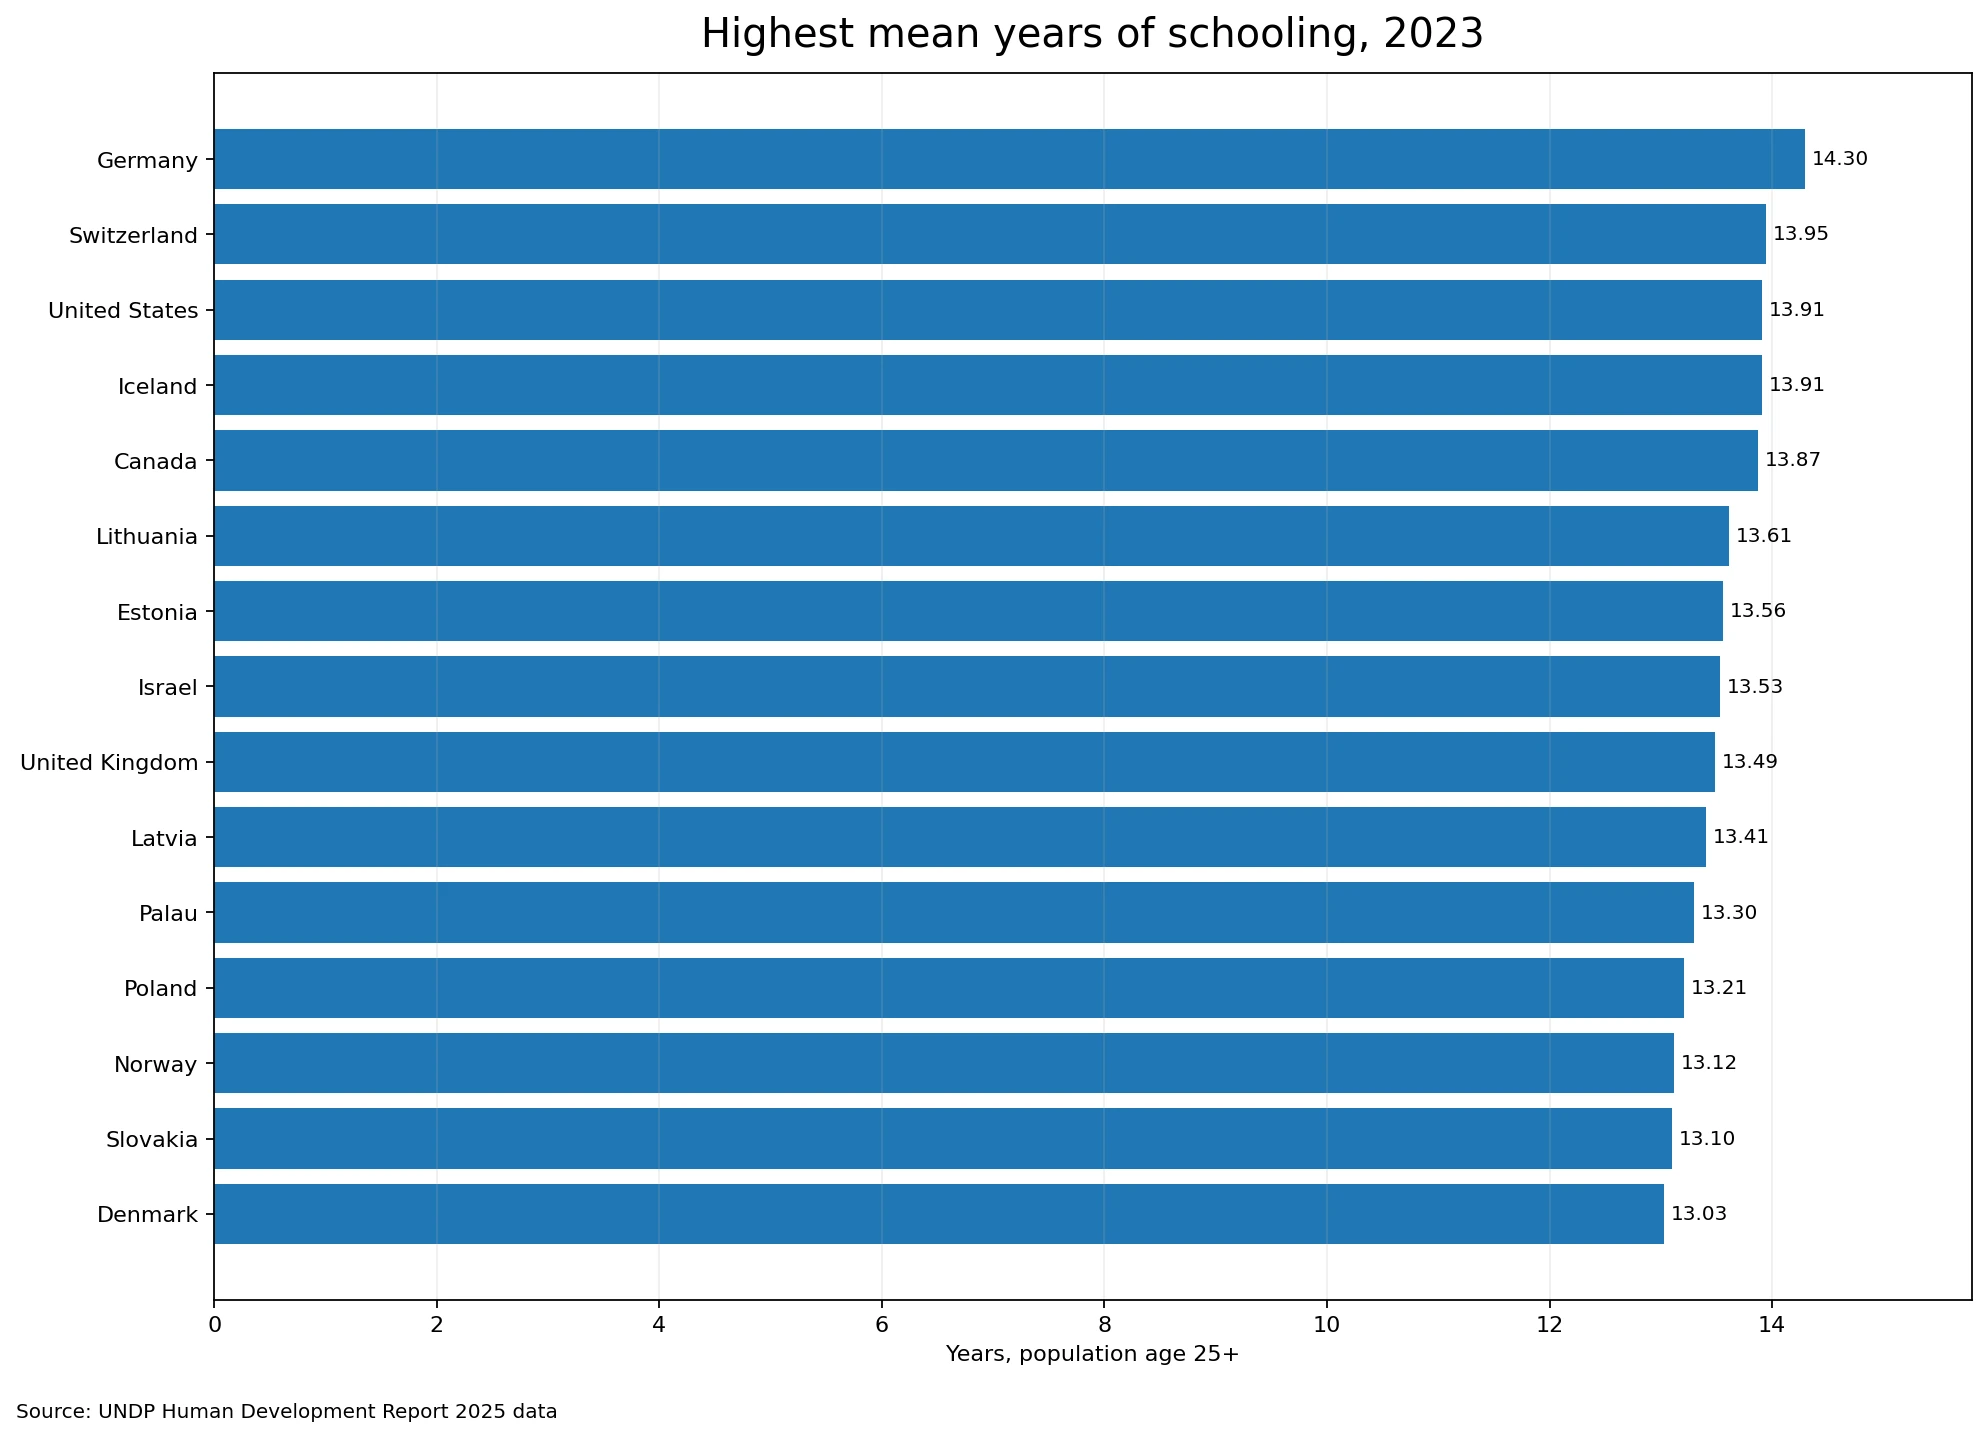
Germany has the highest 2023 value at 14.30 years. Switzerland follows at 13.95, the United States at 13.91, Iceland at 13.91 and Canada at 13.87. Lithuania reaches 13.61, Estonia 13.56, Israel 13.53, the United Kingdom 13.49 and Latvia 13.41. Fifteen of the 193 observations are at least 13 years, and forty-one are at least 12 years. Germany is the only observation above 14 years, so the top of the distribution is compressed compared with the much wider range seen across the full dataset.
A national mean of fourteen years does not mean that a typical individual literally spent fourteen uninterrupted years in school. The statistic averages people with many different attainment levels and ages. Younger cohorts may have completed university at high rates while older cohorts experienced shorter compulsory schooling or lower access to secondary education. The national figure combines those histories into one stock measure, which is why long-run educational development is central to its interpretation.
Sixteen observations remain below four years
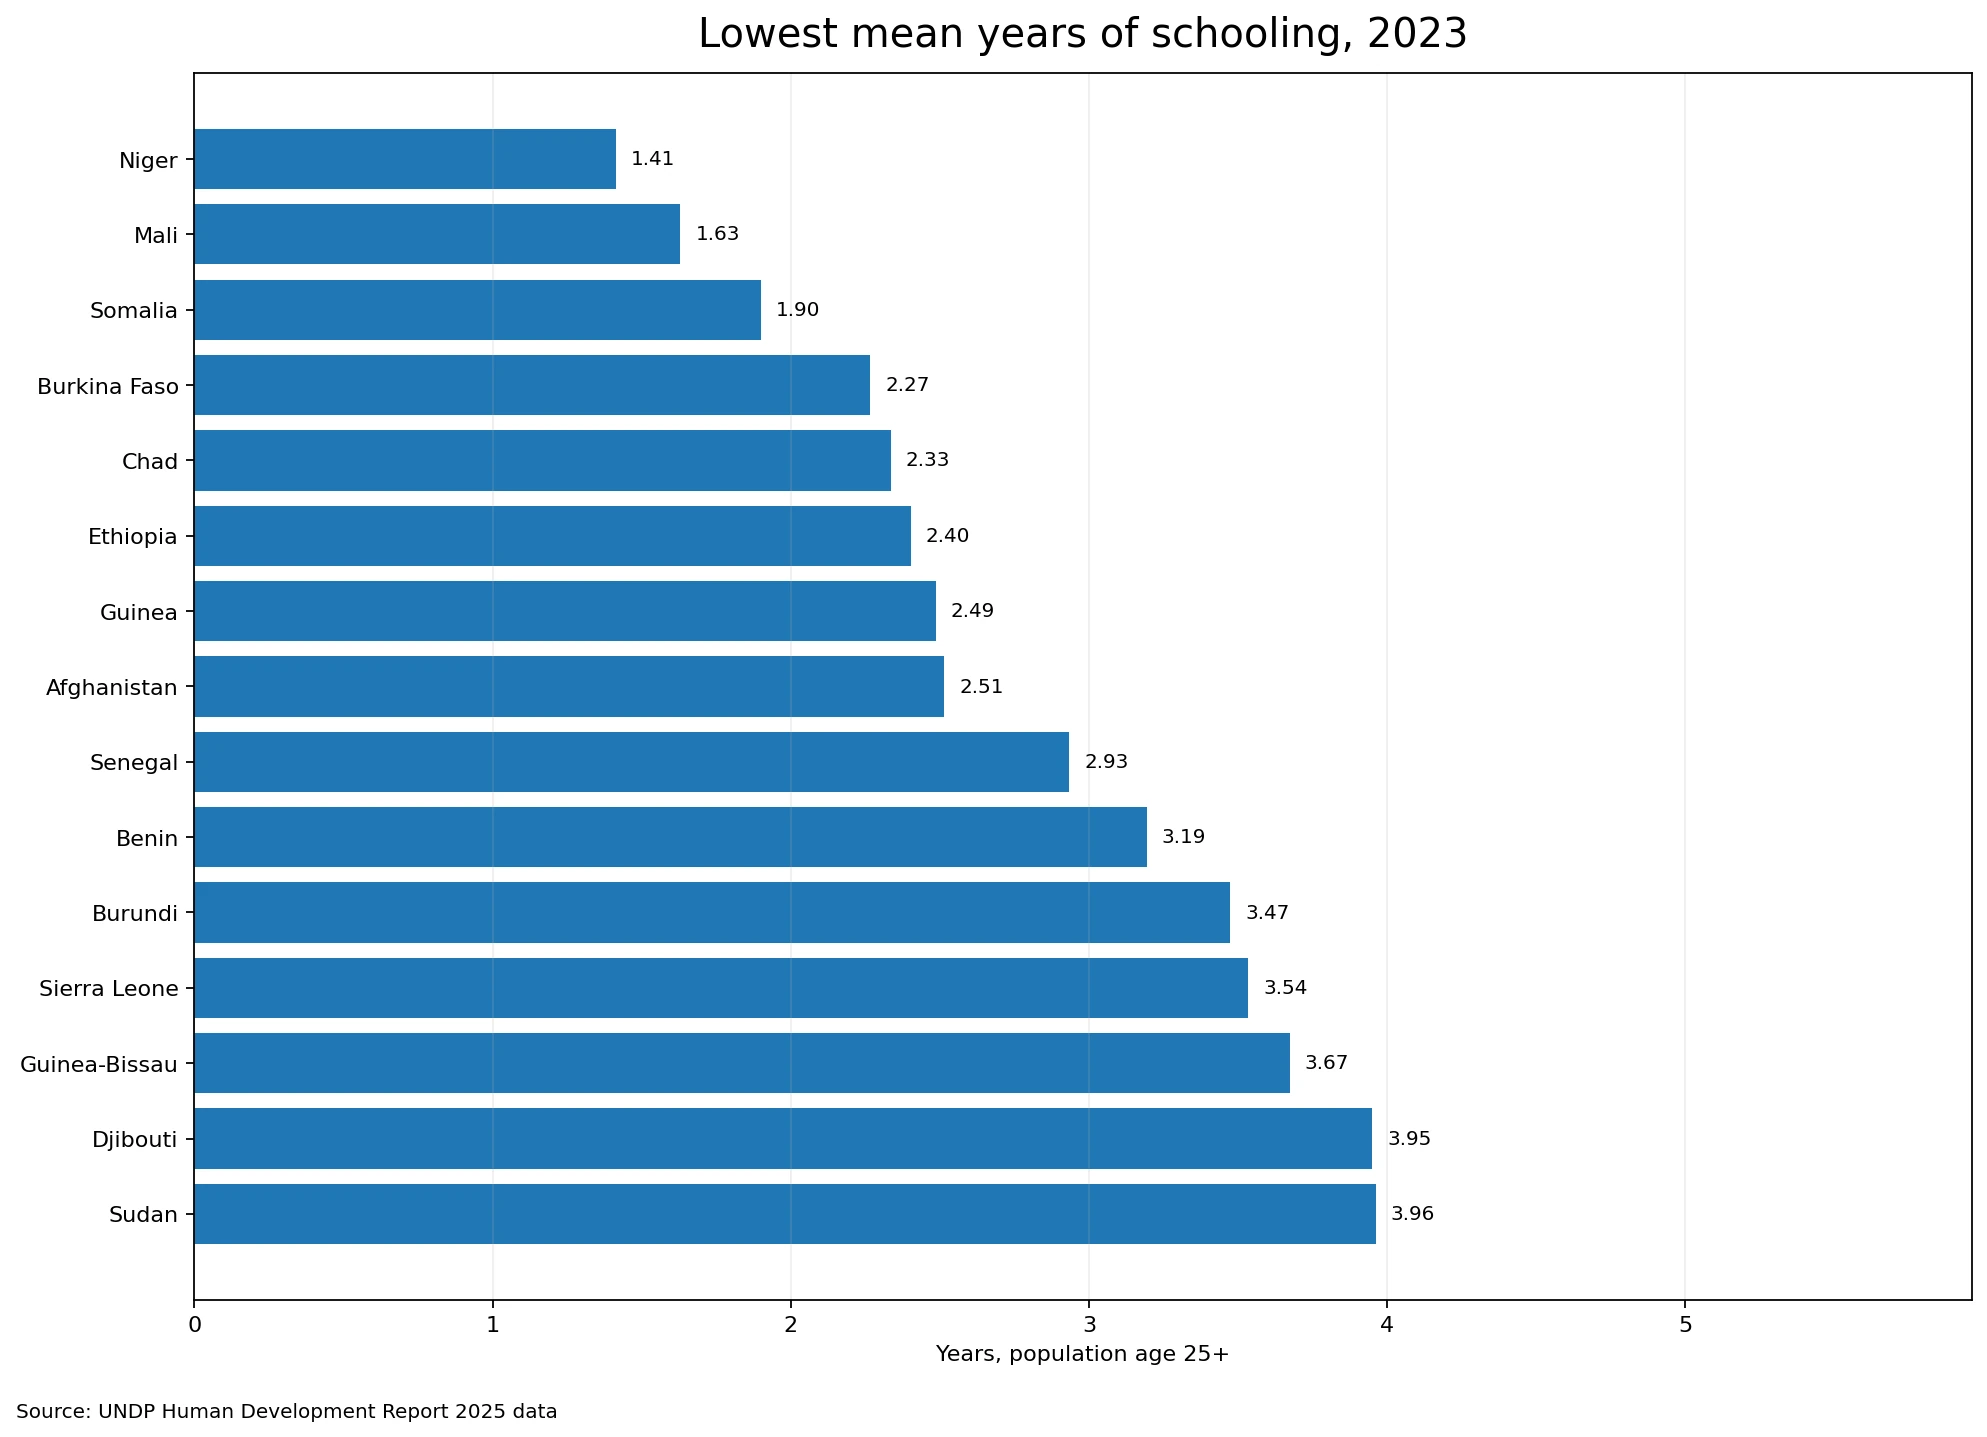
At the lower end, Niger records 1.41 years, followed by Mali at 1.63 and Somalia at 1.90. Burkina Faso is at 2.27, Chad 2.33, Ethiopia 2.40, Guinea 2.49, Afghanistan 2.51 and Senegal 2.93. Sixteen observations are below four years, thirty-eight are below six, and sixty-six are below eight. Many of the lowest values are found in Sub-Saharan Africa, a regional pattern that is clear on the map, but the indicator itself does not identify the causes behind that pattern.
Adult attainment can reflect decades of different conditions: school availability in earlier periods, historical education policy, household resources, conflict or displacement, gender and regional gaps, and the age structure of the population. Those mechanisms cannot be separated with one country average. The indicator tells us the accumulated outcome in years; explaining why a country is low or high requires age-specific attainment, enrolment, completion and country-level institutional evidence.
The centre of the distribution sits around ten years
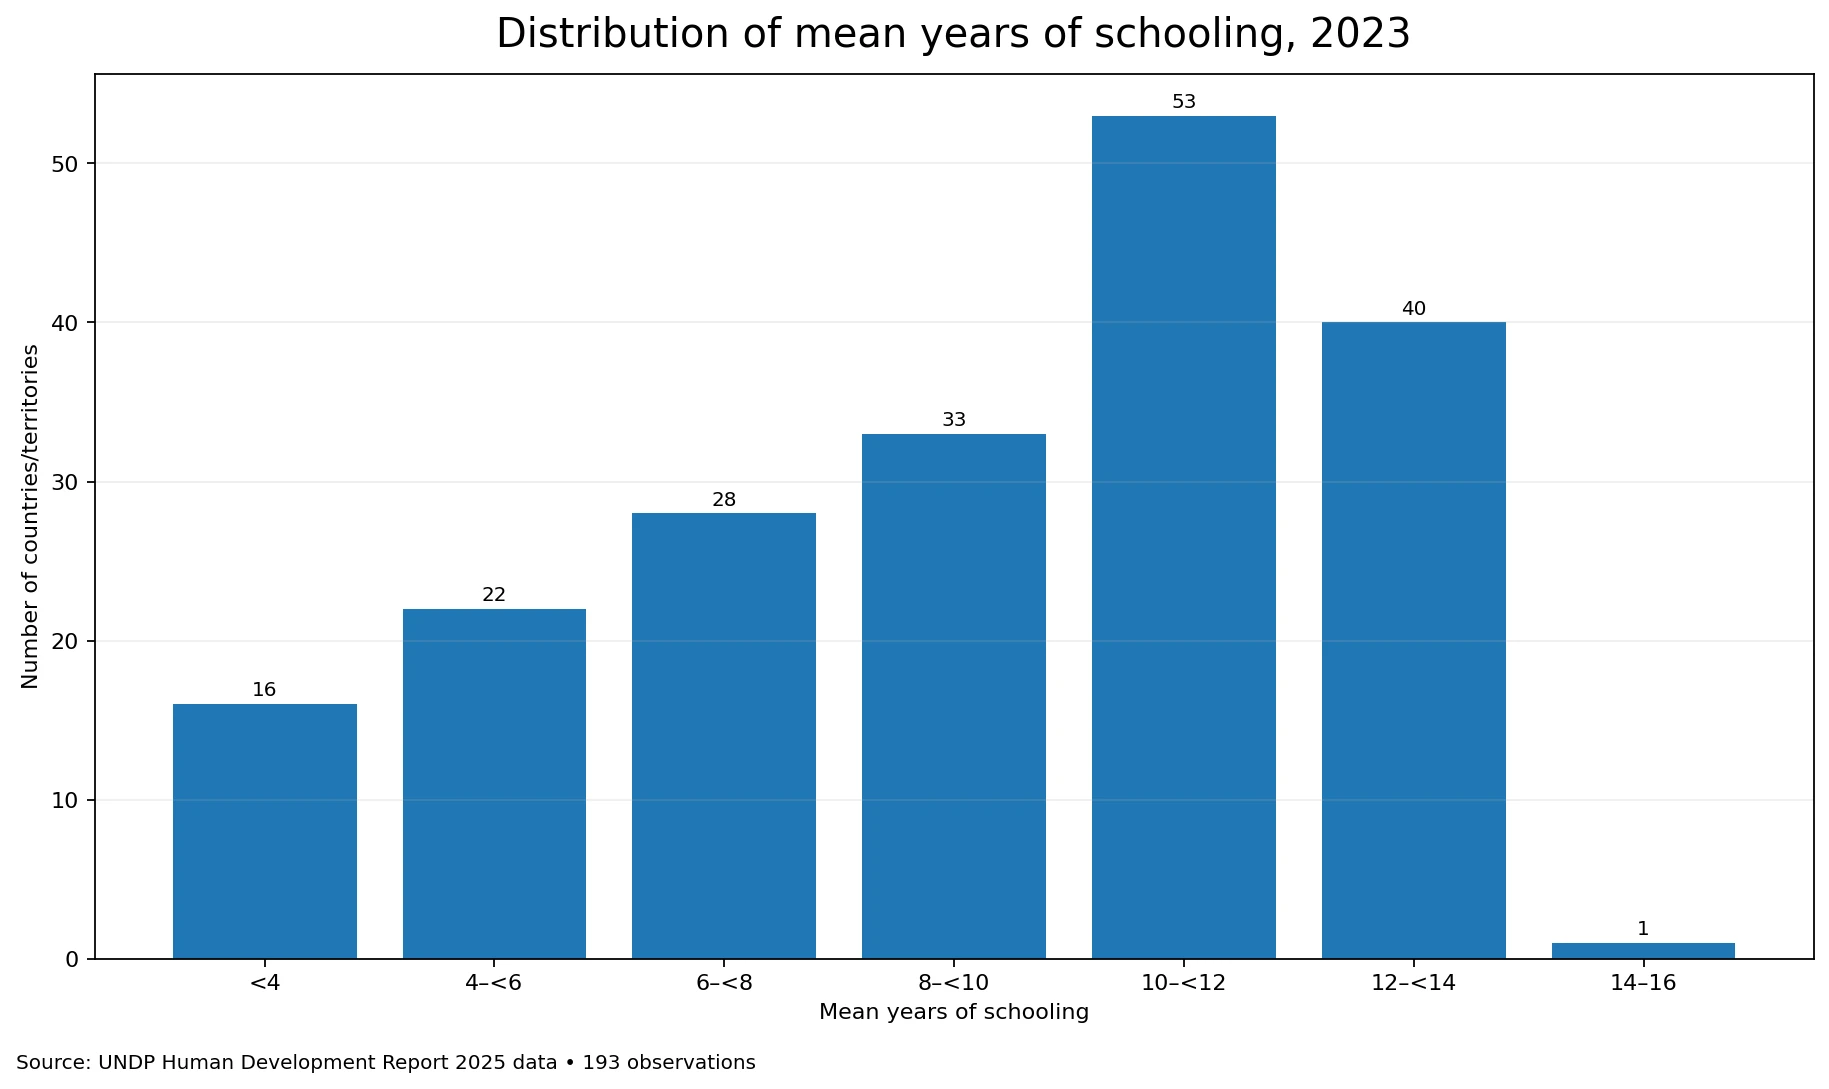
The grouped distribution shows how broad the middle is. Sixteen observations are below 4 years, twenty-two are from 4 to under 6, twenty-eight from 6 to under 8, thirty-three from 8 to under 10, fifty-three from 10 to under 12, forty from 12 to under 14 and one from 14 to under 16. The 10-to-under-12 band is the largest. Ninety-four observations are at least 10 years, while ninety-nine are below 10, which is consistent with the median of 9.93 years sitting almost exactly at that divide.
The first quartile is about 6.78 years and the third quartile 11.64, so the middle half of all observations spans roughly 4.86 years. The mean of 9.17 is lower than the 9.93 median because very low values in the one-to-four-year range pull the arithmetic mean downward. For this reason, the median and the distribution bands give useful context that a single global average cannot provide.
Large economies occupy very different parts of the range
Selected countries illustrate the scale of the differences. The United States is at 13.91 years, Canada 13.87, Australia 12.87, Japan 12.68, France 11.77, Italy 10.83 and Spain 10.76. Mexico records 9.35, Brazil 8.43, China 8.04 and India 6.88. The Republic of Korea is at 12.72 years and ranks 25th among the 193 observations. These examples are useful for locating countries within the broad distribution, not for turning small decimal differences into a definitive hierarchy of education systems.
Cohort composition is especially important. A country where younger adults are much more educated than older adults may still have a moderate overall mean because everyone aged 25 and above is included. The pace at which the national average rises therefore depends not only on today’s education system but also on demographic turnover. When the question is about recent reform or present access, age-specific attainment and current enrolment indicators are generally more responsive than this stock measure.
The 15-year HDI goalpost is a normalization rule
For the HDI calculation, UNDP uses 0 years as the minimum and 15 years as the maximum goalpost for mean years of schooling. The 2025 technical note describes 15 years as the projected maximum of this indicator for 2025. This is not a legal or biological ceiling on education and it does not mean the published country series must stop at 15. It is a normalization benchmark used to transform the indicator into a dimension index between the HDI goalposts.
The highest observation in this 2023 dataset, 14.30 years, remains below that 15-year goalpost. Even so, the methodological distinction is important: the raw series answers “how many years of education have adults received on average?”, while the HDI education index answers a different question after normalizing mean years and expected years of schooling. The two should not be quoted as if they were the same metric.
What the indicator cannot tell you
Mean years of schooling measures duration, not learning quality. Two countries with an adult mean of twelve years can have different literacy, numeracy, curriculum quality, school resources, labour-market outcomes and completion patterns. The national average also hides inequalities by sex, income, region, urban or rural residence and generation. A high mean should therefore not be treated as a complete score for an education system, and a low mean does not by itself identify which barrier matters most.
Close rankings deserve caution as well. Several observations differ by only a few hundredths or tenths of a year. International series depend on harmonizing national attainment information and, for some countries, estimation procedures. Broad gaps—such as two years versus eight years or eleven years versus fourteen—are far more informative than a change of one or two positions among countries with nearly identical values.
Official source and comparison method
The 2023 values come from the UNDP Human Development Report 2025 composite-indicator time series. UNDP’s technical documentation lists Barro and Lee, Eurostat, ICF Demographic and Health Surveys, the UNESCO Institute for Statistics and UNICEF Multiple Indicator Cluster Surveys among the sources used for mean years of schooling. Definitions, downloads and methodology are available from the UNDP Human Development Reports documentation page and the 2025 HDR technical notes.
The table below sorts all 193 observations using the unrounded source value and displays the result to two decimal places. The featured map uses a low-resolution world boundary layer and can therefore omit visible polygons for very small states such as Andorra, Singapore or the Maldives. Their values are still retained in the full table, which is the complete reference for all observations in the dataset.
All 193 country and territory observations for 2023
| Rank | Country or territory | Year | Mean years of schooling |
|---|---|---|---|
| 1 | Germany | 2023 | 14.30 |
| 2 | Switzerland | 2023 | 13.95 |
| 3 | United States | 2023 | 13.91 |
| 4 | Iceland | 2023 | 13.91 |
| 5 | Canada | 2023 | 13.87 |
| 6 | Lithuania | 2023 | 13.61 |
| 7 | Estonia | 2023 | 13.56 |
| 8 | Israel | 2023 | 13.53 |
| 9 | United Kingdom | 2023 | 13.49 |
| 10 | Latvia | 2023 | 13.41 |
| 11 | Palau | 2023 | 13.30 |
| 12 | Poland | 2023 | 13.21 |
| 13 | Norway | 2023 | 13.12 |
| 14 | Slovakia | 2023 | 13.10 |
| 15 | Denmark | 2023 | 13.03 |
| 16 | United Arab Emirates | 2023 | 12.99 |
| 17 | Finland | 2023 | 12.98 |
| 18 | Czechia | 2023 | 12.96 |
| 19 | Slovenia | 2023 | 12.95 |
| 20 | New Zealand | 2023 | 12.88 |
| 21 | Australia | 2023 | 12.87 |
| 22 | Bahamas | 2023 | 12.81 |
| 23 | Montenegro | 2023 | 12.77 |
| 24 | Sweden | 2023 | 12.74 |
| 25 | Korea (Republic of) | 2023 | 12.72 |
| 26 | Georgia | 2023 | 12.70 |
| 27 | Belgium | 2023 | 12.69 |
| 28 | Japan | 2023 | 12.68 |
| 29 | Netherlands | 2023 | 12.67 |
| 30 | Luxembourg | 2023 | 12.59 |
| 31 | Cyprus | 2023 | 12.56 |
| 32 | Kazakhstan | 2023 | 12.55 |
| 33 | Malta | 2023 | 12.42 |
| 34 | Russian Federation | 2023 | 12.41 |
| 35 | Liechtenstein | 2023 | 12.41 |
| 36 | Austria | 2023 | 12.36 |
| 37 | Hong Kong, China (SAR) | 2023 | 12.35 |
| 38 | Belarus | 2023 | 12.34 |
| 39 | Hungary | 2023 | 12.33 |
| 40 | Croatia | 2023 | 12.10 |
| 41 | Kyrgyzstan | 2023 | 12.07 |
| 42 | Singapore | 2023 | 11.99 |
| 43 | Uzbekistan | 2023 | 11.91 |
| 44 | Oman | 2023 | 11.89 |
| 45 | Moldova (Republic of) | 2023 | 11.83 |
| 46 | France | 2023 | 11.77 |
| 47 | Ireland | 2023 | 11.72 |
| 48 | Antigua and Barbuda | 2023 | 11.65 |
| 49 | Serbia | 2023 | 11.64 |
| 50 | Marshall Islands | 2023 | 11.64 |
| 51 | South Africa | 2023 | 11.61 |
| 52 | Andorra | 2023 | 11.61 |
| 53 | Saudi Arabia | 2023 | 11.61 |
| 54 | Greece | 2023 | 11.55 |
| 55 | Romania | 2023 | 11.55 |
| 56 | Bulgaria | 2023 | 11.45 |
| 57 | San Marino | 2023 | 11.36 |
| 58 | Armenia | 2023 | 11.34 |
| 59 | Samoa | 2023 | 11.33 |
| 60 | Saint Vincent and the Grenadines | 2023 | 11.30 |
| 61 | Chile | 2023 | 11.29 |
| 62 | Tajikistan | 2023 | 11.27 |
| 63 | Turkmenistan | 2023 | 11.21 |
| 64 | Seychelles | 2023 | 11.20 |
| 65 | Argentina | 2023 | 11.18 |
| 66 | Bahrain | 2023 | 11.13 |
| 67 | Ukraine | 2023 | 11.12 |
| 68 | Malaysia | 2023 | 11.09 |
| 69 | Azerbaijan | 2023 | 11.07 |
| 70 | Bosnia and Herzegovina | 2023 | 10.97 |
| 71 | Tonga | 2023 | 10.91 |
| 72 | Saint Kitts and Nevis | 2023 | 10.85 |
| 73 | Iran (Islamic Republic of) | 2023 | 10.85 |
| 74 | Panama | 2023 | 10.83 |
| 75 | Italy | 2023 | 10.83 |
| 76 | Trinidad and Tobago | 2023 | 10.79 |
| 77 | Qatar | 2023 | 10.77 |
| 78 | Sri Lanka | 2023 | 10.77 |
| 79 | Tuvalu | 2023 | 10.77 |
| 80 | Spain | 2023 | 10.76 |
| 81 | Cuba | 2023 | 10.63 |
| 82 | Uruguay | 2023 | 10.54 |
| 83 | Botswana | 2023 | 10.48 |
| 84 | Fiji | 2023 | 10.37 |
| 85 | Lebanon | 2023 | 10.37 |
| 86 | Jordan | 2023 | 10.24 |
| 87 | North Macedonia | 2023 | 10.23 |
| 88 | Albania | 2023 | 10.18 |
| 89 | Peru | 2023 | 10.15 |
| 90 | Egypt | 2023 | 10.14 |
| 91 | Palestine, State of | 2023 | 10.13 |
| 92 | Dominica | 2023 | 10.13 |
| 93 | Mauritius | 2023 | 10.10 |
| 94 | Bolivia (Plurinational State of) | 2023 | 10.02 |
| 95 | Philippines | 2023 | 9.98 |
| 96 | Jamaica | 2023 | 9.96 |
| 97 | Nicaragua | 2023 | 9.93 |
| 98 | Barbados | 2023 | 9.93 |
| 99 | Portugal | 2023 | 9.70 |
| 100 | Gabon | 2023 | 9.69 |
| 101 | Venezuela (Bolivarian Republic of) | 2023 | 9.68 |
| 102 | Nauru | 2023 | 9.45 |
| 103 | Grenada | 2023 | 9.45 |
| 104 | Dominican Republic | 2023 | 9.44 |
| 105 | Mongolia | 2023 | 9.42 |
| 106 | Mexico | 2023 | 9.35 |
| 107 | Brunei Darussalam | 2023 | 9.28 |
| 108 | Kiribati | 2023 | 9.13 |
| 109 | Thailand | 2023 | 9.04 |
| 110 | Colombia | 2023 | 9.03 |
| 111 | Türkiye | 2023 | 8.99 |
| 112 | Viet Nam | 2023 | 8.98 |
| 113 | Ecuador | 2023 | 8.97 |
| 114 | Zimbabwe | 2023 | 8.93 |
| 115 | Paraguay | 2023 | 8.93 |
| 116 | Costa Rica | 2023 | 8.84 |
| 117 | Belize | 2023 | 8.76 |
| 118 | Guyana | 2023 | 8.70 |
| 119 | Indonesia | 2023 | 8.70 |
| 120 | Eswatini (Kingdom of) | 2023 | 8.69 |
| 121 | Kenya | 2023 | 8.62 |
| 122 | Saint Lucia | 2023 | 8.61 |
| 123 | Suriname | 2023 | 8.43 |
| 124 | Brazil | 2023 | 8.43 |
| 125 | Congo | 2023 | 8.32 |
| 126 | Equatorial Guinea | 2023 | 8.28 |
| 127 | China | 2023 | 8.04 |
| 128 | Libya | 2023 | 7.78 |
| 129 | Lesotho | 2023 | 7.73 |
| 130 | Tunisia | 2023 | 7.59 |
| 131 | Nigeria | 2023 | 7.59 |
| 132 | Kuwait | 2023 | 7.57 |
| 133 | Honduras | 2023 | 7.51 |
| 134 | Algeria | 2023 | 7.42 |
| 135 | Maldives | 2023 | 7.41 |
| 136 | Zambia | 2023 | 7.40 |
| 137 | Congo (Democratic Republic of the) | 2023 | 7.38 |
| 138 | Micronesia (Federated States of) | 2023 | 7.33 |
| 139 | El Salvador | 2023 | 7.30 |
| 140 | Namibia | 2023 | 7.27 |
| 141 | Vanuatu | 2023 | 7.18 |
| 142 | Ghana | 2023 | 7.11 |
| 143 | India | 2023 | 6.88 |
| 144 | Bangladesh | 2023 | 6.79 |
| 145 | Iraq | 2023 | 6.78 |
| 146 | Cameroon | 2023 | 6.57 |
| 147 | Myanmar | 2023 | 6.38 |
| 148 | Uganda | 2023 | 6.32 |
| 149 | Timor-Leste | 2023 | 6.23 |
| 150 | Morocco | 2023 | 6.20 |
| 151 | Liberia | 2023 | 6.17 |
| 152 | Cabo Verde | 2023 | 6.09 |
| 153 | Tanzania (United Republic of) | 2023 | 6.07 |
| 154 | Lao People's Democratic Republic | 2023 | 6.06 |
| 155 | Comoros | 2023 | 6.01 |
| 156 | Sao Tome and Principe | 2023 | 5.99 |
| 157 | Angola | 2023 | 5.96 |
| 158 | Syrian Arab Republic | 2023 | 5.94 |
| 159 | Solomon Islands | 2023 | 5.88 |
| 160 | Togo | 2023 | 5.86 |
| 161 | Guatemala | 2023 | 5.85 |
| 162 | Bhutan | 2023 | 5.84 |
| 163 | South Sudan | 2023 | 5.73 |
| 164 | Yemen | 2023 | 5.48 |
| 165 | Haiti | 2023 | 5.38 |
| 166 | Malawi | 2023 | 5.24 |
| 167 | Cambodia | 2023 | 5.20 |
| 168 | Eritrea | 2023 | 5.09 |
| 169 | Papua New Guinea | 2023 | 4.96 |
| 170 | Rwanda | 2023 | 4.88 |
| 171 | Côte d'Ivoire | 2023 | 4.87 |
| 172 | Mauritania | 2023 | 4.85 |
| 173 | Gambia | 2023 | 4.67 |
| 174 | Madagascar | 2023 | 4.59 |
| 175 | Mozambique | 2023 | 4.59 |
| 176 | Nepal | 2023 | 4.50 |
| 177 | Pakistan | 2023 | 4.32 |
| 178 | Central African Republic | 2023 | 3.99 |
| 179 | Sudan | 2023 | 3.96 |
| 180 | Djibouti | 2023 | 3.95 |
| 181 | Guinea-Bissau | 2023 | 3.67 |
| 182 | Sierra Leone | 2023 | 3.54 |
| 183 | Burundi | 2023 | 3.47 |
| 184 | Benin | 2023 | 3.19 |
| 185 | Senegal | 2023 | 2.93 |
| 186 | Afghanistan | 2023 | 2.51 |
| 187 | Guinea | 2023 | 2.49 |
| 188 | Ethiopia | 2023 | 2.40 |
| 189 | Chad | 2023 | 2.33 |
| 190 | Burkina Faso | 2023 | 2.27 |
| 191 | Somalia | 2023 | 1.90 |
| 192 | Mali | 2023 | 1.63 |
| 193 | Niger | 2023 | 1.41 |
How to read the 2023 pattern
The main feature of the 2023 distribution is the size of the accumulated gap. The median country or territory is just under ten years, the middle half lies between roughly 6.8 and 11.6 years, the highest values reach the 13-to-14-year range, and the lowest are near one to three years. These differences summarize the education already accumulated by today’s adult population. They are valuable for long-run human-development comparisons, but current opportunity and education quality require other measures, especially expected years of schooling, enrolment, completion, learning outcomes and disaggregated attainment.
Frequently Asked Questions
What does mean years of schooling measure?
It measures the average number of years of education received by people aged 25 and older, converting attainment levels using the official duration of each level.
Is mean years of schooling the same as expected years of schooling?
No. Mean years reflects education already accumulated by adults, while expected years describes the schooling implied by current enrolment patterns for a child entering school.
Which economy has the highest 2023 mean years of schooling?
Germany has the highest value in this 193-observation dataset at 14.30 years, followed by Switzerland, the United States, Iceland and Canada.
Is the 15-year HDI goalpost a maximum possible education duration?
No. It is the upper benchmark UNDP uses when normalizing mean years of schooling for the HDI education dimension.
Related Articles
Green Map creates custom-edited map images using open geographic data sources such as geoBoundaries, Natural Earth, OpenStreetMap, and government open data. These maps are edited visual materials, not raw data files, and are provided for education, documents, presentations, and graphic reference.