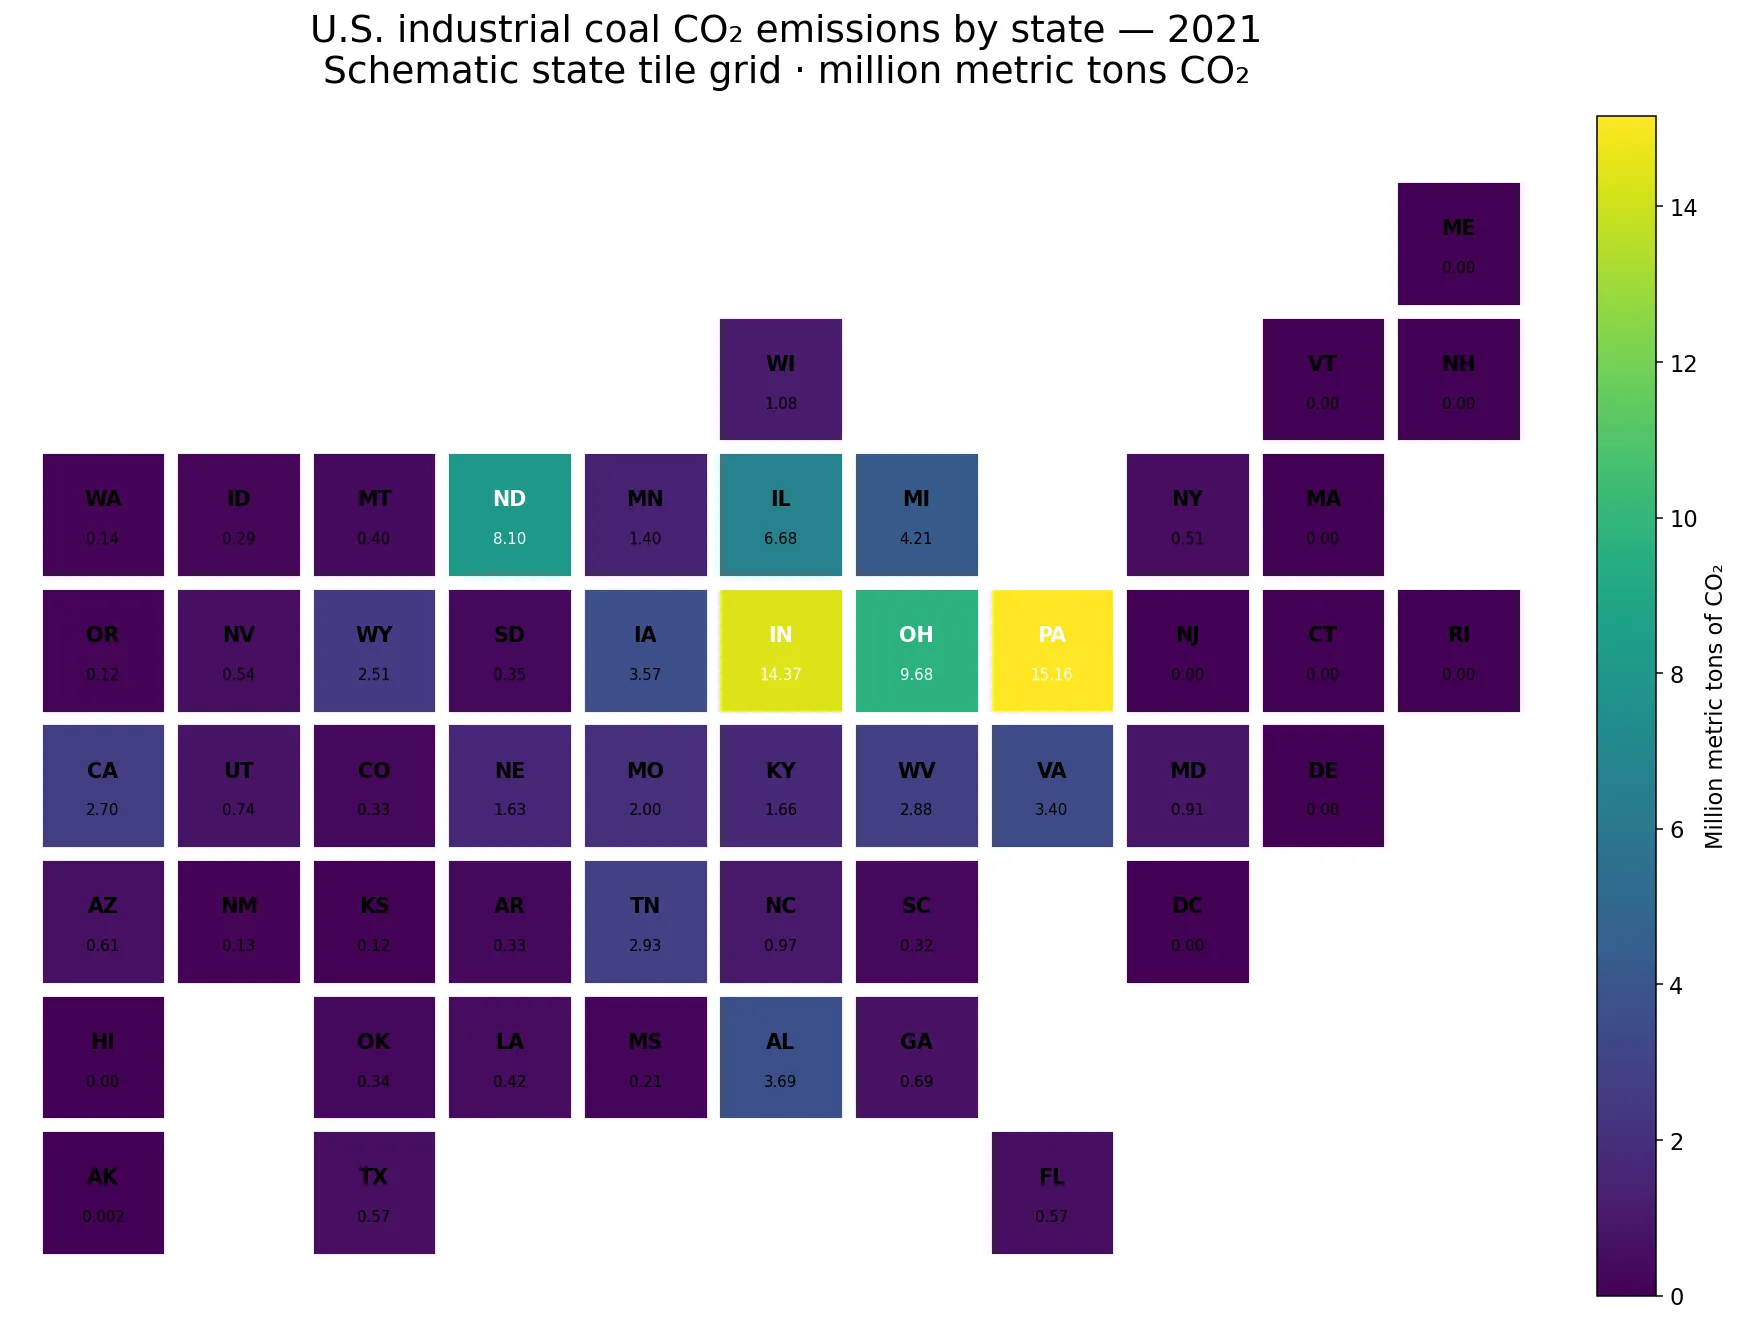
Commercial-sector wood and waste prices vary widely across the United States, but the metric needs careful interpretation. In the 2024 U.S. Energy Information Administration State Energy Data System, the highest reported state-level value is $14.07 per million Btu and the lowest is $1.17 per million Btu. These figures are not retail prices for a cord of firewood or a ton of waste. They are energy-normalized prices for wood and waste used in the commercial sector, expressed in dollars per million Btu.
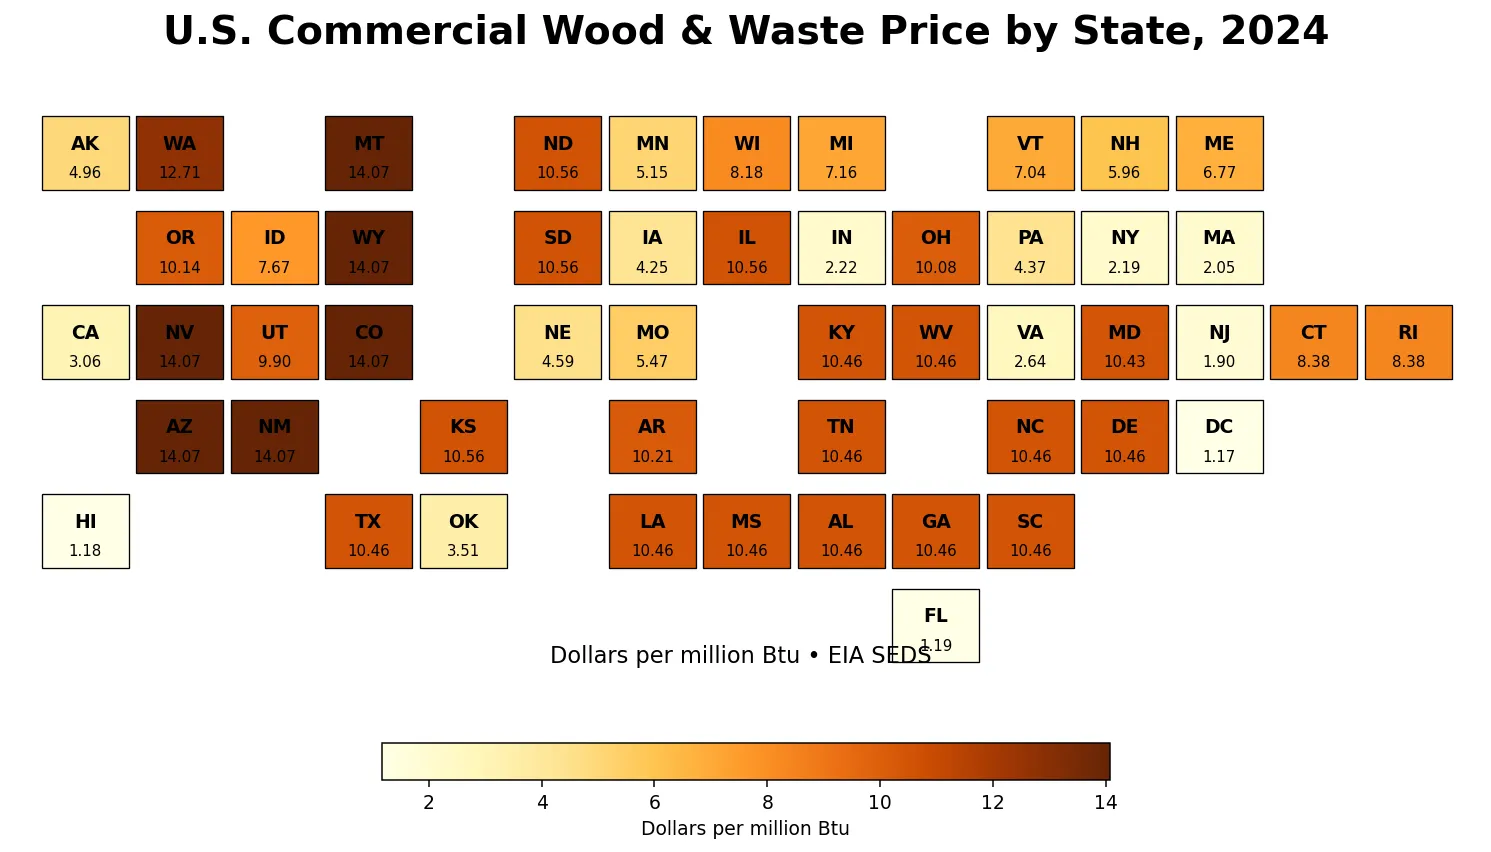
Six states share the highest value: Arizona, Colorado, Montana, Nevada, New Mexico, and Wyoming, all at $14.07 per million Btu. Washington follows at $12.71. Illinois, Kansas, North Dakota, and South Dakota each show $10.56. At the low end, the District of Columbia is at $1.17, Hawaii at $1.18, and Florida at $1.19. The repeated values are an important clue that this is a modeled and weighted SEDS price series rather than a list of independent spot-market quotes.
The comparison below keeps all 51 jurisdictions in the same year and unit. It also separates price from consumption. State prices should not be added together to create a national total, and the unweighted average of state prices is not the U.S. commercial-sector price. A national price requires consumption weighting, because a state with a small amount of wood and waste use should not count the same as a state with much larger consumption.
Table of Contents
What does the commercial wood and waste price measure?
SEDS labels this series “Wood and waste price in the commercial sector.” The unit is dollars per million Btu, often written $/MMBtu. EIA’s price and expenditure documentation defines the commercial wood-and-waste price from commercial wood-and-waste expenditures and adjusted consumption. The final state-level price is a consumption-weighted average of the prices and consumption of the relevant wood and waste components.
The method matters because direct state-level prices are not available for every commercial use. EIA separates commercial wood consumption into commercial combined-heat-and-power and electricity-only facilities on one side and other commercial entities on the other. For commercial CHP and electricity-only facilities, SEDS uses the U.S. average wood price in the electric power sector as an approximation. For other commercial entities, it assigns state-level residential wood prices.
Commercial CHP and electricity-only facilities are also the commercial users of waste in the SEDS method. States with commercial waste consumption are assigned the electric-power-sector annual U.S. average price for waste. SEDS then combines the components with consumption weighting and applies its consumption-adjustment procedures when calculating expenditures. The resulting number is therefore best understood as a standardized energy price estimate for this sector, not a local merchant quote.
What stands out in the 2024 distribution?
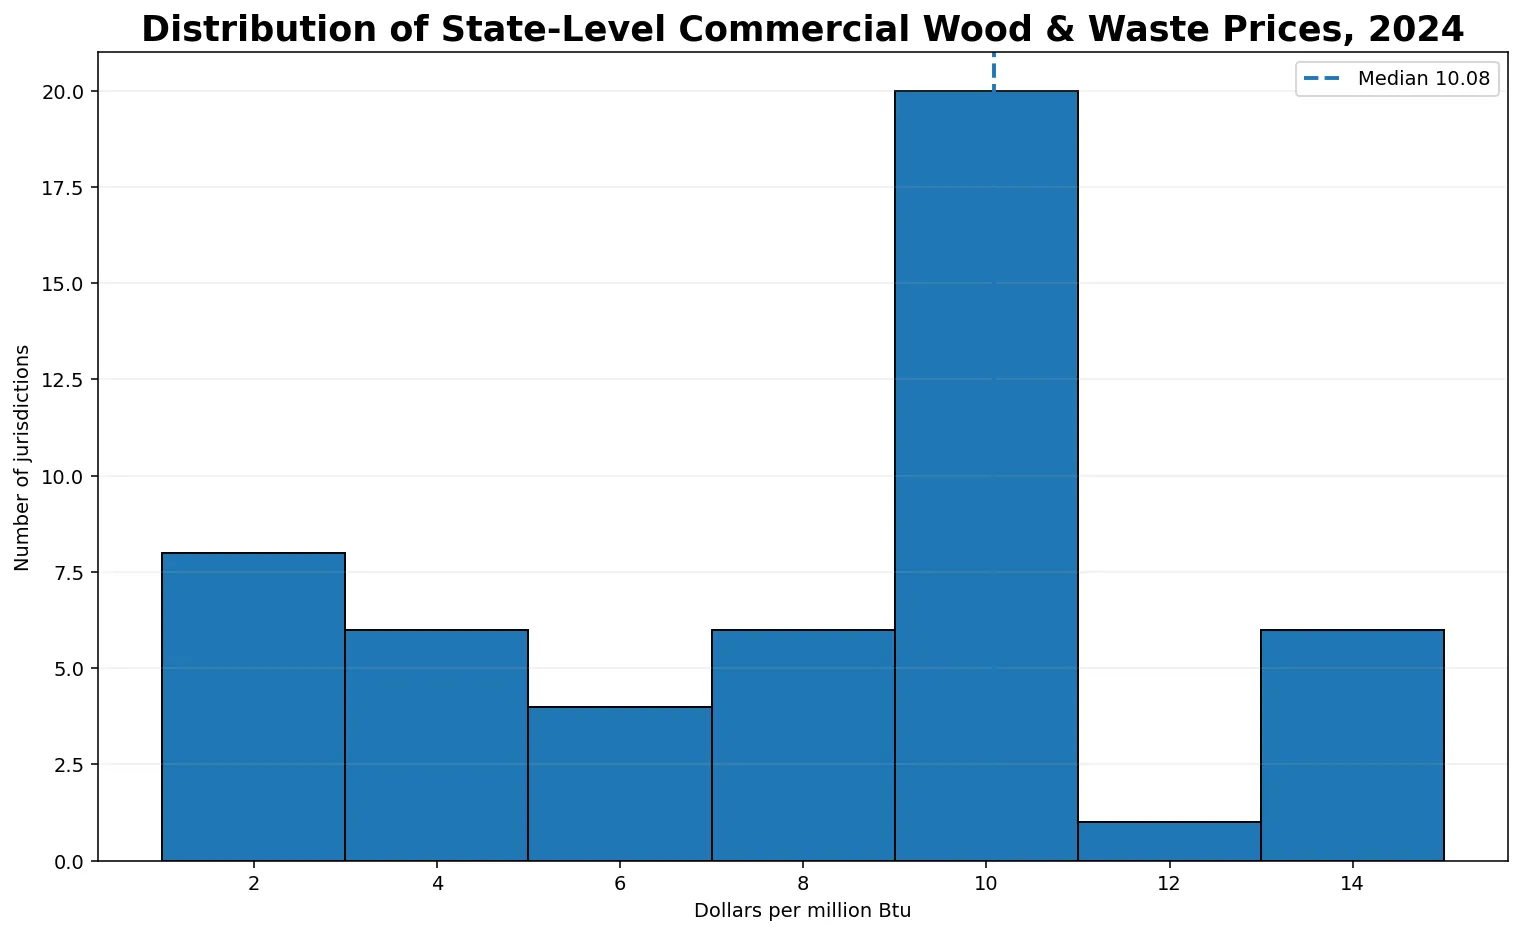
The median of the 51 jurisdiction values is $10.08 per million Btu. The simple arithmetic mean is $8.13, but that mean is only a descriptive statistic across state observations. It is not a national EIA price because it gives every state equal weight regardless of its commercial wood-and-waste consumption.
Repeated values are unusually prominent. The $14.07 level appears in six states, $10.56 in four states, and $10.46 in eleven states. That pattern should not be interpreted as evidence that separate local transactions happened to clear at exactly the same price. EIA’s methodology uses common or assigned price inputs where direct state-level prices are unavailable, and then combines components through a consistent estimation framework.
Price also does not tell us how much wood and waste a state consumes. A state can have a relatively high $/MMBtu value while using little commercial wood and waste, or a lower price while using much more. For demand, energy use, or market size, the commercial consumption and expenditure series are the appropriate companions to this price measure.
States at the high and low ends
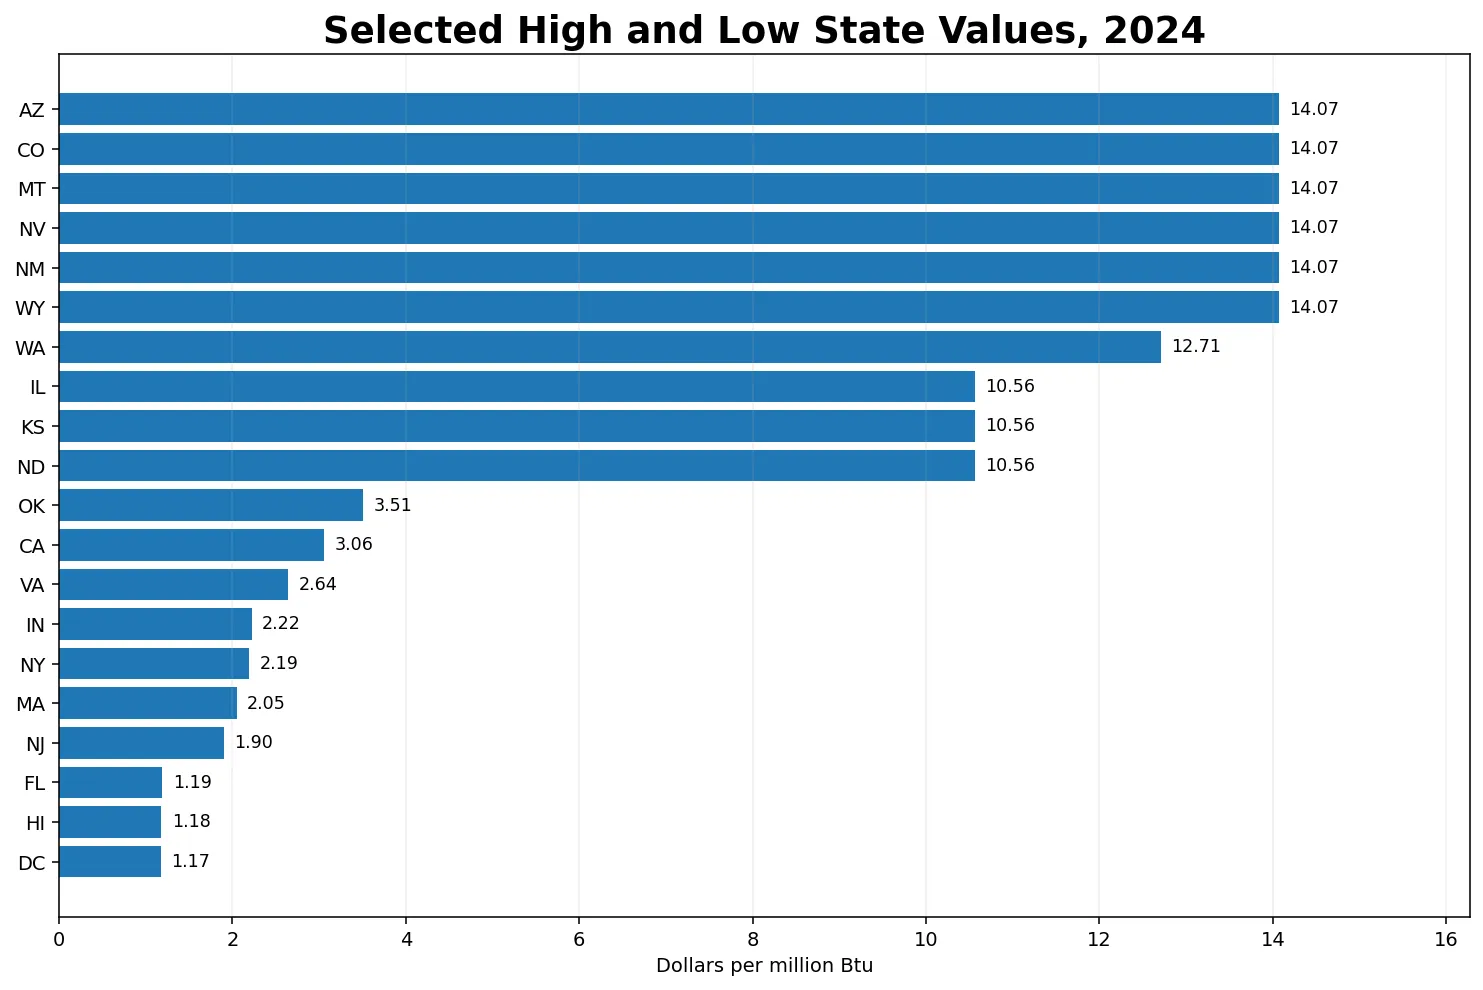
Arizona, Colorado, Montana, Nevada, New Mexico, and Wyoming form a six-state group at the maximum value of $14.07 per million Btu. Washington is next at $12.71. Illinois, Kansas, North Dakota, and South Dakota are each at $10.56. A large group—Alabama, Delaware, Georgia, Kentucky, Louisiana, Mississippi, North Carolina, South Carolina, Tennessee, Texas, and West Virginia—shares $10.46.
At the lower end, the District of Columbia records $1.17 per million Btu, followed by Hawaii at $1.18 and Florida at $1.19. New Jersey is $1.90, Massachusetts $2.05, New York $2.19, Indiana $2.22, and Virginia $2.64. The spread from the minimum to the maximum is $12.90 per million Btu, and the maximum is roughly twelve times the minimum.
That ratio describes the range of this specific SEDS series; it does not explain why the states differ. The dataset by itself does not isolate transportation costs, fuel quality, facility type, contract terms, waste-handling arrangements, or state policy. Those factors might be relevant in a deeper study, but they should not be assigned as causes without additional evidence.
Why do several states have exactly the same price?
Wood and waste energy is a difficult market to summarize with the same type of price series used for highly standardized fuels. There may be locally sourced wood, mill residues, paper-related waste, biomass byproducts, or waste streams used at CHP facilities. Direct price observations are not available for every state and commercial application. SEDS therefore uses a documented estimation structure to create comparable annual state values.
For the commercial sector, part of that structure relies on the U.S. electric-power-sector average prices for wood or waste, while other commercial wood uses draw on state-level residential wood prices. When the same input value is assigned to multiple states, or when similar component mixes are combined, identical state-level estimates can result. The repetition is therefore compatible with the methodology and should not automatically be treated as a data-quality problem.
It is also important that “wood and waste” is a combined category. Two states with the same final price can still have different mixes of wood and waste consumption. Conversely, different final prices do not necessarily mean the price of one particular wood product differs by the same amount. The combined figure is an analytical price index for energy use in the commercial sector.
Three common interpretation mistakes
First, $/MMBtu is an energy price, not a physical-unit price. A cord, ton, or truckload can contain different amounts of usable energy depending on material, moisture, composition, and processing. Converting energy prices into a physical-unit price requires an appropriate heat-content assumption, which is outside this state comparison.
Second, this is not the residential wood price. The commercial sector has a different consumption structure and SEDS uses a separate method to construct the commercial wood-and-waste series. A household heating comparison should use the residential wood price series instead of borrowing the commercial number.
Third, a high price is not automatically evidence of inefficiency. The series does not identify a single causal mechanism behind each state’s value. It is most useful for locating price differences under one consistent definition and then selecting states for a deeper comparison using consumption, expenditures, facility data, or other sector-specific information.
Complete 2024 table for 50 states and D.C.
The table is sorted from the highest reported value to the lowest. Ties are not treated as evidence of a meaningful rank difference; tied states are simply arranged alphabetically. All observations refer to 2024 and use the same dollars-per-million-Btu unit.
| Order | State / jurisdiction | Code | Year | $/MMBtu |
|---|---|---|---|---|
| 1 | Arizona | AZ | 2024 | 14.07 |
| 2 | Colorado | CO | 2024 | 14.07 |
| 3 | Montana | MT | 2024 | 14.07 |
| 4 | Nevada | NV | 2024 | 14.07 |
| 5 | New Mexico | NM | 2024 | 14.07 |
| 6 | Wyoming | WY | 2024 | 14.07 |
| 7 | Washington | WA | 2024 | 12.71 |
| 8 | Illinois | IL | 2024 | 10.56 |
| 9 | Kansas | KS | 2024 | 10.56 |
| 10 | North Dakota | ND | 2024 | 10.56 |
| 11 | South Dakota | SD | 2024 | 10.56 |
| 12 | Alabama | AL | 2024 | 10.46 |
| 13 | Delaware | DE | 2024 | 10.46 |
| 14 | Georgia | GA | 2024 | 10.46 |
| 15 | Kentucky | KY | 2024 | 10.46 |
| 16 | Louisiana | LA | 2024 | 10.46 |
| 17 | Mississippi | MS | 2024 | 10.46 |
| 18 | North Carolina | NC | 2024 | 10.46 |
| 19 | South Carolina | SC | 2024 | 10.46 |
| 20 | Tennessee | TN | 2024 | 10.46 |
| 21 | Texas | TX | 2024 | 10.46 |
| 22 | West Virginia | WV | 2024 | 10.46 |
| 23 | Maryland | MD | 2024 | 10.43 |
| 24 | Arkansas | AR | 2024 | 10.21 |
| 25 | Oregon | OR | 2024 | 10.14 |
| 26 | Ohio | OH | 2024 | 10.08 |
| 27 | Utah | UT | 2024 | 9.90 |
| 28 | Connecticut | CT | 2024 | 8.38 |
| 29 | Rhode Island | RI | 2024 | 8.38 |
| 30 | Wisconsin | WI | 2024 | 8.18 |
| 31 | Idaho | ID | 2024 | 7.67 |
| 32 | Michigan | MI | 2024 | 7.16 |
| 33 | Vermont | VT | 2024 | 7.04 |
| 34 | Maine | ME | 2024 | 6.77 |
| 35 | New Hampshire | NH | 2024 | 5.96 |
| 36 | Missouri | MO | 2024 | 5.47 |
| 37 | Minnesota | MN | 2024 | 5.15 |
| 38 | Alaska | AK | 2024 | 4.96 |
| 39 | Nebraska | NE | 2024 | 4.59 |
| 40 | Pennsylvania | PA | 2024 | 4.37 |
| 41 | Iowa | IA | 2024 | 4.25 |
| 42 | Oklahoma | OK | 2024 | 3.51 |
| 43 | California | CA | 2024 | 3.06 |
| 44 | Virginia | VA | 2024 | 2.64 |
| 45 | Indiana | IN | 2024 | 2.22 |
| 46 | New York | NY | 2024 | 2.19 |
| 47 | Massachusetts | MA | 2024 | 2.05 |
| 48 | New Jersey | NJ | 2024 | 1.90 |
| 49 | Florida | FL | 2024 | 1.19 |
| 50 | Hawaii | HI | 2024 | 1.18 |
| 51 | District of Columbia | DC | 2024 | 1.17 |
How to use the price series with consumption and expenditures
Price alone does not measure the economic size of wood and waste use. Two states can share a $14.07 per million Btu price while having very different consumption. If one state uses much more energy, its total expenditure can be much larger even when the unit price is identical. SEDS is designed so the price, adjusted consumption, and expenditure concepts can be examined together.
The reverse is also true: a state with large commercial consumption does not have to be a high-price state. Different component mixes, assigned price inputs, and facility types can affect the price estimate. A useful workflow is to start with this price comparison, identify a state of interest, and then check the matching commercial wood-and-waste consumption and expenditure rows for the same year.
For a U.S.-level price, do not average the 51 state values with equal weights. The simple state mean of $8.13 per million Btu is included here only to describe the distribution. A meaningful national average needs consumption weights, which is why EIA’s national price should be taken from the SEDS national series rather than reconstructed from an unweighted mean.
Source and calculation notes
The underlying observations come from the U.S. Energy Information Administration State Energy Data System. EIA publishes the state values in its wood and biomass waste price and expenditure table, while the renewable-energy price and expenditure technical notes explain how the commercial-sector wood and waste price is constructed.
This page sorts the 51 supplied 2024 observations and calculates descriptive statistics such as the median, simple mean, minimum, maximum, and range. No missing value is replaced with zero, and no observation from another year or another sector is mixed into the table. The state values themselves remain the published annual observations in dollars per million Btu.
Frequently Asked Questions
Which states had the highest commercial wood and waste price in 2024?
Arizona, Colorado, Montana, Nevada, New Mexico, and Wyoming each recorded $14.07 per million Btu, the highest value in the 2024 state series.
Which jurisdiction had the lowest value?
The District of Columbia had the lowest value at $1.17 per million Btu, followed by Hawaii at $1.18 and Florida at $1.19.
Is this a retail firewood price?
No. It is an EIA SEDS commercial-sector wood and waste energy price expressed in dollars per million Btu and constructed from sector consumption and expenditure concepts.
Can the simple average of the state prices be used as the U.S. price?
No. A national price needs consumption weighting because state consumption differs. The simple state average is only a descriptive statistic for the distribution.
Related Articles
Green Map creates custom-edited map images using open geographic data sources such as geoBoundaries, Natural Earth, OpenStreetMap, and government open data. These maps are edited visual materials, not raw data files, and are provided for education, documents, presentations, and graphic reference.