World Bank indicator FB.AST.NPER.ZS measures bank nonperforming loans as a percentage of total gross loans. NPLs generally include loans that are at least 90 days past due or are otherwise judged unlikely to be repaid in full without realizing collateral. The latest non-empty file contains 154 observations, and 90 are from 2025, making 2025 the largest same-year group for direct comparison.
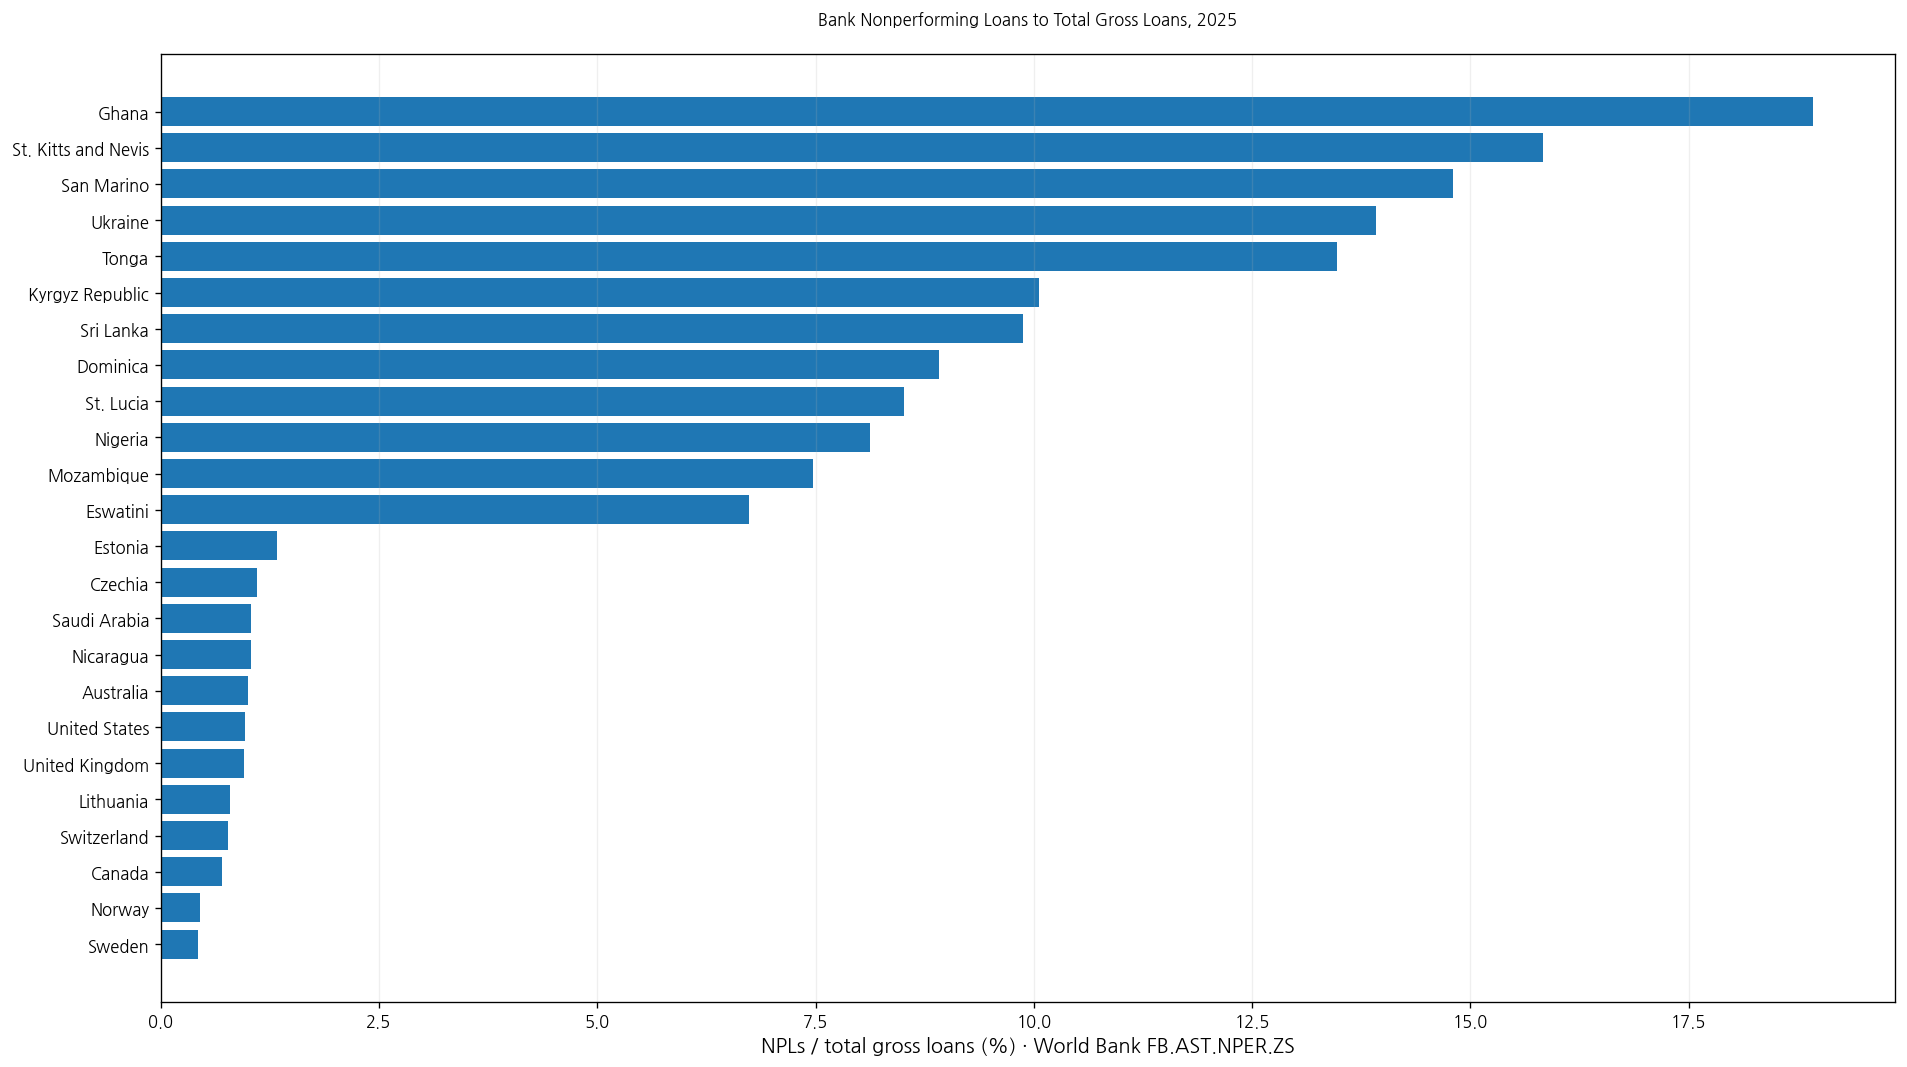
Table of Contents
What the NPL ratio measures
The ratio describes the share of a banking system’s loan portfolio that is impaired or at elevated risk of default. A higher value means problematic loans occupy a larger part of total gross loans.
Nonperforming does not simply mean any brief payment delay. International definitions typically include loans at least 90 days past due or loans considered unlikely to be repaid in full even if the delay is shorter.
Both numerator and denominator are on a gross book-value basis
The World Bank definition specifies that nonperforming loans and total gross loans should be reported at gross book value, without deducting loan-loss provisions or collateral.
The indicator therefore measures the portfolio share of problem loans rather than a net exposure after accounting adjustments.
The 2025 mean is 3.75% and the median is 2.56%
The 2025 subset contains 90 economies. Its mean is 3.75% and median 2.56%. The first quartile is 1.92% and the third quartile 4.29%, placing the middle half roughly between 1.92% and 4.29%.
16 economies are at or above 5%, 6 are at or above 10%, and none reaches 20%. At the lower end, 27 are below 2% and 7 are below 1%.
Ghana is highest in 2025 at 18.92%
Ghana records 18.92%, followed by St. Kitts and Nevis at 15.83%, San Marino at 14.80%, Ukraine at 13.92%, Tonga at 13.47%, and Kyrgyz Republic at 10.06%. Sri Lanka, Dominica, St. Lucia, and Nigeria are also above 8%.
| 2025 rank | Economy/territory | NPLs / total gross loans |
|---|---|---|
| 1 | Ghana | 18.92% |
| 2 | St. Kitts and Nevis | 15.83% |
| 3 | San Marino | 14.80% |
| 4 | Ukraine | 13.92% |
| 5 | Tonga | 13.47% |
| 6 | Kyrgyz Republic | 10.06% |
| 7 | Sri Lanka | 9.87% |
| 8 | Dominica | 8.92% |
| 9 | St. Lucia | 8.51% |
| 10 | Nigeria | 8.12% |
| 11 | Mozambique | 7.47% |
| 12 | Eswatini | 6.74% |
| 13 | Maldives | 5.69% |
| 14 | Pakistan | 5.36% |
| 15 | Argentina | 5.29% |
| 16 | Nepal | 5.15% |
| 17 | Congo, Dem. Rep. | 4.92% |
| 18 | Sao Tome and Principe | 4.81% |
| 19 | Seychelles | 4.71% |
| 20 | St. Vincent and the Grenadines | 4.48% |
A high ratio can signal pressure on bank asset quality and may affect provisioning, capital, profitability, and the ability to expand new lending. It is still only one dimension of financial-system resilience.
Sweden is lowest in 2025 at 0.43%
At the lower end, Sweden records 0.43%, Norway 0.45%, Canada 0.71%, Switzerland 0.77%, Lithuania 0.79%, United Kingdom 0.95%, and United States 0.96%.
| Low-order position in 2025 | Economy/territory | NPLs / total gross loans |
|---|---|---|
| 1 | Sweden | 0.43% |
| 2 | Norway | 0.45% |
| 3 | Canada | 0.71% |
| 4 | Switzerland | 0.77% |
| 5 | Lithuania | 0.79% |
| 6 | United Kingdom | 0.95% |
| 7 | United States | 0.96% |
| 8 | Australia | 1.00% |
| 9 | Nicaragua | 1.04% |
| 10 | Saudi Arabia | 1.04% |
| 11 | Czechia | 1.11% |
| 12 | Estonia | 1.33% |
| 13 | Malaysia | 1.37% |
| 14 | Kuwait | 1.40% |
| 15 | Finland | 1.41% |
| 16 | Netherlands | 1.44% |
| 17 | Denmark | 1.47% |
| 18 | Hong Kong SAR, China | 1.56% |
| 19 | Iceland | 1.56% |
| 20 | Poland | 1.59% |
A low ratio means problematic loans form a small share of total gross loans. It generally indicates less asset-quality stress, but it does not by itself establish strong profitability, inclusive credit access, prudent loan growth, or overall financial stability.
Lower is generally better, but country rankings need caution
NPL ratios are normally interpreted in a lower-is-better direction for asset quality. Yet supervisory standards, recognition timing, write-off practices, loan sales, portfolio composition, and economic conditions can differ across countries.
Small cross-country gaps should therefore not be converted into a simple ranking of banking-system quality without supporting information.
The ratio is not the same as a delinquency rate
Not every delinquent loan becomes an NPL immediately. A 30-day arrears measure, for example, can cover a broader or earlier stage of payment stress than an NPL definition centered on 90 days past due or unlikely repayment.
Mortgage delinquency, credit-card arrears, or corporate-loan delinquency rates should therefore not be treated as interchangeable with this indicator.
It is also different from provisioning coverage
The NPL ratio measures the amount of problem loans relative to total gross loans. Loan-loss provisions are accounting reserves established against expected credit losses.
Looking at NPLs and provisioning together can show both the scale of problem assets and the buffers recognized against them.
Capital adequacy answers another question
Capital ratios measure a bank’s capacity to absorb losses, while the NPL ratio measures the share of problem loans in the loan book. High NPLs can coexist with strong capital, and low NPLs do not guarantee adequate capital.
A fuller assessment of banking resilience combines asset quality, capital, liquidity, profitability, provisioning, and credit-growth indicators.
NPLs can react to economic shocks with a lag
Borrower cash flow can deteriorate quickly, but loans may take time to migrate into nonperforming status. The NPL ratio can therefore move after the initial macroeconomic shock.
This series alone cannot identify whether a country’s high NPL ratio was caused by recession, interest rates, exchange rates, property markets, or other factors.
Why the main comparison uses 2025
Of the 154 latest non-empty observations, 90 are from 2025, 39 from 2024, and 11 from 2023. The remaining latest values date from 2017–2022.
| Observation year | Economies/territories | Share of 154 |
|---|---|---|
| 2025 | 90 | 58.4% |
| 2024 | 39 | 25.3% |
| 2023 | 11 | 7.1% |
| 2022 | 6 | 3.9% |
| 2021 | 3 | 1.9% |
| 2019 | 3 | 1.9% |
| 2018 | 1 | 0.6% |
| 2017 | 1 | 0.6% |
The full file should therefore not be presented as a 154-economy 2025 ranking. Same-year statistics and rankings use the 90 observations dated 2025, while the complete table preserves the latest observation for each economy.
The full latest-value file is mixed-year data
Across all 154 latest observations, the mean is 5.13% and median 3.12%, with a maximum of 31.51%. Those figures combine different years and should not be labeled a 2025 global average or 2025 global maximum.
Older observations may not represent the current condition of the banking system. Observation year is therefore essential context.
A percentage does not show the absolute stock of bad loans
A very large banking system with a 2% NPL ratio can have a larger monetary amount of nonperforming loans than a small system with a 10% ratio.
Absolute comparisons require loan balances in monetary units in addition to the percentage.
Complete list of the 154 latest observations
The table below lists each economy and territory’s latest non-empty observation alphabetically. The observation year should be read together with the percentage.
| Economy/territory | Observation year | NPLs / total gross loans |
|---|---|---|
| Afghanistan | 2018 | 8.89% |
| Albania | 2025 | 3.65% |
| Algeria | 2024 | 20.68% |
| Angola | 2024 | 14.13% |
| Antigua and Barbuda | 2025 | 3.35% |
| Argentina | 2025 | 5.29% |
| Armenia | 2024 | 1.13% |
| Australia | 2025 | 1.00% |
| Austria | 2024 | 2.93% |
| Azerbaijan | 2025 | 1.98% |
| Bangladesh | 2024 | 18.96% |
| Barbados | 2022 | 5.84% |
| Belarus | 2025 | 2.23% |
| Belgium | 2025 | 2.00% |
| Belize | 2024 | 3.14% |
| Bhutan | 2024 | 2.22% |
| Bolivia | 2024 | 3.14% |
| Bosnia and Herzegovina | 2024 | 3.15% |
| Botswana | 2025 | 3.32% |
| Brazil | 2025 | 3.88% |
| Brunei Darussalam | 2022 | 2.82% |
| Bulgaria | 2025 | 2.82% |
| Burundi | 2025 | 3.85% |
| Cambodia | 2024 | 6.56% |
| Cameroon | 2023 | 12.89% |
| Canada | 2025 | 0.71% |
| Central African Republic | 2023 | 16.22% |
| Chad | 2023 | 31.51% |
| Chile | 2025 | 2.40% |
| China | 2024 | 1.50% |
| Colombia | 2025 | 2.96% |
| Comoros | 2022 | 14.10% |
| Congo, Dem. Rep. | 2025 | 4.92% |
| Congo, Rep. | 2023 | 15.22% |
| Costa Rica | 2025 | 2.05% |
| Croatia | 2025 | 2.80% |
| Curacao | 2024 | 3.45% |
| Cyprus | 2025 | 2.13% |
| Czechia | 2025 | 1.11% |
| Denmark | 2025 | 1.47% |
| Djibouti | 2024 | 3.07% |
| Dominica | 2025 | 8.92% |
| Dominican Republic | 2025 | 1.72% |
| Ecuador | 2025 | 4.45% |
| El Salvador | 2024 | 1.71% |
| Equatorial Guinea | 2023 | 31.15% |
| Estonia | 2025 | 1.33% |
| Eswatini | 2025 | 6.74% |
| Ethiopia | 2021 | 5.41% |
| Fiji | 2021 | 8.48% |
| Finland | 2025 | 1.41% |
| France | 2024 | 2.09% |
| Gabon | 2023 | 7.58% |
| Gambia, The | 2022 | 4.56% |
| Georgia | 2025 | 2.54% |
| Germany | 2025 | 1.89% |
| Ghana | 2025 | 18.92% |
| Greece | 2025 | 2.95% |
| Grenada | 2025 | 4.09% |
| Guatemala | 2025 | 2.35% |
| Guinea | 2024 | 6.69% |
| Honduras | 2025 | 2.67% |
| Hong Kong SAR, China | 2025 | 1.56% |
| Hungary | 2025 | 2.63% |
| Iceland | 2025 | 1.56% |
| India | 2025 | 2.06% |
| Indonesia | 2025 | 1.92% |
| Iraq | 2024 | 16.54% |
| Ireland | 2024 | 1.23% |
| Israel | 2024 | 0.72% |
| Italy | 2025 | 2.46% |
| Japan | 2022 | 1.23% |
| Jordan | 2024 | 6.87% |
| Kazakhstan | 2025 | 3.63% |
| Kenya | 2024 | 13.57% |
| Korea, Rep. | 2023 | 0.26% |
| Kosovo | 2025 | 2.03% |
| Kuwait | 2025 | 1.40% |
| Kyrgyz Republic | 2025 | 10.06% |
| Latvia | 2025 | 2.47% |
| Lebanon | 2019 | 15.19% |
| Lesotho | 2024 | 4.27% |
| Liechtenstein | 2024 | 0.43% |
| Lithuania | 2025 | 0.79% |
| Luxembourg | 2025 | 2.23% |
| Macao SAR, China | 2025 | 4.43% |
| Madagascar | 2024 | 7.63% |
| Malawi | 2023 | 5.10% |
| Malaysia | 2025 | 1.37% |
| Maldives | 2025 | 5.69% |
| Malta | 2025 | 2.01% |
| Mauritius | 2025 | 3.45% |
| Mexico | 2025 | 2.17% |
| Micronesia, Fed. Sts. | 2024 | 2.77% |
| Moldova | 2025 | 4.17% |
| Monaco | 2019 | 0.24% |
| Mongolia | 2025 | 3.45% |
| Montenegro | 2025 | 3.04% |
| Morocco | 2024 | 8.19% |
| Mozambique | 2025 | 7.47% |
| Namibia | 2025 | 4.32% |
| Nepal | 2025 | 5.15% |
| Netherlands | 2025 | 1.44% |
| Nicaragua | 2025 | 1.04% |
| Nigeria | 2025 | 8.12% |
| North Macedonia | 2025 | 1.94% |
| Norway | 2025 | 0.45% |
| Pakistan | 2025 | 5.36% |
| Panama | 2025 | 2.39% |
| Papua New Guinea | 2023 | 5.42% |
| Paraguay | 2025 | 2.22% |
| Peru | 2024 | 3.99% |
| Philippines | 2025 | 3.02% |
| Poland | 2025 | 1.59% |
| Portugal | 2025 | 2.34% |
| Romania | 2025 | 3.11% |
| Russian Federation | 2023 | 4.51% |
| Rwanda | 2024 | 4.18% |
| Samoa | 2024 | 4.20% |
| San Marino | 2025 | 14.80% |
| Sao Tome and Principe | 2025 | 4.81% |
| Saudi Arabia | 2025 | 1.04% |
| Seychelles | 2025 | 4.71% |
| Singapore | 2019 | 1.31% |
| Sint Maarten (Dutch part) | 2022 | 11.20% |
| Slovak Republic | 2025 | 1.95% |
| Slovenia | 2025 | 2.37% |
| Solomon Islands | 2024 | 11.56% |
| Somalia, Fed. Rep. | 2025 | 2.65% |
| South Africa | 2024 | 4.54% |
| Spain | 2025 | 2.58% |
| Sri Lanka | 2025 | 9.87% |
| St. Kitts and Nevis | 2025 | 15.83% |
| St. Lucia | 2025 | 8.51% |
| St. Vincent and the Grenadines | 2025 | 4.48% |
| Sweden | 2025 | 0.43% |
| Switzerland | 2025 | 0.77% |
| Tajikistan | 2021 | 13.65% |
| Tanzania | 2025 | 2.48% |
| Thailand | 2024 | 2.82% |
| Tonga | 2025 | 13.47% |
| Trinidad and Tobago | 2024 | 2.85% |
| Turkiye | 2024 | 1.65% |
| Uganda | 2024 | 3.86% |
| Ukraine | 2025 | 13.92% |
| United Arab Emirates | 2024 | 4.14% |
| United Kingdom | 2025 | 0.95% |
| United States | 2025 | 0.96% |
| Uruguay | 2024 | 1.52% |
| Uzbekistan | 2024 | 3.89% |
| Vanuatu | 2017 | 15.05% |
| Viet Nam | 2024 | 4.85% |
| West Bank and Gaza | 2023 | 3.42% |
| Zambia | 2025 | 2.77% |
How to interpret the comparison
First, NPLs generally include loans at least 90 days past due or unlikely to be repaid in full. Second, numerator and denominator use gross book values. Third, lower values usually indicate less asset-quality stress, but supervisory and write-off practices matter.
Fourth, the NPL ratio is different from delinquency, provisioning, and capital ratios. Fifth, the full 154-row file mixes years, so the main comparison uses the 90 observations from 2025. Sixth, percentages do not show the absolute monetary stock of problem loans.
Source and calculation
The source is World Bank World Development Indicators FB.AST.NPER.ZS, Bank nonperforming loans to total gross loans (%). The 2025 mean, median, quartiles, threshold counts, and rankings use only the 90 observations dated 2025. The complete table preserves all 154 latest non-empty observations.
Frequently Asked Questions
Is a lower bank NPL ratio generally better?
Generally yes. A lower ratio means problem loans occupy a smaller share of total gross loans, although supervisory and write-off practices differ across countries.
When is a loan typically classified as nonperforming?
Common definitions include loans at least 90 days past due or loans considered unlikely to be repaid in full without realizing collateral.
What is the 2025 median?
The median across the 90 observations dated 2025 is 2.56%, while the mean is 3.75%.
Related Articles
Green Map creates custom-edited map images using open geographic data sources such as geoBoundaries, Natural Earth, OpenStreetMap, and government open data. These maps are edited visual materials, not raw data files, and are provided for education, documents, presentations, and graphic reference.