World Bank indicator GC.XPN.TRFT.ZS measures subsidies and other transfers as a percentage of government expense. The supplied source description defines subsidies as current unrequited payments that government units make to enterprises based on production activity or on the quantity or value of goods and services produced, sold, exported, or imported. The indicator combines subsidies with other transfers in one fiscal category and expresses that category as a share of total expense. The latest non-empty file contains 154 observations, but 2024 has only Tanzania at 53.97%. The largest recent same-year group is 2023 with 85 economies.
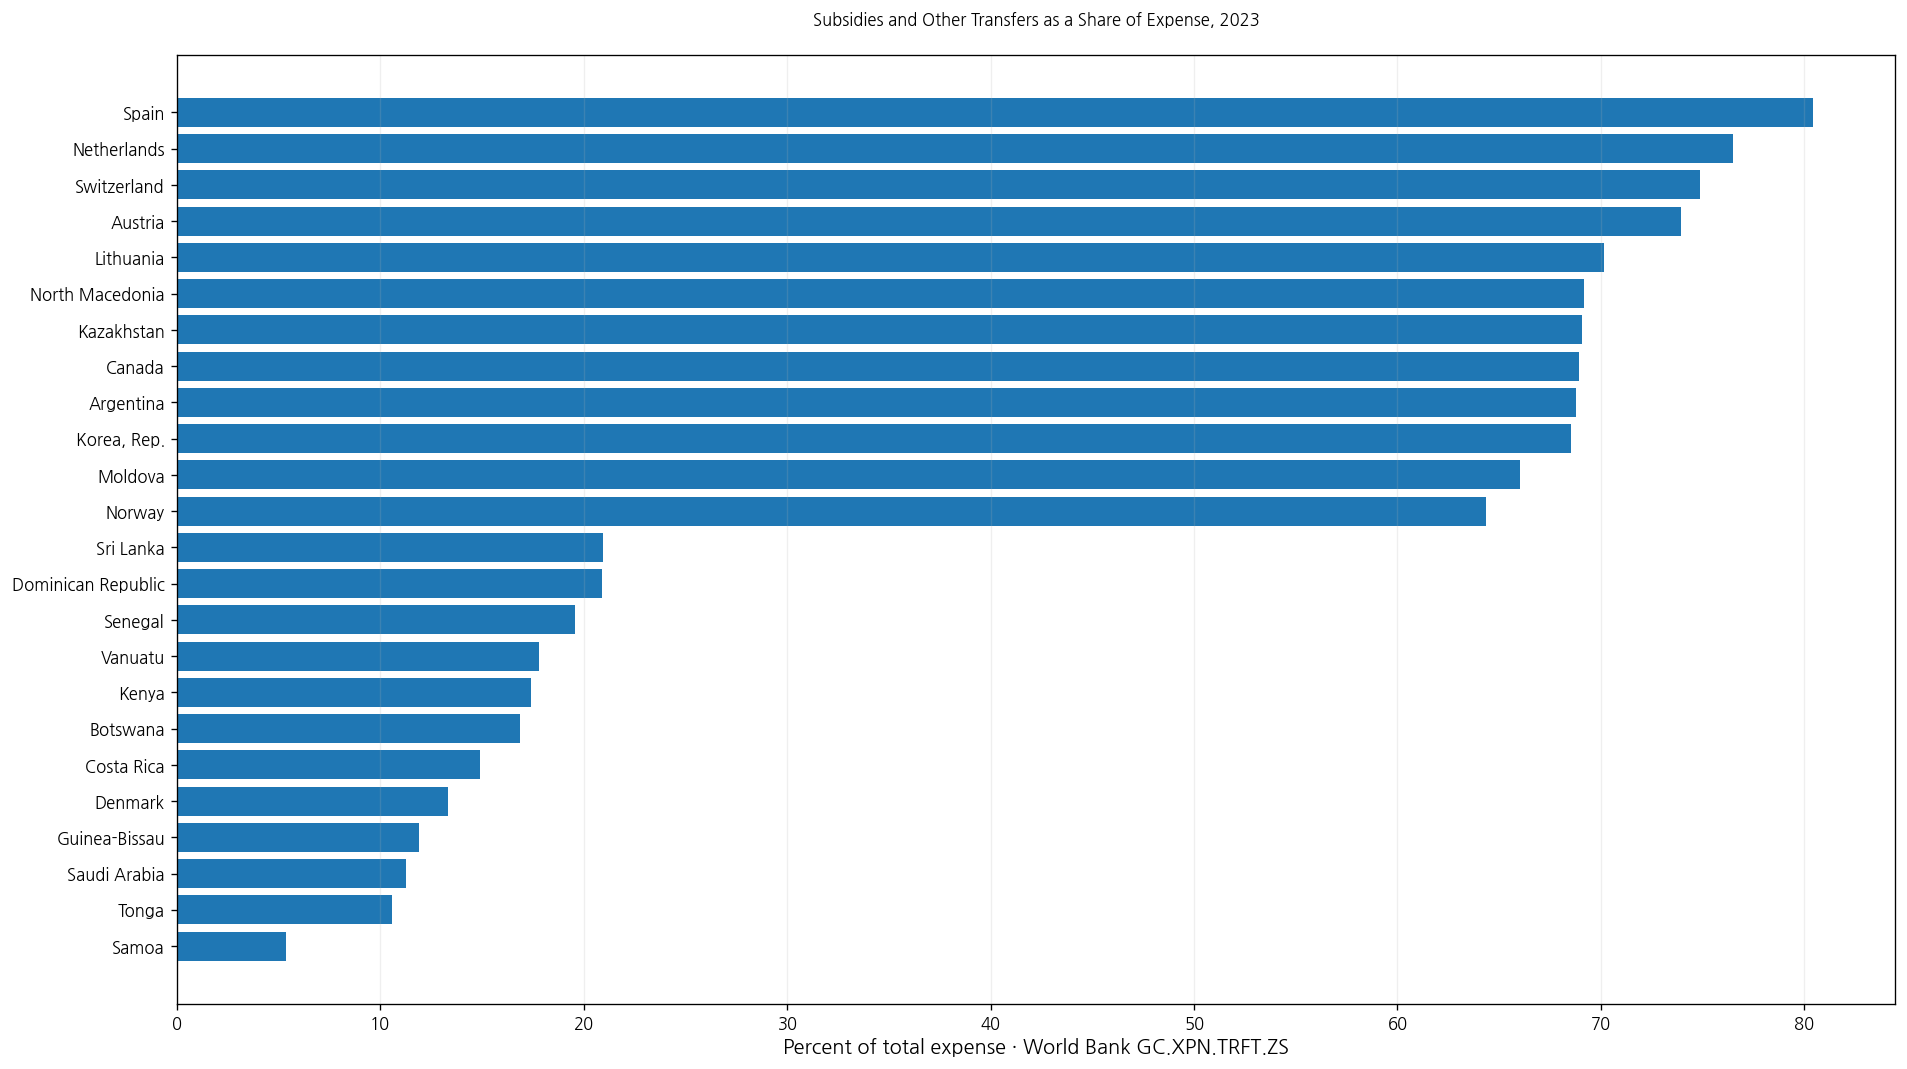
Table of Contents
The indicator is broader than enterprise subsidies alone
The series title is Subsidies and other transfers, so the percentage should not be relabeled as a pure enterprise-subsidy ratio. The source description explicitly defines subsidies, but the reported value combines that component with other transfers within the fiscal classification.
A value of 60% therefore does not mean that 60% of government expense went to a single subsidy program or even to enterprises alone. It means the combined subsidies-and-other-transfers category represented 60% of total expense.
Expense is not the same as GDP or every budget outlay
The supplied definition describes expense as a decrease in government net worth resulting from a transaction. That is a specific government-finance concept rather than a synonym for GDP, the total budget, or every cash payment made by government.
The denominator matters. A 40% share here cannot be restated as subsidies equal to 40% of GDP or 40% of all public-sector cash disbursements.
What the source means by subsidies
The official description treats subsidies as current unrequited payments made by government units to enterprises. They can be linked to the level of production activity or to the quantities or values of goods and services that enterprises produce, sell, export, or import.
The indicator does not identify which industries receive support, the policy purpose, the number of beneficiaries, or the economic impact. Country differences therefore describe fiscal composition, not the success or failure of industrial policy.
The 2023 mean is 43.43% and the median is 42.37%
The 2023 subset contains 85 economies. Its mean is 43.43% and median 42.37%. The first quartile is 32.21% and the third quartile 59.39%, placing the middle half roughly between 32.21% and 59.39%.
69 observations are at least 25%, 31 are at least 50%, and 2 reach 75% or more. Only 1 observation is below 10%. The category occupies a very different share of expense across countries.
Spain is highest in 2023 at 80.44%
Spain records 80.44%, followed by the Netherlands at 76.48%, Switzerland at 74.89%, Austria at 73.95%, Lithuania at 70.15%, North Macedonia at 69.14%, Kazakhstan at 69.04%, Canada at 68.90%, and Argentina at 68.76%.
| 2023 high-order position | Economy/territory | Subsidies & other transfers / expense |
|---|---|---|
| 1 | Spain | 80.44% |
| 2 | Netherlands | 76.48% |
| 3 | Switzerland | 74.89% |
| 4 | Austria | 73.95% |
| 5 | Lithuania | 70.15% |
| 6 | North Macedonia | 69.14% |
| 7 | Kazakhstan | 69.04% |
| 8 | Canada | 68.90% |
| 9 | Argentina | 68.76% |
| 10 | Korea, Rep. | 68.50% |
| 11 | Moldova | 66.02% |
| 12 | Norway | 64.34% |
| 13 | Estonia | 64.27% |
| 14 | United States | 64.08% |
| 15 | Belarus | 63.79% |
| 16 | Italy | 63.32% |
| 17 | Mexico | 63.13% |
| 18 | Brazil | 62.76% |
| 19 | France | 62.41% |
| 20 | Colombia | 60.77% |
A high share means the combined fiscal category occupies a large part of government expense. It does not by itself mean enterprise subsidies are unusually large, social policy is generous, or fiscal management is weak.
Samoa is lowest in 2023 at 5.40%
At the lower end, Samoa records 5.40%, Tonga 10.61%, Saudi Arabia 11.27%, Guinea-Bissau 11.94%, Denmark 13.34%, Costa Rica 14.92%, Botswana 16.90%, Kenya 17.43%, and Vanuatu 17.81%.
| 2023 low-order position | Economy/territory | Subsidies & other transfers / expense |
|---|---|---|
| 1 | Samoa | 5.40% |
| 2 | Tonga | 10.61% |
| 3 | Saudi Arabia | 11.27% |
| 4 | Guinea-Bissau | 11.94% |
| 5 | Denmark | 13.34% |
| 6 | Costa Rica | 14.92% |
| 7 | Botswana | 16.90% |
| 8 | Kenya | 17.43% |
| 9 | Vanuatu | 17.81% |
| 10 | Senegal | 19.60% |
| 11 | Dominican Republic | 20.89% |
| 12 | Sri Lanka | 20.96% |
| 13 | United Arab Emirates | 22.43% |
| 14 | Singapore | 22.45% |
| 15 | Bahamas, The | 22.50% |
| 16 | El Salvador | 23.34% |
| 17 | Jordan | 25.80% |
| 18 | Philippines | 26.55% |
| 19 | Ukraine | 27.79% |
| 20 | Iceland | 29.37% |
A low percentage means this category is a relatively small component of expense. Compensation of employees, goods and services, interest, or other fiscal categories may occupy more of the total, but this series alone does not identify which category explains the difference.
Tanzania 53.97% is the only 2024 observation
The most recent year in the file is 2024, but Tanzania is the sole observation, at 53.97%. One data point cannot support a meaningful world ranking, mean, or median for 2024.
The article therefore keeps Tanzania’s 2024 value in the complete latest-observation table while using the 85-economy 2023 subset for same-year comparisons.
The highest latest value is Czechia 83.95% from 2022
Across all 154 latest observations, Czechia has the highest value at 83.95%, but its observation year is 2022. It is not mixed into the 2023 ranking headed by Spain at 80.44%.
Latest-value inventories and same-year rankings answer different questions. The former maximize country coverage; the latter improve time consistency.
A percentage is different from an absolute transfer amount
A small government with a 70% share can spend less money on subsidies and other transfers than a much larger government with a 30% share. The percentage describes composition, not monetary scale.
Absolute comparisons require a current-LCU amount or total-expense level in addition to the percentage.
Compensation of employees provides a useful complementary comparison
Government expense is divided among several economic categories. Compensation of employees, use of goods and services, interest, other expense, and subsidies and transfers capture different parts of the fiscal structure.
Comparing multiple shares for the same year and government coverage gives a more complete picture than interpreting one category in isolation.
A high share does not measure policy quality or fiscal health
Subsidies and transfers can serve many policy objectives, but this indicator does not measure effectiveness, equity, targeting quality, or fiscal sustainability. A large share is a descriptive fact about composition.
Evaluating policy requires additional evidence on beneficiaries, program design, cost, financing, economic effects, and alternatives.
Country accounting coverage and observation year still matter
International government-finance statistics are designed for comparability, but government coverage, accounting practices, and data availability can differ by country and year. Older observations may be less representative of current fiscal structures.
Small differences should therefore be interpreted cautiously, with the observation year and exact denominator kept visible.
The 154 latest observations span 1990–2024
The latest non-empty file contains 154 observations spanning 1990–2024. The largest group is 2023 with 85 economies, followed by 2022 with 24, 2021 with 13, and 2020 with 11. Only one observation is from 2024.
| Observation year | Economies/territories | Share of 154 |
|---|---|---|
| 2024 | 1 | 0.6% |
| 2023 | 85 | 55.2% |
| 2022 | 24 | 15.6% |
| 2021 | 13 | 8.4% |
| 2020 | 11 | 7.1% |
| 2019 | 4 | 2.6% |
| 2018 | 1 | 0.6% |
| 2017 | 3 | 1.9% |
| 2016 | 2 | 1.3% |
| 2015 | 1 | 0.6% |
| 2012 | 1 | 0.6% |
| 2009 | 2 | 1.3% |
| 2008 | 1 | 0.6% |
| 2007 | 1 | 0.6% |
| 2006 | 1 | 0.6% |
| 2002 | 1 | 0.6% |
| 1992 | 1 | 0.6% |
| 1990 | 1 | 0.6% |
The complete file should therefore not be presented as a 2024 ranking of 154 economies. It is an inventory of the latest non-empty country values, while 2023 provides the largest recent same-year comparison.
Complete list of the 154 latest observations
The table below lists each economy or territory’s latest non-empty observation in alphabetical order. Older values should be read with their actual year rather than treated as current 2024 observations.
| Economy/territory | Observation year | Subsidies & other transfers / expense |
|---|---|---|
| Afghanistan | 2017 | 10.50% |
| Albania | 2023 | 58.82% |
| Angola | 2019 | 19.62% |
| Argentina | 2023 | 68.76% |
| Armenia | 2023 | 40.79% |
| Australia | 2022 | 69.40% |
| Austria | 2023 | 73.95% |
| Azerbaijan | 2022 | 38.00% |
| Bahamas, The | 2023 | 22.50% |
| Bahrain | 2020 | 30.07% |
| Bangladesh | 2021 | 34.12% |
| Barbados | 2016 | 37.88% |
| Belarus | 2023 | 63.79% |
| Belgium | 2022 | 53.10% |
| Belize | 2002 | 14.79% |
| Bhutan | 2020 | 15.88% |
| Bolivia | 2007 | 46.71% |
| Bosnia and Herzegovina | 2023 | 49.36% |
| Botswana | 2023 | 16.90% |
| Brazil | 2023 | 62.76% |
| Bulgaria | 2023 | 48.15% |
| Burkina Faso | 2023 | 35.07% |
| Burundi | 2021 | 26.31% |
| Cabo Verde | 2020 | 28.21% |
| Cambodia | 2023 | 37.27% |
| Cameroon | 2021 | 23.49% |
| Canada | 2023 | 68.90% |
| Chile | 2023 | 50.29% |
| Colombia | 2023 | 60.77% |
| Congo, Dem. Rep. | 2022 | 10.72% |
| Congo, Rep. | 2021 | 32.92% |
| Costa Rica | 2023 | 14.92% |
| Cote d’Ivoire | 2023 | 43.56% |
| Croatia | 2023 | 59.39% |
| Cyprus | 2023 | 47.89% |
| Czechia | 2022 | 83.95% |
| Denmark | 2023 | 13.34% |
| Dominican Republic | 2023 | 20.89% |
| Ecuador | 2022 | 36.63% |
| Egypt, Arab Rep. | 2015 | 37.21% |
| El Salvador | 2023 | 23.34% |
| Equatorial Guinea | 2022 | 15.33% |
| Estonia | 2023 | 64.27% |
| Eswatini | 2021 | 25.00% |
| Ethiopia | 2023 | 51.91% |
| Fiji | 2023 | 34.12% |
| Finland | 2023 | 44.70% |
| France | 2023 | 62.41% |
| Gabon | 2021 | 17.69% |
| Gambia, The | 1990 | 12.16% |
| Georgia | 2023 | 54.20% |
| Germany | 2022 | 80.05% |
| Ghana | 2022 | 17.81% |
| Greece | 2023 | 54.45% |
| Guatemala | 2023 | 34.67% |
| Guinea | 1992 | 9.82% |
| Guinea-Bissau | 2023 | 11.94% |
| Honduras | 2020 | 17.01% |
| Hungary | 2022 | 40.26% |
| Iceland | 2023 | 29.37% |
| India | 2022 | 42.52% |
| Indonesia | 2009 | 60.41% |
| Iran, Islamic Rep. | 2009 | 34.32% |
| Iraq | 2019 | 32.09% |
| Ireland | 2022 | 38.83% |
| Israel | 2023 | 42.37% |
| Italy | 2023 | 63.32% |
| Jordan | 2023 | 25.80% |
| Kazakhstan | 2023 | 69.04% |
| Kenya | 2023 | 17.43% |
| Kiribati | 2023 | 35.52% |
| Korea, Rep. | 2023 | 68.50% |
| Kuwait | 2006 | 39.66% |
| Kyrgyz Republic | 2023 | 38.48% |
| Lao PDR | 2022 | 11.72% |
| Latvia | 2023 | 58.16% |
| Lebanon | 2021 | 47.18% |
| Lesotho | 2022 | 26.85% |
| Lithuania | 2023 | 70.15% |
| Luxembourg | 2023 | 59.58% |
| Macao SAR, China | 2023 | 32.58% |
| Madagascar | 2023 | 33.89% |
| Malawi | 2022 | 22.71% |
| Malaysia | 2023 | 43.61% |
| Maldives | 2021 | 28.71% |
| Mali | 2020 | 20.30% |
| Malta | 2023 | 35.23% |
| Marshall Islands | 2020 | 17.07% |
| Mauritius | 2023 | 38.33% |
| Mexico | 2023 | 63.13% |
| Micronesia, Fed. Sts. | 2020 | 7.73% |
| Moldova | 2023 | 66.02% |
| Mongolia | 2021 | 72.31% |
| Morocco | 2023 | 35.25% |
| Mozambique | 2022 | 11.88% |
| Myanmar | 2019 | 20.81% |
| Namibia | 2023 | 33.09% |
| Naoero | 2020 | 25.98% |
| Nepal | 2021 | 77.19% |
| Netherlands | 2023 | 76.48% |
| New Zealand | 2022 | 50.31% |
| Nicaragua | 2023 | 36.99% |
| North Macedonia | 2023 | 69.14% |
| Norway | 2023 | 64.34% |
| Palau | 2020 | 29.39% |
| Panama | 2021 | 27.40% |
| Papua New Guinea | 2023 | 53.14% |
| Paraguay | 2023 | 30.06% |
| Peru | 2021 | 45.09% |
| Philippines | 2023 | 26.55% |
| Poland | 2023 | 47.55% |
| Portugal | 2023 | 54.77% |
| Romania | 2022 | 58.92% |
| Russian Federation | 2020 | 74.19% |
| Rwanda | 2023 | 44.03% |
| Samoa | 2023 | 5.40% |
| San Marino | 2023 | 40.30% |
| Saudi Arabia | 2023 | 11.27% |
| Senegal | 2023 | 19.60% |
| Serbia | 2022 | 59.54% |
| Seychelles | 2008 | 15.06% |
| Singapore | 2023 | 22.45% |
| Slovak Republic | 2022 | 46.73% |
| Slovenia | 2023 | 43.78% |
| Solomon Islands | 2022 | 6.41% |
| Somalia, Fed. Rep. | 2023 | 32.21% |
| South Africa | 2022 | 54.78% |
| Spain | 2023 | 80.44% |
| Sri Lanka | 2023 | 20.96% |
| St. Kitts and Nevis | 2020 | 33.04% |
| St. Lucia | 2017 | 24.05% |
| St. Vincent and the Grenadines | 2017 | 23.47% |
| Sudan | 2016 | 25.06% |
| Sweden | 2022 | 71.48% |
| Switzerland | 2023 | 74.89% |
| Tajikistan | 2023 | 41.96% |
| Tanzania | 2024 | 53.97% |
| Thailand | 2023 | 40.51% |
| Timor-Leste | 2022 | 14.07% |
| Togo | 2023 | 32.39% |
| Tonga | 2023 | 10.61% |
| Trinidad and Tobago | 2019 | 33.89% |
| Tunisia | 2012 | 46.20% |
| Turkiye | 2023 | 41.98% |
| Uganda | 2023 | 34.68% |
| Ukraine | 2023 | 27.79% |
| United Arab Emirates | 2023 | 22.43% |
| United Kingdom | 2023 | 47.15% |
| United States | 2023 | 64.08% |
| Uruguay | 2023 | 54.05% |
| Uzbekistan | 2023 | 49.02% |
| Vanuatu | 2023 | 17.81% |
| Zambia | 2021 | 12.59% |
| Zimbabwe | 2018 | 43.99% |
How to interpret the comparison
First, the series combines subsidies and other transfers rather than measuring enterprise subsidies alone. Second, the denominator is government expense under a specific government-finance definition, not GDP or every budget outlay. Third, percentages do not reveal absolute monetary amounts.
Fourth, a high share does not by itself indicate better or worse policy. Fifth, the full 154-row file mixes years, so direct rankings center on the 85 observations from 2023. Sixth, accounting scope and observation year should remain visible in country comparisons.
Source and calculation
The source is World Bank World Development Indicators GC.XPN.TRFT.ZS, Subsidies and other transfers (% of expense). The 2023 mean, median, quartiles, threshold counts, and high-low comparisons use only the 85 observations dated 2023. The complete table preserves all 154 latest non-empty country observations.
Frequently Asked Questions
Does this indicator measure enterprise subsidies only?
No. GC.XPN.TRFT.ZS combines subsidies and other transfers and expresses the combined category as a percentage of total expense.
What is the 2023 median?
The median across the 85 observations dated 2023 is 42.37%, while the mean is 43.43%.
Why is 2023 used instead of 2024 for the main comparison?
Tanzania is the only 2024 observation, while 2023 contains 85 economies and supports a meaningful same-year comparison.
Related Articles
Green Map creates custom-edited map images using open geographic data sources such as geoBoundaries, Natural Earth, OpenStreetMap, and government open data. These maps are edited visual materials, not raw data files, and are provided for education, documents, presentations, and graphic reference.