Agriculture, forestry and fishing value added measures the economic contribution of those activities after intermediate inputs are deducted from output. The World Bank NV.AGR.TOTL.KD file covers 217 economies and territories for 2025, with 162 reported values and 55 source-missing rows. Values are expressed in constant 2015 U.S. dollars, so the series is designed to remove price changes rather than report current-dollar market values.
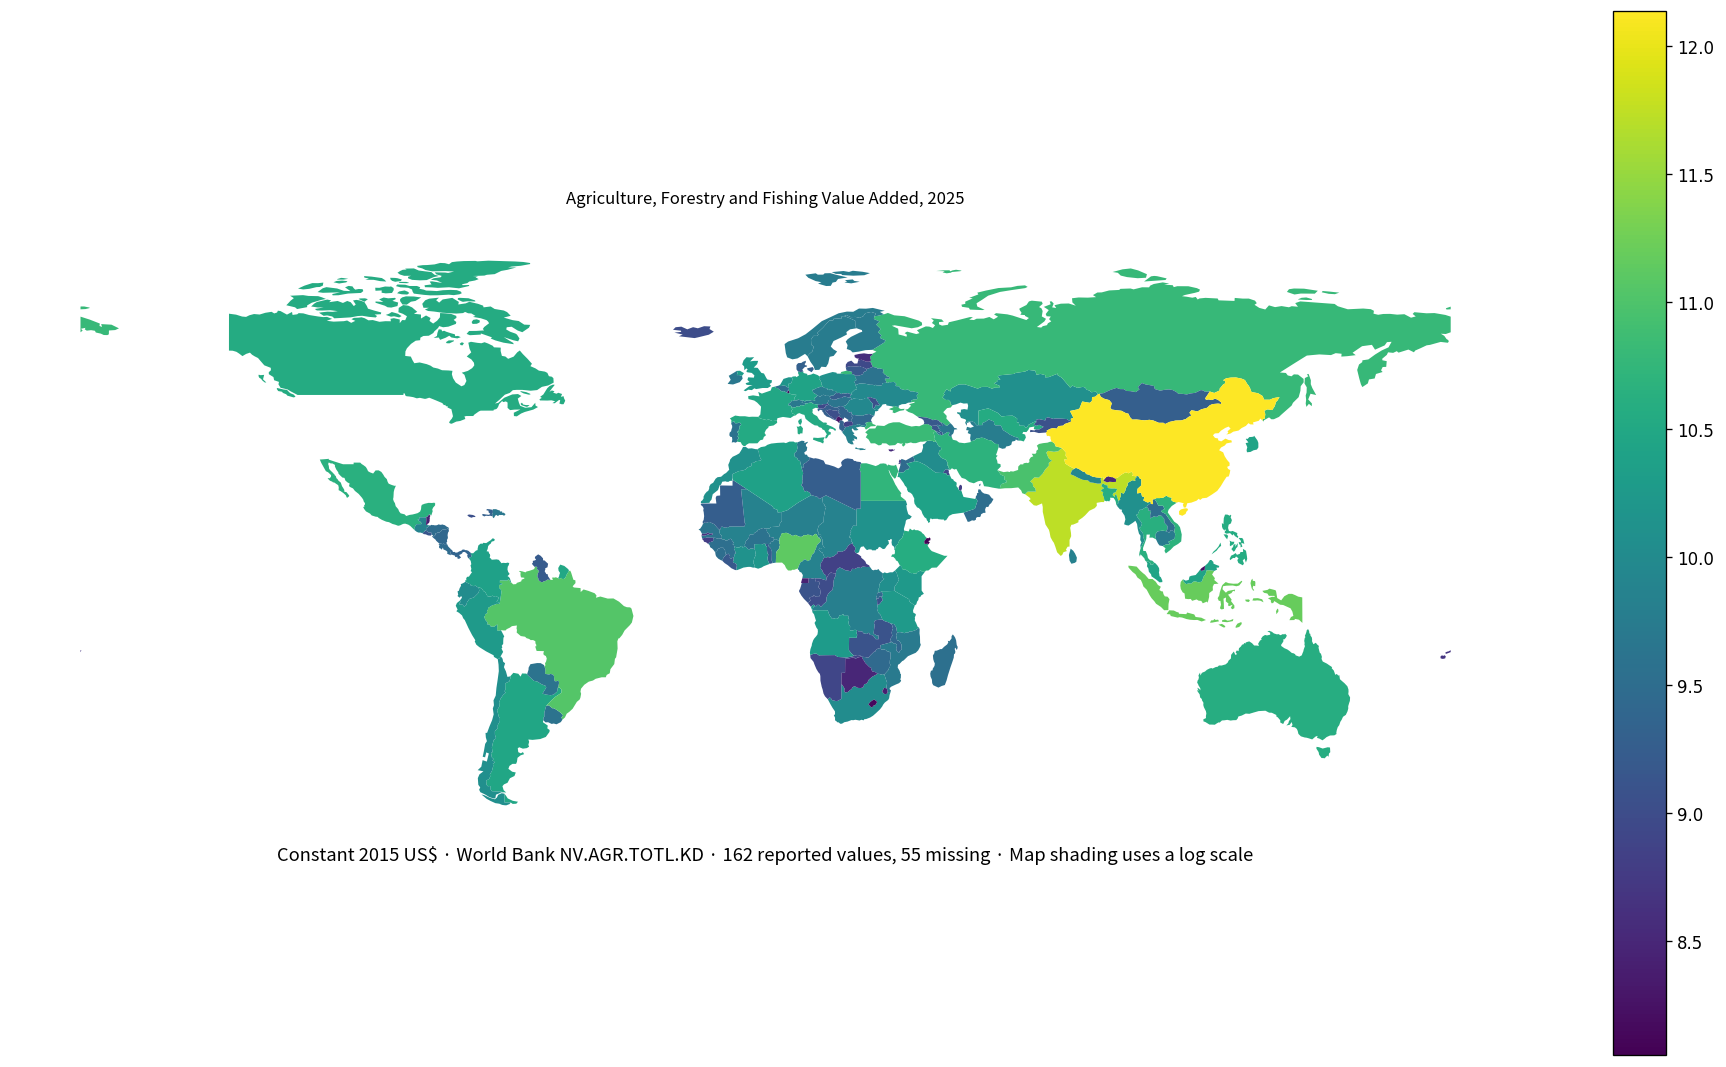
Table of Contents
Value added is different from gross output or sales
Value added is the contribution created by a producer or industry after subtracting the intermediate goods and services used in production from total output. Seeds, feed, fertilizer, fuel, transport, and purchased services can all be part of intermediate consumption.
For that reason, the indicator is not a simple total of farm, forestry, and fishery sales. Two economies with similar gross output can report different value added if their intermediate-input requirements differ.
The sector includes agriculture, forestry, and fishing
The World Bank description links the sector to ISIC Revision 4 divisions 01–03. It includes crop production, raising and breeding animals, harvesting timber and other plants, and taking animals or animal products from farms or natural habitats, together with forestry and fishing activities.
The measure should therefore not be reduced to crop farming alone. In some economies forestry or fishing can make a meaningful contribution to the combined sector.
Constant 2015 US$ is not current US$
Constant-price data adjust for changes in prices and express the series at a fixed 2015 price reference. A 2025 value in this indicator is not the amount that would be observed at 2025 market prices in current U.S. dollars.
That makes the series useful for comparing real economic scale, but it should not be substituted for current-dollar nominal value. It is also not a purchasing-power-parity international-dollar measure.
Distribution across the 162 reporting economies
Among the 162 economies with a reported 2025 value, the mean is US$23.44 billion and the median US$3.36 billion. The first quartile is US$862.26 million and the third quartile US$12.27 billion. The mean is far above the median because a few very large economies dominate the upper tail.
117 observations are at least US$1 billion, 47 are at least US$10 billion, 9 are at least US$50 billion, and 5 exceed US$100 billion. At the lower end, 45 are below US$1 billion and 12 are below US$100 million.
China is highest at about US$1.371 trillion
China records about US$1.371 trillion in constant 2015 U.S. dollars. India follows at US$531.67 billion, Indonesia at US$152.94 billion, Nigeria at US$132.44 billion, and Brazil at US$110.35 billion. These are the only five reported values above US$100 billion.
| 2025 rank | Economy/territory | Agriculture, forestry and fishing value added |
|---|---|---|
| 1 | China | US$1.371 trillion |
| 2 | India | US$531.67 billion |
| 3 | Indonesia | US$152.94 billion |
| 4 | Nigeria | US$132.44 billion |
| 5 | Brazil | US$110.35 billion |
| 6 | Pakistan | US$92.96 billion |
| 7 | Turkiye | US$66.43 billion |
| 8 | Russian Federation | US$61.08 billion |
| 9 | Egypt, Arab Rep. | US$52.75 billion |
| 10 | Viet Nam | US$48.08 billion |
| 11 | Iran, Islamic Rep. | US$47.44 billion |
| 12 | Mexico | US$44.44 billion |
| 13 | Thailand | US$42.48 billion |
| 14 | Australia | US$39.96 billion |
| 15 | Bangladesh | US$39.35 billion |
| 16 | Ethiopia | US$38.11 billion |
| 17 | Philippines | US$36.58 billion |
| 18 | Canada | US$35.39 billion |
| 19 | Uzbekistan | US$34.87 billion |
| 20 | Spain | US$33.95 billion |
These are absolute real values, so population and overall economic scale matter. A large value does not mean agriculture has a large share of GDP, nor does it imply high output per agricultural worker.
Small economies naturally appear at the bottom of an absolute-value ranking
The smallest reported value is St. Kitts and Nevis at about US$9.02 million, followed by Andorra at US$16.98 million, Antigua and Barbuda at US$22.43 million, Sao Tome and Principe at US$27.54 million, and St. Vincent and the Grenadines at US$32.37 million.
| Low-order position | Economy/territory | Agriculture, forestry and fishing value added |
|---|---|---|
| 1 | St. Kitts and Nevis | US$9.02 million |
| 2 | Andorra | US$16.98 million |
| 3 | Antigua and Barbuda | US$22.43 million |
| 4 | Sao Tome and Principe | US$27.54 million |
| 5 | St. Vincent and the Grenadines | US$32.37 million |
| 6 | Grenada | US$34.91 million |
| 7 | St. Lucia | US$49.82 million |
| 8 | Seychelles | US$58.84 million |
| 9 | Samoa | US$65.71 million |
| 10 | Dominica | US$67.57 million |
| 11 | Micronesia, Fed. Sts. | US$80.10 million |
| 12 | Cabo Verde | US$94.52 million |
| 13 | Djibouti | US$112.75 million |
| 14 | Singapore | US$114.20 million |
| 15 | Malta | US$125.36 million |
| 16 | Bahrain | US$133.61 million |
| 17 | Luxembourg | US$133.74 million |
| 18 | Lesotho | US$138.38 million |
| 19 | Brunei Darussalam | US$152.20 million |
| 20 | Hong Kong SAR, China | US$158.22 million |
A small absolute value should not be interpreted as an unimportant sector. In a small economy, tens of millions of constant dollars can still represent a large share of GDP or employment. Absolute size and structural importance are separate questions.
Current-price and constant-price measures answer different questions
Current-dollar value added reflects current prices and exchange-rate conditions. Constant 2015 U.S. dollars hold the price reference fixed, helping separate real change from inflation and other price effects.
For real-scale comparisons, the constant-price series is useful. For nominal market size or the amount recorded in current-dollar economic accounts, a current-price series is more appropriate.
This is not value added per worker
Value added per worker divides sector value added by employment and is used as a labor-productivity measure. The present indicator does not divide by the workforce; it measures the total real value added of the sector.
A country can therefore rank highly in total agriculture value added because it has a large population and workforce without ranking equally high in value added per worker.
This is also not agriculture’s share of GDP
An economy can produce US$50 billion of real agriculture, forestry and fishing value added while the sector represents only a small share of a very large GDP. Another economy can have a much smaller absolute value but a much larger sector share.
To analyze economic structure rather than absolute scale, agriculture, forestry and fishing value added as a percentage of GDP should be used alongside this series.
The sum of 162 reported rows is not a world total
The 162 reported values add to about US$3.798 trillion, but 55 economies and territories have no 2025 source value in this file. The sum should therefore not be labeled as the official 2025 world total.
Official global aggregates can also follow aggregation rules that differ from a simple sum of country rows. A published World Bank world aggregate should be used if a world total is needed.
Fifty-five source-missing rows must remain missing
Of the 217 rows, 55 are marked `NA_SOURCE_MISSING`. The United States, Japan, New Zealand, and the United Arab Emirates are among the economies without a 2025 value in this extraction. Missing does not mean zero.
Replacing those rows with zero would create false bottom rankings and distort a map. The visualization therefore leaves them unfilled, and the complete table identifies them explicitly.
The map represents 142 of the 162 reporting economies
The low-resolution world boundary file matches 142 of the 162 reporting economies, about 87.7%. Andorra, Hong Kong SAR, China, Singapore, and several small island economies do not have polygons in that boundary file.
The map is best used for broad spatial patterns. Exact country values should be read from the tables. A logarithmic shading scale is used because the gap between the largest and smallest reported values is extremely wide.
Complete 2025 list of 217 economies and territories
The table below preserves all 217 rows. Source-missing observations remain labeled as missing instead of being converted to zero.
| Economy/territory | Year | Agriculture, forestry and fishing value added | Data status |
|---|---|---|---|
| Afghanistan | 2025 | No source value | NA_SOURCE_MISSING |
| Albania | 2025 | US$2.03 billion | OK |
| Algeria | 2025 | US$24.63 billion | OK |
| American Samoa | 2025 | No source value | NA_SOURCE_MISSING |
| Andorra | 2025 | US$16.98 million | OK |
| Angola | 2025 | US$18.75 billion | OK |
| Antigua and Barbuda | 2025 | US$22.43 million | OK |
| Argentina | 2025 | US$29.86 billion | OK |
| Armenia | 2025 | US$1.42 billion | OK |
| Aruba | 2025 | No source value | NA_SOURCE_MISSING |
| Australia | 2025 | US$39.96 billion | OK |
| Austria | 2025 | US$4.80 billion | OK |
| Azerbaijan | 2025 | US$4.56 billion | OK |
| Bahamas, The | 2025 | No source value | NA_SOURCE_MISSING |
| Bahrain | 2025 | US$133.61 million | OK |
| Bangladesh | 2025 | US$39.35 billion | OK |
| Barbados | 2025 | No source value | NA_SOURCE_MISSING |
| Belarus | 2025 | US$4.11 billion | OK |
| Belgium | 2025 | US$3.29 billion | OK |
| Belize | 2025 | US$253.21 million | OK |
| Benin | 2025 | US$5.25 billion | OK |
| Bermuda | 2025 | No source value | NA_SOURCE_MISSING |
| Bhutan | 2025 | US$335.64 million | OK |
| Bolivia | 2025 | No source value | NA_SOURCE_MISSING |
| Bosnia and Herzegovina | 2025 | US$1.05 billion | OK |
| Botswana | 2025 | US$310.14 million | OK |
| Brazil | 2025 | US$110.35 billion | OK |
| British Virgin Islands | 2025 | No source value | NA_SOURCE_MISSING |
| Brunei Darussalam | 2025 | US$152.20 million | OK |
| Bulgaria | 2025 | US$2.60 billion | OK |
| Burkina Faso | 2025 | US$3.86 billion | OK |
| Burundi | 2025 | US$1.12 billion | OK |
| Cabo Verde | 2025 | US$94.52 million | OK |
| Cambodia | 2025 | US$5.36 billion | OK |
| Cameroon | 2025 | US$7.28 billion | OK |
| Canada | 2025 | US$35.39 billion | OK |
| Cayman Islands | 2025 | No source value | NA_SOURCE_MISSING |
| Central African Republic | 2025 | US$705.19 million | OK |
| Chad | 2025 | US$7.37 billion | OK |
| Channel Islands | 2025 | No source value | NA_SOURCE_MISSING |
| Chile | 2025 | US$11.68 billion | OK |
| China | 2025 | US$1.371 trillion | OK |
| Colombia | 2025 | US$23.30 billion | OK |
| Comoros | 2025 | US$390.76 million | OK |
| Congo, Dem. Rep. | 2025 | US$6.28 billion | OK |
| Congo, Rep. | 2025 | US$978.16 million | OK |
| Costa Rica | 2025 | US$2.93 billion | OK |
| Cote d’Ivoire | 2025 | US$13.71 billion | OK |
| Croatia | 2025 | US$1.87 billion | OK |
| Cuba | 2025 | No source value | NA_SOURCE_MISSING |
| Curacao | 2025 | No source value | NA_SOURCE_MISSING |
| Cyprus | 2025 | US$341.91 million | OK |
| Czechia | 2025 | US$5.48 billion | OK |
| Denmark | 2025 | US$1.94 billion | OK |
| Djibouti | 2025 | US$112.75 million | OK |
| Dominica | 2025 | US$67.57 million | OK |
| Dominican Republic | 2025 | US$4.92 billion | OK |
| Ecuador | 2025 | US$10.72 billion | OK |
| Egypt, Arab Rep. | 2025 | US$52.75 billion | OK |
| El Salvador | 2025 | US$1.39 billion | OK |
| Equatorial Guinea | 2025 | US$270.84 million | OK |
| Eritrea | 2025 | No source value | NA_SOURCE_MISSING |
| Estonia | 2025 | US$380.20 million | OK |
| Eswatini | 2025 | US$251.15 million | OK |
| Ethiopia | 2025 | US$38.11 billion | OK |
| Faroe Islands | 2025 | No source value | NA_SOURCE_MISSING |
| Fiji | 2025 | US$487.01 million | OK |
| Finland | 2025 | US$5.23 billion | OK |
| France | 2025 | US$30.58 billion | OK |
| French Polynesia | 2025 | No source value | NA_SOURCE_MISSING |
| Gabon | 2025 | US$1.27 billion | OK |
| Gambia, The | 2025 | US$461.17 million | OK |
| Georgia | 2025 | US$1.48 billion | OK |
| Germany | 2025 | US$26.79 billion | OK |
| Ghana | 2025 | US$16.65 billion | OK |
| Gibraltar | 2025 | No source value | NA_SOURCE_MISSING |
| Greece | 2025 | US$6.92 billion | OK |
| Greenland | 2025 | No source value | NA_SOURCE_MISSING |
| Grenada | 2025 | US$34.91 million | OK |
| Guam | 2025 | No source value | NA_SOURCE_MISSING |
| Guatemala | 2025 | US$7.52 billion | OK |
| Guinea | 2025 | US$3.41 billion | OK |
| Guinea-Bissau | 2025 | US$613.90 million | OK |
| Guyana | 2025 | US$1.62 billion | OK |
| Haiti | 2025 | US$1.97 billion | OK |
| Honduras | 2025 | US$3.01 billion | OK |
| Hong Kong SAR, China | 2025 | US$158.22 million | OK |
| Hungary | 2025 | US$4.30 billion | OK |
| Iceland | 2025 | US$998.28 million | OK |
| India | 2025 | US$531.67 billion | OK |
| Indonesia | 2025 | US$152.94 billion | OK |
| Iran, Islamic Rep. | 2025 | US$47.44 billion | OK |
| Iraq | 2025 | US$10.67 billion | OK |
| Ireland | 2025 | US$4.84 billion | OK |
| Isle of Man | 2025 | No source value | NA_SOURCE_MISSING |
| Israel | 2025 | No source value | NA_SOURCE_MISSING |
| Italy | 2025 | US$33.91 billion | OK |
| Jamaica | 2025 | US$1.13 billion | OK |
| Japan | 2025 | No source value | NA_SOURCE_MISSING |
| Jordan | 2025 | US$2.77 billion | OK |
| Kazakhstan | 2025 | US$12.34 billion | OK |
| Kenya | 2025 | US$17.47 billion | OK |
| Kiribati | 2025 | No source value | NA_SOURCE_MISSING |
| Korea, Dem. People’s Rep. | 2025 | No source value | NA_SOURCE_MISSING |
| Korea, Rep. | 2025 | US$27.52 billion | OK |
| Kosovo | 2025 | US$549.47 million | OK |
| Kuwait | 2025 | US$852.83 million | OK |
| Kyrgyz Republic | 2025 | US$1.17 billion | OK |
| Lao PDR | 2025 | US$3.22 billion | OK |
| Latvia | 2025 | US$891.35 million | OK |
| Lebanon | 2025 | No source value | NA_SOURCE_MISSING |
| Lesotho | 2025 | US$138.38 million | OK |
| Liberia | 2025 | US$1.52 billion | OK |
| Libya | 2025 | US$1.82 billion | OK |
| Liechtenstein | 2025 | No source value | NA_SOURCE_MISSING |
| Lithuania | 2025 | US$1.49 billion | OK |
| Luxembourg | 2025 | US$133.74 million | OK |
| Macao SAR, China | 2025 | No source value | NA_SOURCE_MISSING |
| Madagascar | 2025 | US$3.51 billion | OK |
| Malawi | 2025 | US$2.54 billion | OK |
| Malaysia | 2025 | US$27.06 billion | OK |
| Maldives | 2025 | US$254.92 million | OK |
| Mali | 2025 | US$7.16 billion | OK |
| Malta | 2025 | US$125.36 million | OK |
| Marshall Islands | 2025 | No source value | NA_SOURCE_MISSING |
| Mauritania | 2025 | US$1.83 billion | OK |
| Mauritius | 2025 | US$575.35 million | OK |
| Mexico | 2025 | US$44.44 billion | OK |
| Micronesia, Fed. Sts. | 2025 | US$80.10 million | OK |
| Moldova | 2025 | US$1.10 billion | OK |
| Monaco | 2025 | No source value | NA_SOURCE_MISSING |
| Mongolia | 2025 | US$1.87 billion | OK |
| Montenegro | 2025 | US$207.61 million | OK |
| Morocco | 2025 | US$12.50 billion | OK |
| Mozambique | 2025 | US$5.32 billion | OK |
| Myanmar | 2025 | US$12.06 billion | OK |
| Namibia | 2025 | US$797.20 million | OK |
| Naoero | 2025 | No source value | NA_SOURCE_MISSING |
| Nepal | 2025 | US$8.65 billion | OK |
| Netherlands | 2025 | US$15.09 billion | OK |
| New Caledonia | 2025 | No source value | NA_SOURCE_MISSING |
| New Zealand | 2025 | No source value | NA_SOURCE_MISSING |
| Nicaragua | 2025 | US$2.57 billion | OK |
| Niger | 2025 | US$6.58 billion | OK |
| Nigeria | 2025 | US$132.44 billion | OK |
| North Macedonia | 2025 | US$711.32 million | OK |
| Northern Mariana Islands | 2025 | No source value | NA_SOURCE_MISSING |
| Norway | 2025 | US$5.58 billion | OK |
| Oman | 2025 | US$3.31 billion | OK |
| Pakistan | 2025 | US$92.96 billion | OK |
| Palau | 2025 | No source value | NA_SOURCE_MISSING |
| Panama | 2025 | US$2.27 billion | OK |
| Papua New Guinea | 2025 | No source value | NA_SOURCE_MISSING |
| Paraguay | 2025 | US$4.11 billion | OK |
| Peru | 2025 | US$18.37 billion | OK |
| Philippines | 2025 | US$36.58 billion | OK |
| Poland | 2025 | US$12.87 billion | OK |
| Portugal | 2025 | US$3.94 billion | OK |
| Puerto Rico (US) | 2025 | No source value | NA_SOURCE_MISSING |
| Qatar | 2025 | US$606.76 million | OK |
| Romania | 2025 | US$9.19 billion | OK |
| Russian Federation | 2025 | US$61.08 billion | OK |
| Rwanda | 2025 | US$2.93 billion | OK |
| Samoa | 2025 | US$65.71 million | OK |
| San Marino | 2025 | No source value | NA_SOURCE_MISSING |
| Sao Tome and Principe | 2025 | US$27.54 million | OK |
| Saudi Arabia | 2025 | US$25.47 billion | OK |
| Senegal | 2025 | US$4.29 billion | OK |
| Serbia | 2025 | US$2.21 billion | OK |
| Seychelles | 2025 | US$58.84 million | OK |
| Sierra Leone | 2025 | US$3.22 billion | OK |
| Singapore | 2025 | US$114.20 million | OK |
| Sint Maarten (Dutch part) | 2025 | No source value | NA_SOURCE_MISSING |
| Slovak Republic | 2025 | US$1.72 billion | OK |
| Slovenia | 2025 | US$890.55 million | OK |
| Solomon Islands | 2025 | No source value | NA_SOURCE_MISSING |
| Somalia, Fed. Rep. | 2025 | No source value | NA_SOURCE_MISSING |
| South Africa | 2025 | US$10.57 billion | OK |
| South Sudan | 2025 | No source value | NA_SOURCE_MISSING |
| Spain | 2025 | US$33.95 billion | OK |
| Sri Lanka | 2025 | US$6.84 billion | OK |
| St. Kitts and Nevis | 2025 | US$9.02 million | OK |
| St. Lucia | 2025 | US$49.82 million | OK |
| St. Martin (French part) | 2025 | No source value | NA_SOURCE_MISSING |
| St. Vincent and the Grenadines | 2025 | US$32.37 million | OK |
| Sudan | 2025 | US$13.05 billion | OK |
| Suriname | 2025 | No source value | NA_SOURCE_MISSING |
| Sweden | 2025 | US$5.64 billion | OK |
| Switzerland | 2025 | US$4.80 billion | OK |
| Syrian Arab Republic | 2025 | No source value | NA_SOURCE_MISSING |
| Tajikistan | 2025 | No source value | NA_SOURCE_MISSING |
| Tanzania | 2025 | US$18.51 billion | OK |
| Thailand | 2025 | US$42.48 billion | OK |
| Timor-Leste | 2025 | No source value | NA_SOURCE_MISSING |
| Togo | 2025 | US$1.72 billion | OK |
| Tonga | 2025 | No source value | NA_SOURCE_MISSING |
| Trinidad and Tobago | 2025 | No source value | NA_SOURCE_MISSING |
| Tunisia | 2025 | US$4.66 billion | OK |
| Turkiye | 2025 | US$66.43 billion | OK |
| Turkmenistan | 2025 | US$5.86 billion | OK |
| Turks and Caicos Islands | 2025 | No source value | NA_SOURCE_MISSING |
| Tuvalu | 2025 | No source value | NA_SOURCE_MISSING |
| Uganda | 2025 | US$11.86 billion | OK |
| Ukraine | 2025 | US$9.58 billion | OK |
| United Arab Emirates | 2025 | No source value | NA_SOURCE_MISSING |
| United Kingdom | 2025 | US$19.95 billion | OK |
| United States | 2025 | No source value | NA_SOURCE_MISSING |
| Uruguay | 2025 | US$4.06 billion | OK |
| Uzbekistan | 2025 | US$34.87 billion | OK |
| Vanuatu | 2025 | No source value | NA_SOURCE_MISSING |
| Venezuela, RB | 2025 | No source value | NA_SOURCE_MISSING |
| Viet Nam | 2025 | US$48.08 billion | OK |
| Virgin Islands (U.S.) | 2025 | No source value | NA_SOURCE_MISSING |
| West Bank and Gaza | 2025 | US$622.80 million | OK |
| Yemen, Rep. | 2025 | No source value | NA_SOURCE_MISSING |
| Zambia | 2025 | US$1.25 billion | OK |
| Zimbabwe | 2025 | US$2.79 billion | OK |
How to interpret the comparison
First, the sector includes agriculture, forestry, and fishing rather than farming alone. Second, value added is output minus intermediate consumption, not gross sales. Third, the unit is constant 2015 U.S. dollars, not current dollars or PPP.
Fourth, an absolute-value ranking is different from sector share of GDP or value added per worker. Fifth, the 55 missing rows must not be treated as zero. Sixth, a sum of the reporting countries should not be described as an official world aggregate.
Source and calculation
The source is World Bank World Development Indicators NV.AGR.TOTL.KD, Agriculture, forestry, and fishing, value added (constant 2015 US$). All comparisons use 2025 observations, and descriptive statistics and rankings use only the 162 economies with reported values.
Frequently Asked Questions
Is constant 2015 US$ the same as current-dollar value?
No. It removes price changes by expressing the series at a fixed 2015 price reference rather than at 2025 current prices.
Is agriculture value added the same as agricultural sales?
No. Value added is output minus the intermediate goods and services used in production.
Can the 55 source-missing economies be treated as zero?
No. Missing means no 2025 source value is available in this file; it is not a zero observation.
Related Articles
Green Map creates custom-edited map images using open geographic data sources such as geoBoundaries, Natural Earth, OpenStreetMap, and government open data. These maps are edited visual materials, not raw data files, and are provided for education, documents, presentations, and graphic reference.