Electric power transmission and distribution losses measure the share of electricity output that is lost while power moves from supply sources through transmission and distribution systems to consumers. The World Bank series contains 150 latest non-empty observations, including 41 from 2024 and 107 from 2023. Because the years differ, the 2024 same-year comparison is kept separate from the complete latest-observation list.
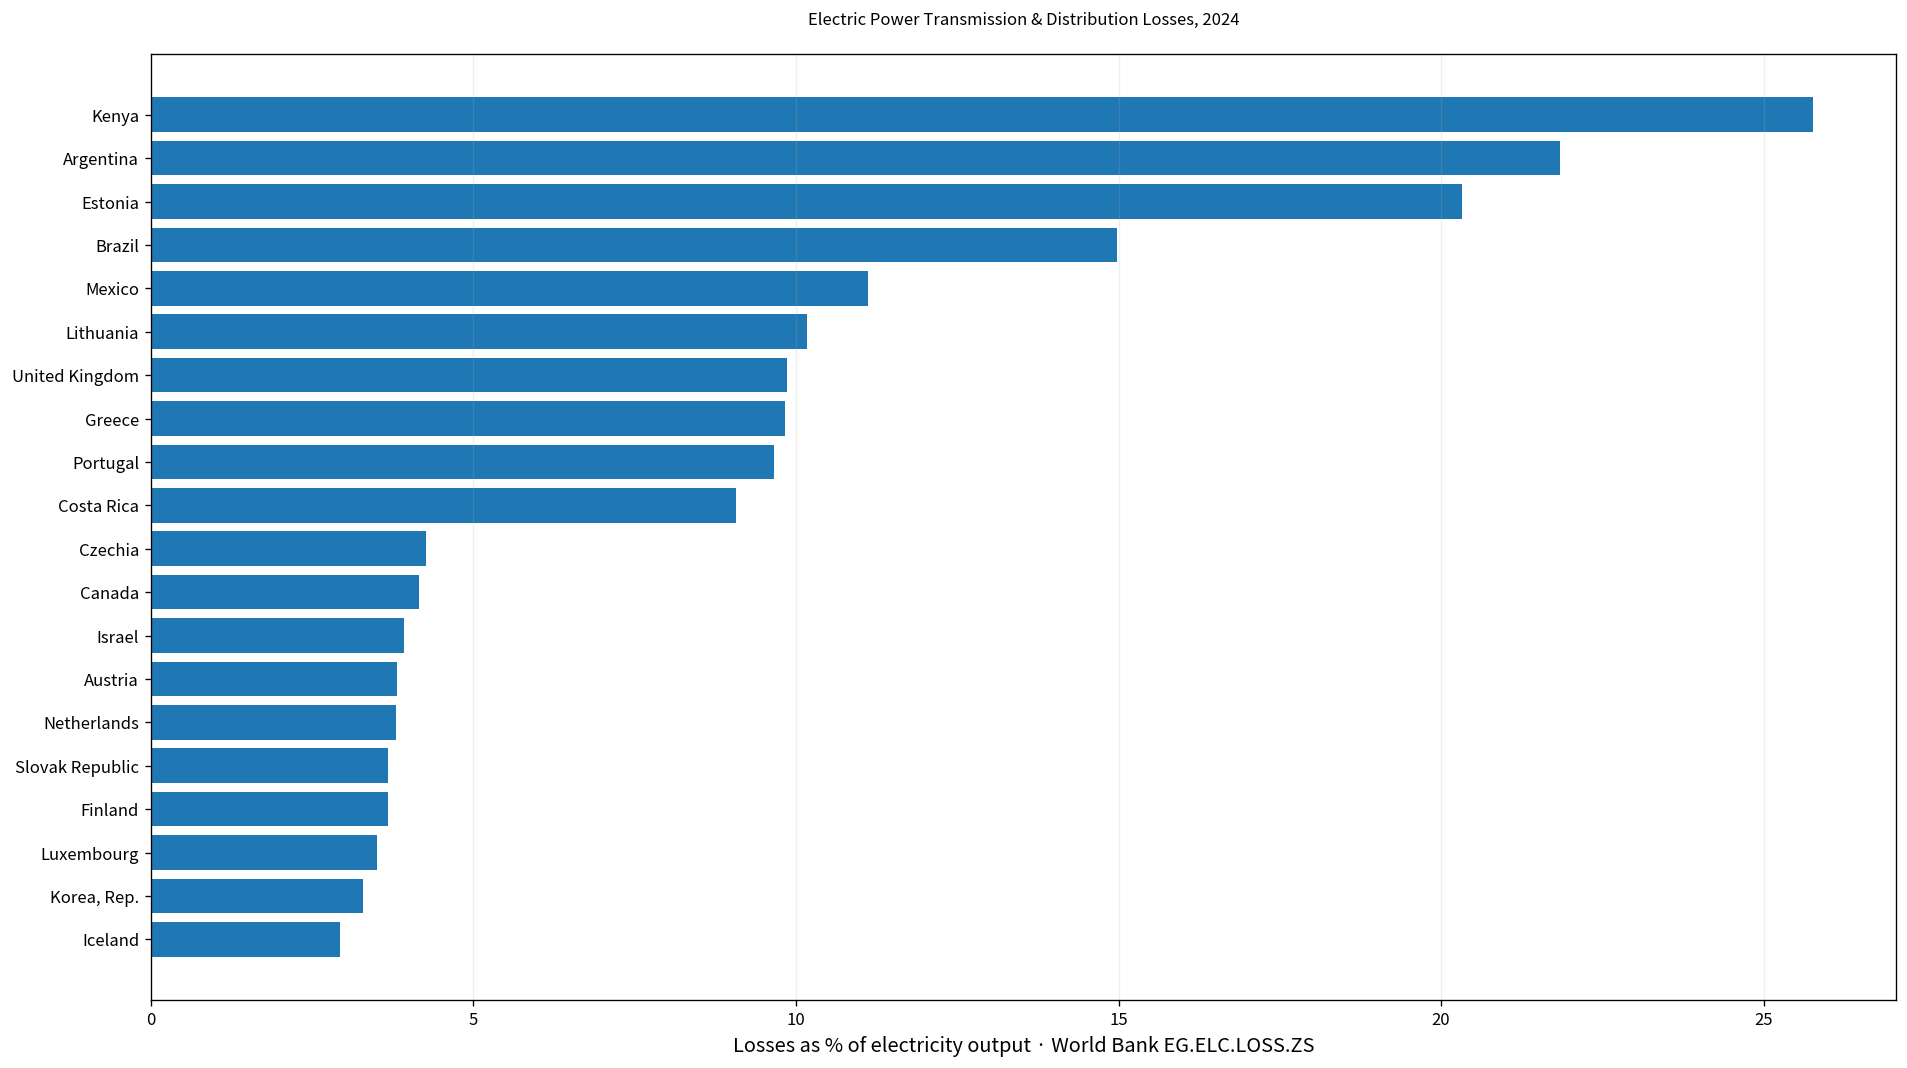
Table of Contents
What transmission and distribution losses include
World Bank documentation describes these losses as electricity lost in transmission between sources of supply and points of distribution, plus losses during distribution to consumers. The measure can include technical losses as well as nontechnical losses such as pilferage. It is expressed as a percentage of total electricity output.
A loss rate of 8% means that losses equivalent to about 8% of total output occurred before electricity reached effective end use. It is not a measure of power-plant thermal efficiency. It is also different from outage duration, electricity access, electricity prices, or the carbon intensity of generation.
Only 41 of the 150 latest observations are from 2024
Among the 150 latest observations, 41 are dated 2024 and 107 are dated 2023. One observation is from 2022 and another from 2014. The latest-value set is therefore mostly recent, but it is not a single-year dataset.
| Observation year | Economies/territories | Share of 150 |
|---|---|---|
| 2024 | 41 | 27.3% |
| 2023 | 107 | 71.3% |
| 2022 | 1 | 0.7% |
| 2014 | 1 | 0.7% |
The mixed-year set has a mean of 12.39% and a median of 9.79%, with values ranging from 0.23% to 61.81%. Very high 2023 observations, including Iraq at 61.81%, lift the overall mean, which is another reason to use same-year subsets for direct comparison.
The 2024 median is 5.91%
The 2024 subset contains 41 economies. Its mean is 7.54% and median 5.91%. The first quartile is 4.30% and the third quartile 8.29%, placing the middle half of observations roughly between 4% and 8%.
14 observations are below 5% and 35 are below 10%. 3 are at least 15% and 3 are at least 20%. Most 2024 observations are in single digits, but a small upper tail exceeds 20%.
Kenya is highest in 2024 at 25.76%
Kenya records 25.76%, followed by Argentina at 21.84% and Estonia at 20.33%. Brazil is at 14.97%, Mexico 11.11%, and Lithuania 10.17%. The United Kingdom, Greece, Portugal, and Costa Rica are also among the higher 2024 observations.
| 2024 rank | Economy/territory | Transmission and distribution losses |
|---|---|---|
| 1 | Kenya | 25.76% |
| 2 | Argentina | 21.84% |
| 3 | Estonia | 20.33% |
| 4 | Brazil | 14.97% |
| 5 | Mexico | 11.11% |
| 6 | Lithuania | 10.17% |
| 7 | United Kingdom | 9.85% |
| 8 | Greece | 9.83% |
| 9 | Portugal | 9.67% |
| 10 | Costa Rica | 9.07% |
| 11 | Spain | 8.29% |
| 12 | Turkiye | 8.27% |
| 13 | Ireland | 8.16% |
| 14 | Colombia | 7.78% |
| 15 | Hungary | 7.10% |
A high loss rate means a larger share of generated electricity is lost before reaching effective final delivery. The indicator does not identify a single cause. Transmission distance, voltage levels, network age, transformer losses, distribution design, metering issues, and nontechnical losses can all contribute.
Iceland is lowest in 2024 at 2.93%
Iceland records 2.93%, followed by Luxembourg at 3.50%, Finland at 3.67%, Slovak Republic at 3.67%, Netherlands at 3.80%, Austria at 3.82%, Israel at 3.92%, Canada at 4.15%, Czechia at 4.27%, and Belgium at 4.30%.
| Low-order position in 2024 | Economy/territory | Transmission and distribution losses |
|---|---|---|
| 1 | Iceland | 2.93% |
| 2 | Korea, Rep. | 3.29% |
| 3 | Luxembourg | 3.50% |
| 4 | Finland | 3.67% |
| 5 | Slovak Republic | 3.67% |
| 6 | Netherlands | 3.80% |
| 7 | Austria | 3.82% |
| 8 | Israel | 3.92% |
| 9 | Canada | 4.15% |
| 10 | Czechia | 4.27% |
| 11 | Belgium | 4.30% |
| 12 | Australia | 4.71% |
| 13 | Japan | 4.93% |
| 14 | Norway | 4.94% |
| 15 | Switzerland | 5.01% |
A low loss rate indicates that a smaller share of electricity output is lost in transmission and distribution. It does not by itself establish overall power-system quality. Reliability, outage frequency, access, affordability, and generation mix require separate indicators.
The 2023 group is much larger
The 2023 subset contains 107 economies, compared with only 41 in 2024. Its mean is 14.20% and median 11.27%, with a first quartile of 7.95% and third quartile of 18.23%. The mean is considerably higher than in 2024, but the country composition is also very different.
The highest 2023 values are Iraq at 61.81%, Benin at 58.62%, Niger at 45.78%, Congo, Rep. at 38.45%, and Honduras at 33.84%. At the lower end, Singapore records 0.23%, Bahrain 2.69%, Cyprus 3.04%, and China 3.43%.
| 2023 high-order position | Economy/territory | Transmission and distribution losses |
|---|---|---|
| 1 | Iraq | 61.81% |
| 2 | Benin | 58.62% |
| 3 | Niger | 45.78% |
| 4 | Congo, Rep. | 38.45% |
| 5 | Honduras | 33.84% |
| 6 | Togo | 32.45% |
| 7 | Yemen, Rep. | 31.19% |
| 8 | Eswatini | 28.12% |
| 9 | Namibia | 27.83% |
| 10 | Sudan | 27.07% |
| 11 | Jamaica | 26.89% |
| 12 | Chad | 23.63% |
| 13 | Zimbabwe | 23.00% |
| 14 | Cameroon | 21.97% |
| 15 | Syrian Arab Republic | 21.93% |
| 2023 low-order position | Economy/territory | Transmission and distribution losses |
|---|---|---|
| 1 | Singapore | 0.23% |
| 2 | Bahrain | 2.69% |
| 3 | Cyprus | 3.04% |
| 4 | China | 3.43% |
| 5 | South Sudan | 4.01% |
| 6 | Trinidad and Tobago | 4.16% |
| 7 | Hong Kong SAR, China | 4.27% |
| 8 | United Arab Emirates | 4.29% |
| 9 | Uzbekistan | 4.93% |
| 10 | Madagascar | 5.27% |
| 11 | Zambia | 5.34% |
| 12 | Mauritius | 5.73% |
| 13 | Qatar | 5.74% |
| 14 | Bulgaria | 5.88% |
| 15 | Lao PDR | 6.23% |
The 2023 and 2024 averages are not a time trend
The 2023 group contains 107 economies and the 2024 group only 41. Because the membership differs, the change in subgroup averages cannot be interpreted as a one-year global decline in power losses. A valid trend comparison would match the same economies across both years.
The underlying series uses the latest non-empty observation for each economy. That is useful for showing data availability, but it means a latest-value table and a same-year ranking answer different questions.
A high loss rate does not mean electricity output is low
The indicator is a ratio of losses to electricity output. A country with large generation can have low losses, and a country with modest generation can have high losses. It should not be confused with electricity production, electricity consumption per capita, or access to electricity.
A broader assessment of power-system performance can combine this measure with electricity consumption, access, outage indicators, generation mix, grid investment, and network reliability. Transmission and distribution losses provide one view of how efficiently generated electricity is delivered.
Technical and nontechnical losses matter
Technical losses arise from physical processes such as resistance in lines, transformer losses, and long-distance transmission. Nontechnical losses can include theft, illegal connections, faulty metering, and unbilled consumption. The World Bank indicator combines the total loss outcome rather than identifying the share attributable to each cause.
Two countries with the same 10% loss rate can therefore have very different underlying problems. Country-level diagnosis requires more detailed transmission, distribution, metering, and utility-performance information.
Complete list of the 150 latest observations
The table below lists the latest non-empty observation for every economy and territory in alphabetical order. The observation year is shown explicitly so 2023 and 2024 values are not mistaken for a single period. For a strict 2024 comparison, use only the rows dated 2024.
| Economy/territory | Observation year | Transmission and distribution losses |
|---|---|---|
| Albania | 2023 | 12.35% |
| Algeria | 2023 | 9.20% |
| Angola | 2023 | 11.27% |
| Argentina | 2024 | 21.84% |
| Armenia | 2023 | 6.70% |
| Australia | 2024 | 4.71% |
| Austria | 2024 | 3.82% |
| Azerbaijan | 2023 | 7.64% |
| Bahrain | 2023 | 2.69% |
| Bangladesh | 2023 | 7.90% |
| Belarus | 2023 | 6.89% |
| Belgium | 2024 | 4.30% |
| Benin | 2023 | 58.62% |
| Bolivia | 2023 | 8.95% |
| Bosnia and Herzegovina | 2023 | 7.24% |
| Botswana | 2023 | 20.64% |
| Brazil | 2024 | 14.97% |
| Brunei Darussalam | 2023 | 12.69% |
| Bulgaria | 2023 | 5.88% |
| Burkina Faso | 2023 | 17.10% |
| Cambodia | 2023 | 11.59% |
| Cameroon | 2023 | 21.97% |
| Canada | 2024 | 4.15% |
| Chad | 2023 | 23.63% |
| Chile | 2024 | 5.91% |
| China | 2023 | 3.43% |
| Colombia | 2024 | 7.78% |
| Congo, Dem. Rep. | 2023 | 9.10% |
| Congo, Rep. | 2023 | 38.45% |
| Costa Rica | 2024 | 9.07% |
| Cote d’Ivoire | 2023 | 13.68% |
| Croatia | 2023 | 10.33% |
| Cuba | 2023 | 18.74% |
| Curacao | 2023 | 10.92% |
| Cyprus | 2023 | 3.04% |
| Czechia | 2024 | 4.27% |
| Denmark | 2024 | 6.16% |
| Dominican Republic | 2023 | 12.80% |
| Ecuador | 2023 | 17.00% |
| Egypt, Arab Rep. | 2023 | 19.87% |
| El Salvador | 2023 | 9.77% |
| Equatorial Guinea | 2023 | 10.62% |
| Eritrea | 2023 | 11.75% |
| Estonia | 2024 | 20.33% |
| Eswatini | 2023 | 28.12% |
| Ethiopia | 2023 | 20.73% |
| Finland | 2024 | 3.67% |
| France | 2024 | 6.62% |
| Gabon | 2023 | 18.91% |
| Georgia | 2023 | 7.99% |
| Germany | 2024 | 5.12% |
| Ghana | 2023 | 11.25% |
| Gibraltar | 2023 | 16.45% |
| Greece | 2024 | 9.83% |
| Guatemala | 2023 | 12.44% |
| Haiti | 2022 | 14.69% |
| Honduras | 2023 | 33.84% |
| Hong Kong SAR, China | 2023 | 4.27% |
| Hungary | 2024 | 7.10% |
| Iceland | 2024 | 2.93% |
| India | 2023 | 14.16% |
| Indonesia | 2023 | 6.45% |
| Iran, Islamic Rep. | 2023 | 10.05% |
| Iraq | 2023 | 61.81% |
| Ireland | 2024 | 8.16% |
| Israel | 2024 | 3.92% |
| Italy | 2024 | 7.08% |
| Jamaica | 2023 | 26.89% |
| Japan | 2024 | 4.93% |
| Jordan | 2023 | 10.96% |
| Kazakhstan | 2023 | 9.72% |
| Kenya | 2024 | 25.76% |
| Korea, Dem. People’s Rep. | 2023 | 15.54% |
| Korea, Rep. | 2024 | 3.29% |
| Kosovo | 2014 | 15.05% |
| Kuwait | 2023 | 9.04% |
| Kyrgyz Republic | 2023 | 18.29% |
| Lao PDR | 2023 | 6.23% |
| Latvia | 2024 | 5.76% |
| Lebanon | 2023 | 9.64% |
| Libya | 2023 | 20.17% |
| Lithuania | 2024 | 10.17% |
| Luxembourg | 2024 | 3.50% |
| Madagascar | 2023 | 5.27% |
| Malaysia | 2023 | 6.90% |
| Malta | 2023 | 8.32% |
| Mauritius | 2023 | 5.73% |
| Mexico | 2024 | 11.11% |
| Moldova | 2023 | 9.00% |
| Mongolia | 2023 | 14.22% |
| Montenegro | 2023 | 11.32% |
| Morocco | 2023 | 18.19% |
| Mozambique | 2023 | 16.62% |
| Myanmar | 2023 | 7.81% |
| Namibia | 2023 | 27.83% |
| Nepal | 2023 | 14.41% |
| Netherlands | 2024 | 3.80% |
| New Zealand | 2024 | 6.71% |
| Nicaragua | 2023 | 21.46% |
| Niger | 2023 | 45.78% |
| Nigeria | 2023 | 14.15% |
| North Macedonia | 2023 | 13.91% |
| Norway | 2024 | 4.94% |
| Oman | 2023 | 7.48% |
| Pakistan | 2023 | 15.35% |
| Panama | 2023 | 6.58% |
| Paraguay | 2023 | 11.88% |
| Peru | 2023 | 11.34% |
| Philippines | 2023 | 9.99% |
| Poland | 2024 | 6.83% |
| Portugal | 2024 | 9.67% |
| Qatar | 2023 | 5.74% |
| Romania | 2023 | 9.81% |
| Russian Federation | 2023 | 8.39% |
| Rwanda | 2023 | 18.27% |
| Saudi Arabia | 2023 | 9.07% |
| Senegal | 2023 | 13.06% |
| Serbia | 2023 | 10.32% |
| Singapore | 2023 | 0.23% |
| Slovak Republic | 2024 | 3.67% |
| Slovenia | 2024 | 5.09% |
| South Africa | 2023 | 10.25% |
| South Sudan | 2023 | 4.01% |
| Spain | 2024 | 8.29% |
| Sri Lanka | 2023 | 9.22% |
| Sudan | 2023 | 27.07% |
| Suriname | 2023 | 11.60% |
| Sweden | 2024 | 5.48% |
| Switzerland | 2024 | 5.01% |
| Syrian Arab Republic | 2023 | 21.93% |
| Tajikistan | 2023 | 17.32% |
| Tanzania | 2023 | 16.78% |
| Thailand | 2023 | 7.16% |
| Togo | 2023 | 32.45% |
| Trinidad and Tobago | 2023 | 4.16% |
| Tunisia | 2023 | 18.34% |
| Turkiye | 2024 | 8.27% |
| Turkmenistan | 2023 | 9.64% |
| Uganda | 2023 | 18.93% |
| Ukraine | 2023 | 10.17% |
| United Arab Emirates | 2023 | 4.29% |
| United Kingdom | 2024 | 9.85% |
| United States | 2024 | 5.31% |
| Uruguay | 2023 | 9.69% |
| Uzbekistan | 2023 | 4.93% |
| Venezuela, RB | 2023 | 21.42% |
| Viet Nam | 2023 | 6.58% |
| Yemen, Rep. | 2023 | 31.19% |
| Zambia | 2023 | 5.34% |
| Zimbabwe | 2023 | 23.00% |
How to interpret the comparison
First, the 150 latest observations do not all share one year. Second, the indicator measures grid losses, not generation efficiency. Third, high losses can reflect both technical and nontechnical factors. Fourth, annual subgroup averages are not a time series unless the same economies are matched.
Electricity statistics can also be revised. A detailed country analysis should check the most recent World Bank series and utility or national energy statistics on transmission and distribution performance.
Source and calculation
The source is World Bank World Development Indicators EG.ELC.LOSS.ZS, Electric power transmission and distribution losses (% of output). The 2024 mean, median, quartiles, thresholds, and rankings are calculated from the 41 observations dated 2024.
Frequently Asked Questions
Are transmission and distribution losses the same as power-plant efficiency?
No. They measure electricity lost in the grid after generation, not the thermal efficiency of power generation.
What is the 2024 median loss rate?
The median across the 41 observations dated 2024 is 5.91%, while the mean is 7.54%.
Can all 150 latest observations be ranked as 2024 data?
No. Only 41 are from 2024, while 107 are from 2023 and two observations are older.
Related Articles
Green Map creates custom-edited map images using open geographic data sources such as geoBoundaries, Natural Earth, OpenStreetMap, and government open data. These maps are edited visual materials, not raw data files, and are provided for education, documents, presentations, and graphic reference.