Claims on the private sector relative to broad money describe how the ratio between financial-system claims on the private sector and the broad money stock changes over time. The World Bank series has 166 latest non-empty observations, including 88 from 2025 and 25 from 2024. Because the observation years differ, the full latest-value list and the same-year 2025 comparison are treated separately.
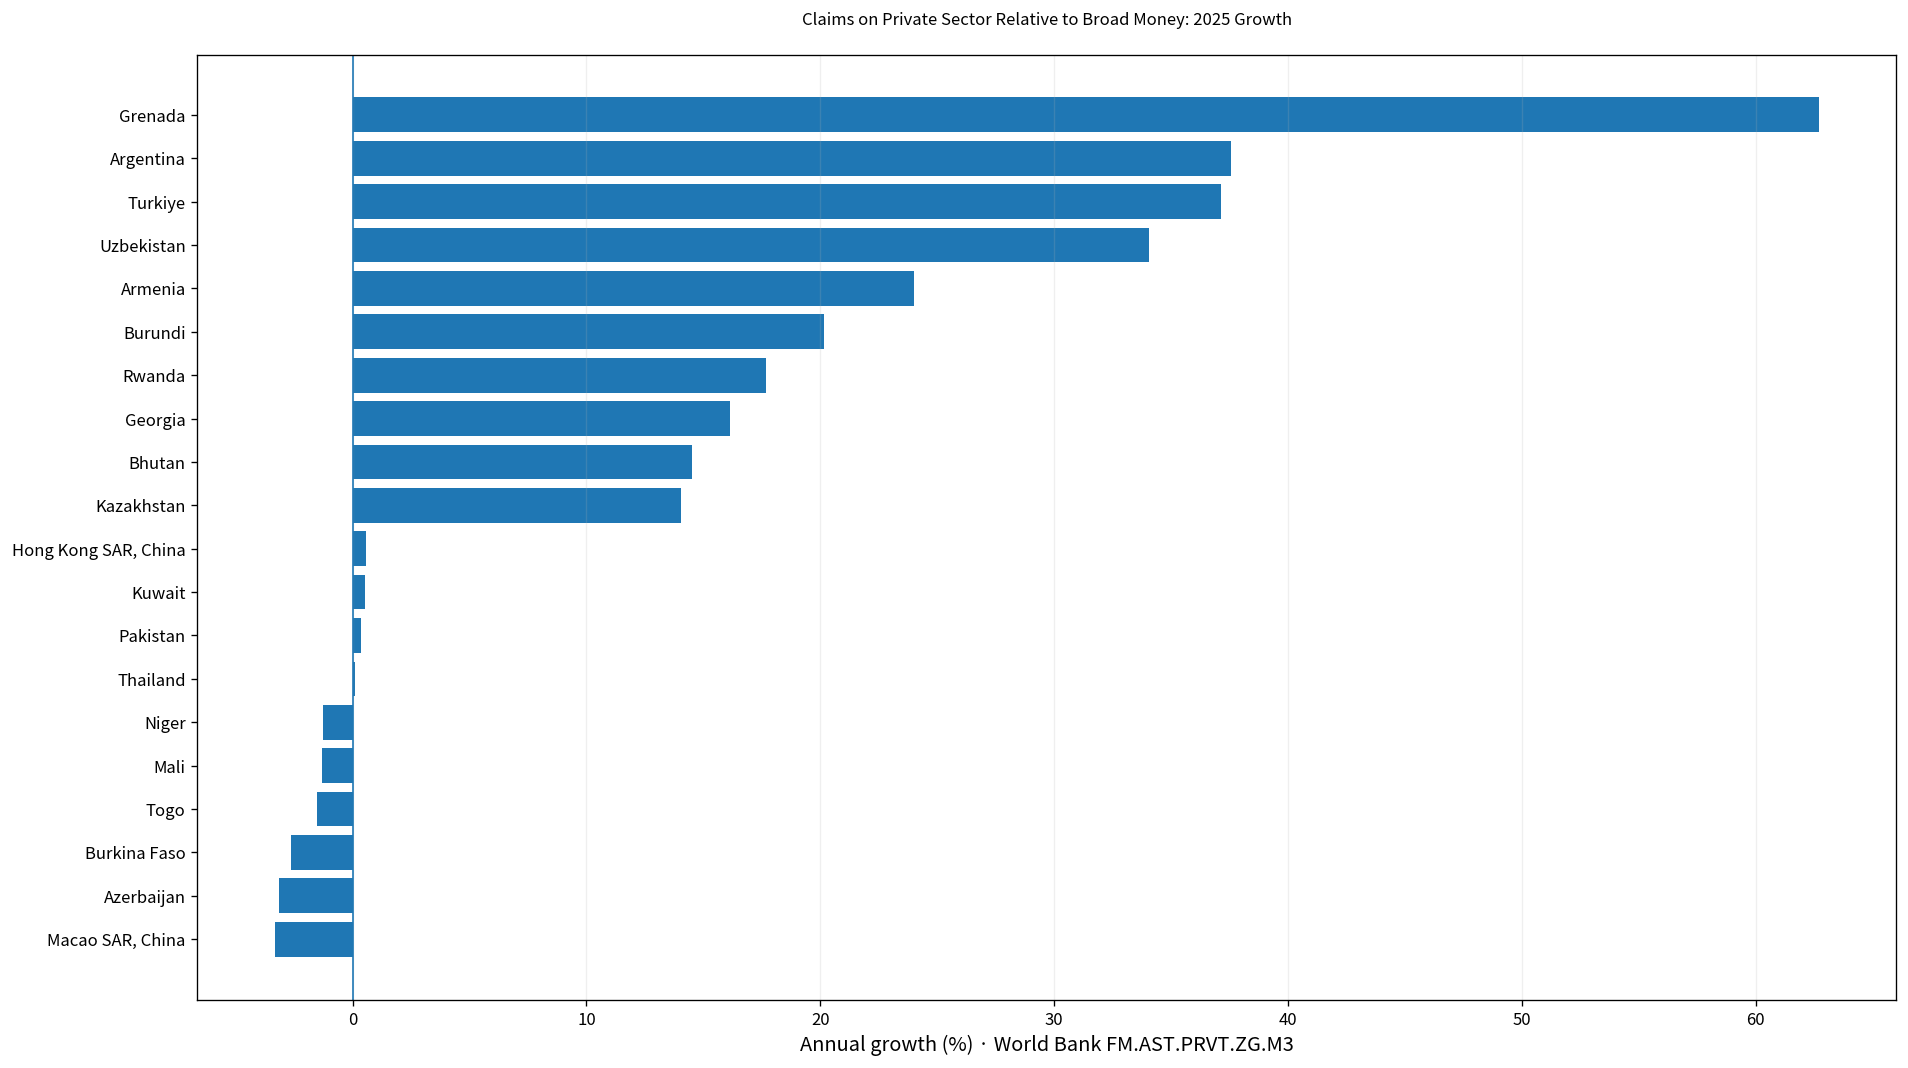
Table of Contents
This indicator is not simply private credit growth
World Bank metadata describes claims on the private sector as gross credit from the financial system to individuals, enterprises, certain nonfinancial public entities, and financial institutions not included elsewhere. Broad money combines currency and other highly liquid financial instruments held by money-holding sectors.
FM.AST.PRVT.ZG.M3 reports the annual percentage growth in the ratio of claims on the private sector to broad money. A value of 10% therefore does not necessarily mean that private-sector claims themselves rose by exactly 10%. The numerator and denominator can both change, and the indicator reflects their relative movement.
The same logic applies to negative values. A negative rate does not prove that claims fell in absolute terms; claims may have increased while broad money expanded even faster. This is why the measure should not be substituted for bank-credit growth, private credit as a share of GDP, or the level of broad money.
The 166 latest observations span 1989 to 2025
88 latest observations are dated 2025 and 25 are dated 2024. There are 14 observations from 2023 and 8 from 2022, plus smaller groups from earlier years. The oldest latest observation in the data is from 1989.
| Observation year | Economies/territories | Share of 166 |
|---|---|---|
| 2025 | 88 | 53.0% |
| 2024 | 25 | 15.1% |
| 2023 | 14 | 8.4% |
| 2022 | 8 | 4.8% |
| 2021 | 6 | 3.6% |
| 2020 | 4 | 2.4% |
| 2019 | 4 | 2.4% |
| 2018 | 1 | 0.6% |
| 2017 | 2 | 1.2% |
| 2016 | 3 | 1.8% |
| 2015 | 1 | 0.6% |
| 2014 | 1 | 0.6% |
| 2013 | 2 | 1.2% |
| 2011 | 1 | 0.6% |
| 2010 | 1 | 0.6% |
| 2009 | 2 | 1.2% |
| 2008 | 2 | 1.2% |
| 1989 | 1 | 0.6% |
Across the mixed-year set, the simple mean is 9.94% and the median 5.29%. The range runs from -25.95% to 421.69%. Those figures describe a collection of latest observations from different periods, not a current global average.
The 2025 median is 5.41% and the mean is 7.11%
The same-year 2025 subset contains 88 economies. Its mean is 7.11% and median 5.41%. The first quartile is 1.99% and the third quartile 7.80%.
82 observations are positive and 6 are negative. There are no exact zeros. 13 economies are at or above 10%, and 6 are at or above 20%. Most of the distribution is positive and in single digits, but the upper tail is much wider.
Grenada is highest in 2025 at 62.71%
Grenada records 62.71%, followed by Argentina at 37.58%, Turkiye at 37.16%, Uzbekistan at 34.05%, Armenia at 24.02%, and Burundi at 20.15%. Rwanda, Georgia, Bhutan, and Kazakhstan are also among the higher 2025 observations.
| 2025 rank | Economy | Annual growth in the ratio |
|---|---|---|
| 1 | Grenada | 62.71% |
| 2 | Argentina | 37.58% |
| 3 | Turkiye | 37.16% |
| 4 | Uzbekistan | 34.05% |
| 5 | Armenia | 24.02% |
| 6 | Burundi | 20.15% |
| 7 | Rwanda | 17.66% |
| 8 | Georgia | 16.13% |
| 9 | Bhutan | 14.53% |
| 10 | Kazakhstan | 14.05% |
| 11 | Moldova | 12.54% |
| 12 | North Macedonia | 10.97% |
| 13 | Suriname | 10.10% |
| 14 | Ecuador | 9.85% |
| 15 | Benin | 9.65% |
A high value means claims on the private sector increased relative to broad money more rapidly than in the previous year. It does not, by itself, identify the cause. Credit expansion, the pace of broad-money growth, and changes in the financial system’s balance-sheet structure can all affect the ratio.
Six 2025 observations are negative
Macao SAR, China is lowest at -3.33%, followed by Azerbaijan at -3.14%, Burkina Faso at -2.62%, Togo at -1.51%, Mali at -1.29%, and Niger at -1.25%. These are the only negative observations in the 2025 subset.
| Low-order position in 2025 | Economy | Annual growth in the ratio |
|---|---|---|
| 1 | Macao SAR, China | -3.33% |
| 2 | Azerbaijan | -3.14% |
| 3 | Burkina Faso | -2.62% |
| 4 | Togo | -1.51% |
| 5 | Mali | -1.29% |
| 6 | Niger | -1.25% |
| 7 | Thailand | 0.10% |
| 8 | Pakistan | 0.36% |
| 9 | Kuwait | 0.52% |
| 10 | Hong Kong SAR, China | 0.57% |
| 11 | Mozambique | 0.71% |
| 12 | Guinea-Bissau | 0.76% |
| 13 | United States | 0.79% |
| 14 | Dominica | 0.83% |
| 15 | Brunei Darussalam | 1.08% |
A negative value means the claims-to-broad-money ratio decreased from the previous year. That can occur because claims fell, because broad money grew faster, or because both changed at different rates. Interpreting the direction requires looking at the numerator and denominator separately.
Most 2025 observations are between roughly 2% and 8%
The first quartile is 1.99% and the third quartile 7.80%, which places the middle half of observations in a relatively narrow single-digit band. Thailand at 0.10%, Pakistan at 0.36%, Kuwait at 0.52%, and Hong Kong SAR, China at 0.57% show almost no change in the ratio, while the upper tail extends far beyond the median.
This shape is why the mean alone is not enough. The median describes the typical center more robustly, while the high-end ranking identifies economies where the relationship between claims and broad money shifted unusually quickly.
Why 2024 and 2025 should not be merged into one ranking
The 2024 subset contains 25 observations, with a mean of 5.99% and a median of 5.10%. Its range is -1.16% to 23.98%. Combining 2024 and 2025 into one current ranking would mix different credit and monetary conditions.
Older latest observations require even more caution. A value from 2008, 2010, or 1989 is historically valid but not a measure of present-day financial conditions. Keeping the observation year beside every value preserves the difference between data availability and current comparability.
Looking at claims and broad money separately changes the interpretation
Claims on the private sector relate to credit provided through the financial system. Broad money measures a broad pool of liquid monetary assets. The ratio between them compresses two moving quantities into a single relationship, so analysts need both series to understand why the ratio changed.
For example, claims can rise while the ratio grows slowly if broad money also expands quickly. Conversely, rapid claims growth combined with slower broad-money growth can push the ratio upward sharply. The indicator can therefore provide context on financial deepening or relative credit expansion, but it is not sufficient on its own for assessing financial risk.
Complete list of the 166 latest observations
The table below lists the latest non-empty observation for each economy in alphabetical order. The original observation year is displayed for every row. For a strict same-year comparison, use only the rows dated 2025.
| Economy | Observation year | Growth in claims-to-broad-money ratio |
|---|---|---|
| Afghanistan | 2020 | 0.01% |
| Albania | 2024 | 5.10% |
| Algeria | 2025 | 1.99% |
| Angola | 2025 | 5.49% |
| Antigua and Barbuda | 2025 | 1.42% |
| Argentina | 2025 | 37.58% |
| Armenia | 2025 | 24.02% |
| Aruba | 2023 | 5.25% |
| Australia | 2025 | 7.27% |
| Azerbaijan | 2025 | -3.14% |
| Bahamas, The | 2023 | 0.30% |
| Bahrain | 2015 | 6.23% |
| Bangladesh | 2025 | 4.56% |
| Barbados | 2023 | 1.57% |
| Belarus | 2021 | 6.98% |
| Belize | 2025 | 4.59% |
| Benin | 2025 | 9.65% |
| Bhutan | 2025 | 14.53% |
| Bolivia | 2025 | 3.07% |
| Bosnia and Herzegovina | 2025 | 6.25% |
| Botswana | 2025 | 2.39% |
| Brazil | 2025 | 4.80% |
| Brunei Darussalam | 2025 | 1.08% |
| Bulgaria | 2024 | 8.17% |
| Burkina Faso | 2025 | -2.62% |
| Burundi | 2025 | 20.15% |
| Cabo Verde | 2025 | 4.11% |
| Cambodia | 2025 | 6.44% |
| Cameroon | 2019 | 0.32% |
| Canada | 2008 | 6.07% |
| Central African Republic | 2022 | 6.12% |
| Chad | 2021 | 11.95% |
| Chile | 2025 | 2.05% |
| China | 2024 | 5.76% |
| Colombia | 2025 | 9.02% |
| Comoros | 2024 | 0.62% |
| Congo, Dem. Rep. | 2022 | 16.26% |
| Congo, Rep. | 2023 | 0.91% |
| Costa Rica | 2025 | 3.60% |
| Cote d’Ivoire | 2025 | 6.42% |
| Czechia | 2024 | 3.28% |
| Denmark | 2024 | 5.81% |
| Djibouti | 2025 | 6.93% |
| Dominica | 2025 | 0.83% |
| Dominican Republic | 2025 | 7.74% |
| Ecuador | 2025 | 9.85% |
| Egypt, Arab Rep. | 2025 | 7.34% |
| El Salvador | 2025 | 6.82% |
| Equatorial Guinea | 2023 | -25.95% |
| Eritrea | 2014 | 9.01% |
| Eswatini | 2023 | 7.24% |
| Ethiopia | 2008 | 17.72% |
| Fiji | 2024 | 9.39% |
| Gabon | 2019 | 4.33% |
| Gambia, The | 2024 | 3.66% |
| Georgia | 2025 | 16.13% |
| Ghana | 2024 | 8.16% |
| Grenada | 2025 | 62.71% |
| Guatemala | 2025 | 5.76% |
| Guinea | 2025 | 4.64% |
| Guinea-Bissau | 2025 | 0.76% |
| Guyana | 2025 | 8.00% |
| Haiti | 2024 | -1.16% |
| Honduras | 2025 | 6.29% |
| Hong Kong SAR, China | 2025 | 0.57% |
| Hungary | 2024 | 3.64% |
| Iceland | 2025 | 8.19% |
| India | 2022 | 6.54% |
| Indonesia | 2025 | 5.77% |
| Iran, Islamic Rep. | 2016 | 20.07% |
| Iraq | 2024 | 3.57% |
| Israel | 2025 | 6.49% |
| Jamaica | 2025 | 4.90% |
| Japan | 2025 | 1.95% |
| Jordan | 2025 | 1.91% |
| Kazakhstan | 2025 | 14.05% |
| Kenya | 2023 | 11.18% |
| Korea, Rep. | 2024 | 4.13% |
| Kosovo | 2024 | 15.85% |
| Kuwait | 2025 | 0.52% |
| Kyrgyz Republic | 2023 | 12.11% |
| Lao PDR | 2010 | 24.49% |
| Lebanon | 2017 | 2.50% |
| Lesotho | 2021 | 3.82% |
| Liberia | 2022 | 18.38% |
| Libya | 2022 | 4.65% |
| Macao SAR, China | 2025 | -3.33% |
| Madagascar | 2024 | 5.72% |
| Malawi | 2024 | 9.60% |
| Malaysia | 2025 | 6.10% |
| Maldives | 2025 | 7.63% |
| Mali | 2025 | -1.29% |
| Mauritania | 2019 | 9.42% |
| Mauritius | 2025 | 5.23% |
| Mexico | 2025 | 3.39% |
| Micronesia, Fed. Sts. | 2021 | 0.56% |
| Moldova | 2025 | 12.54% |
| Mongolia | 2024 | 23.98% |
| Montenegro | 2024 | 11.76% |
| Morocco | 2025 | 1.99% |
| Mozambique | 2025 | 0.71% |
| Myanmar | 2020 | 2.02% |
| Namibia | 2022 | 3.35% |
| Nepal | 2025 | 4.93% |
| New Zealand | 2025 | 5.89% |
| Nicaragua | 2023 | 12.04% |
| Niger | 2025 | -1.25% |
| Nigeria | 2022 | 5.72% |
| North Macedonia | 2025 | 10.97% |
| Norway | 2024 | 5.93% |
| Oman | 2018 | 6.13% |
| Pakistan | 2025 | 0.36% |
| Panama | 2009 | 2.38% |
| Papua New Guinea | 2020 | 2.18% |
| Paraguay | 2025 | 8.05% |
| Peru | 2023 | -0.00% |
| Philippines | 2023 | 5.18% |
| Poland | 2024 | 1.84% |
| Qatar | 2025 | 5.87% |
| Romania | 2025 | 3.12% |
| Russian Federation | 2021 | 12.58% |
| Rwanda | 2025 | 17.66% |
| Samoa | 2009 | 0.70% |
| Sao Tome and Principe | 2023 | -11.16% |
| Saudi Arabia | 2017 | -0.65% |
| Senegal | 2025 | 8.19% |
| Serbia | 2025 | 9.56% |
| Seychelles | 2016 | 3.93% |
| Sierra Leone | 2025 | 9.56% |
| Singapore | 2020 | 1.48% |
| Solomon Islands | 2024 | 2.32% |
| Somalia, Fed. Rep. | 1989 | 100.06% |
| South Africa | 2025 | 5.49% |
| South Sudan | 2025 | 5.33% |
| Sri Lanka | 2019 | 3.55% |
| St. Kitts and Nevis | 2025 | 4.08% |
| St. Lucia | 2025 | 4.81% |
| St. Vincent and the Grenadines | 2025 | 4.20% |
| Sudan | 2021 | 43.61% |
| Suriname | 2025 | 10.10% |
| Sweden | 2024 | 1.51% |
| Switzerland | 2016 | 3.37% |
| Syrian Arab Republic | 2011 | 2.59% |
| Tajikistan | 2023 | 14.55% |
| Tanzania | 2024 | 7.86% |
| Thailand | 2025 | 0.10% |
| Timor-Leste | 2025 | 7.14% |
| Togo | 2025 | -1.51% |
| Tonga | 2025 | 2.14% |
| Trinidad and Tobago | 2025 | 3.56% |
| Tunisia | 2025 | 1.93% |
| Turkiye | 2025 | 37.16% |
| Uganda | 2025 | 7.39% |
| Ukraine | 2025 | 1.32% |
| United Arab Emirates | 2025 | 6.28% |
| United Kingdom | 2024 | 0.06% |
| United States | 2025 | 0.79% |
| Uruguay | 2025 | 3.87% |
| Uzbekistan | 2025 | 34.05% |
| Vanuatu | 2024 | 3.31% |
| Venezuela, RB | 2013 | 34.44% |
| Viet Nam | 2022 | 11.89% |
| West Bank and Gaza | 2025 | 1.71% |
| Yemen, Rep. | 2013 | 5.17% |
| Zambia | 2025 | 6.59% |
| Zimbabwe | 2023 | 421.69% |
How to interpret the data
First, this is growth in a ratio, not simply growth in private credit. Second, the 166 latest observations do not share one year, so they should be separated from the 88 observations dated 2025. Third, a high or negative one-year value does not by itself establish a monetary-policy stance or a change in financial stability.
International monetary data can also be revised. A detailed country analysis should examine the level and growth of claims, broad money, bank credit, interest rates, inflation, and output together with the latest official monetary statistics.
Source and calculation
The source is World Bank World Development Indicators FM.AST.PRVT.ZG.M3, Claims on private sector (annual growth as % of broad money). The 2025 mean, median, quartiles, sign counts, and rankings are calculated from the 88 observations dated 2025.
Frequently Asked Questions
Is this the same as private credit growth?
No. It is the annual growth in the ratio of claims on the private sector to broad money, so it reflects the relative movement of both quantities.
What is the 2025 median?
The median across the 88 observations dated 2025 is 5.41%, while the mean is 7.11%.
Does a negative value mean private-sector claims definitely fell?
No. Claims can increase while broad money grows even faster, causing the claims-to-broad-money ratio to decline.
Related Articles
Green Map creates custom-edited map images using open geographic data sources such as geoBoundaries, Natural Earth, OpenStreetMap, and government open data. These maps are edited visual materials, not raw data files, and are provided for education, documents, presentations, and graphic reference.