Preprimary gross enrollment measures total enrollment in preprimary education relative to the population of the official preprimary-school age. The World Bank series contains 207 latest non-empty economy and territory observations, but they do not share one reference year. The largest groups are 2020 with 77 observations and 2021 with 67; only 4 are dated 2022. The full latest-observation list should therefore not be presented as a 2022 global ranking.
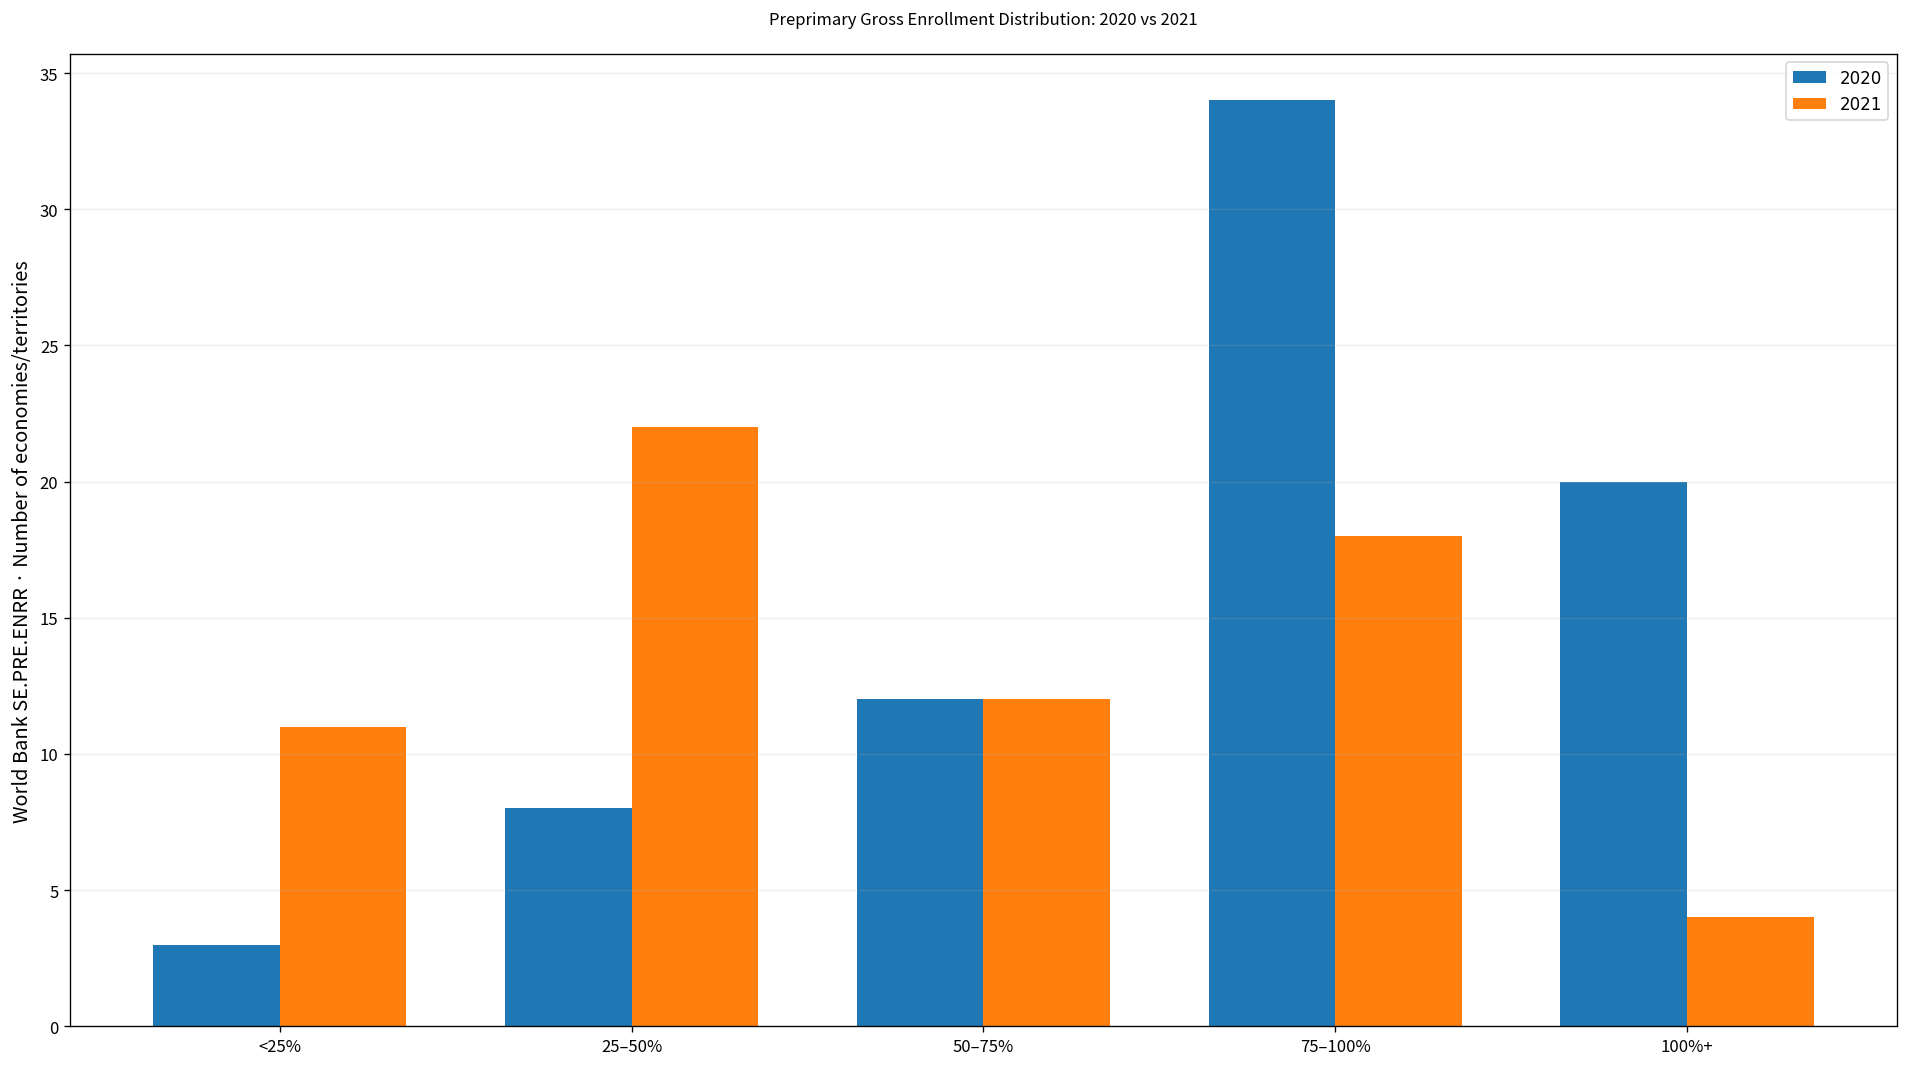
Table of Contents
Why gross enrollment can exceed 100%
A gross enrollment ratio counts all children enrolled in the education level, regardless of whether they are exactly within the official age range, and compares that enrollment with the population of official preprimary age. Children who enter early or late, repeat a level, or fall outside the standard age range can therefore push the ratio above 100%.
A reading of 110% should not be interpreted as a simple statement that every eligible child is enrolled plus another 10%. Population estimates, age distribution, enrollment timing, and education-system structure all matter. Values above 100% are valid for a gross ratio, but they are not equivalent to a net enrollment rate.
The 207 latest observations range from 1983 to 2022
Among the 207 latest observations, 2020 accounts for 77 and 2021 for 67. There are 13 observations from 2019, 10 from 2018, and only 4 from 2022. A small number of economies have much older latest values, including observations from the 1980s and 1990s.
| Observation year | Economies/territories | Share of 207 |
|---|---|---|
| 2022 | 4 | 1.9% |
| 2021 | 67 | 32.4% |
| 2020 | 77 | 37.2% |
| 2019 | 13 | 6.3% |
| 2018 | 10 | 4.8% |
| 2017 | 5 | 2.4% |
| 2016 | 5 | 2.4% |
| 2015 | 7 | 3.4% |
| 2014 | 5 | 2.4% |
| 2013 | 1 | 0.5% |
| 2011 | 4 | 1.9% |
| 2006 | 1 | 0.5% |
| 1996 | 1 | 0.5% |
| 1993 | 1 | 0.5% |
| 1992 | 1 | 0.5% |
| 1986 | 1 | 0.5% |
| 1985 | 2 | 1.0% |
| 1984 | 1 | 0.5% |
| 1983 | 1 | 0.5% |
The mixed-year collection has a mean of 64.03% and a median of 70.25%. Its maximum, Andorra at 167.54%, is from 1983, while the minimum, Afghanistan at 1.06%, is from 2011. Those extremes are historically valid observations but should not be treated as a same-period global ranking.
The 2020 median is 91.78%
The 2020 same-year subset contains 77 observations. The mean is 83.46% and the median 91.78%. The first quartile is 71.84% and the third quartile 100.39%. 41 observations are at least 90%, 20 are at least 100%, and 11 are below 50%.
Australia is highest in the 2020 group at 160.21%, followed by Grenada at 130.81%, Liberia at 128.48%, and Ghana at 116.14%. At the lower end, Congo, Dem. Rep. records 6.86%, Mali 7.60%, and South Africa 17.55%.
| 2020 high-order position | Economy/territory | Preprimary gross enrollment |
|---|---|---|
| 1 | Australia | 160.21% |
| 2 | Grenada | 130.81% |
| 3 | Liberia | 128.48% |
| 4 | Ghana | 116.14% |
| 5 | St. Vincent and the Grenadines | 113.83% |
| 6 | Czechia | 113.53% |
| 7 | Malta | 112.49% |
| 8 | Belgium | 112.43% |
| 9 | Israel | 111.23% |
| 10 | Germany | 108.03% |
| 11 | France | 106.66% |
| 12 | United Kingdom | 105.76% |
| 13 | Denmark | 103.20% |
| 14 | Switzerland | 102.87% |
| 15 | Austria | 102.86% |
| 2020 low-order position | Economy/territory | Preprimary gross enrollment |
|---|---|---|
| 1 | Congo, Dem. Rep. | 6.86% |
| 2 | Mali | 7.60% |
| 3 | South Africa | 17.55% |
| 4 | Panama | 26.97% |
| 5 | Timor-Leste | 27.87% |
| 6 | North Macedonia | 31.04% |
| 7 | Naoero | 32.15% |
| 8 | Turkmenistan | 35.91% |
| 9 | Turkiye | 39.75% |
| 10 | Tonga | 48.32% |
| 11 | Canada | 48.92% |
| 12 | Paraguay | 51.09% |
| 13 | Bahrain | 52.60% |
| 14 | Kuwait | 60.25% |
| 15 | Brunei Darussalam | 63.48% |
The 2021 median is 51.69%
The 2021 subset contains 67 observations, with a mean of 54.82% and a median of 51.69%. The first quartile is 28.99% and the third quartile 86.17%. 14 are at least 90%, 4 are at least 100%, and 33 are below 50%.
Gibraltar is highest in the 2021 group at 105.60%, followed by Seychelles at 104.29%, Mauritius at 102.00%, and San Marino at 100.13%. The lowest observations include Somalia, Fed. Rep. at 1.15%, Chad at 1.27%, Micronesia, Fed. Sts. at 5.89%, Burkina Faso at 6.50%, and Niger at 7.03%.
| 2021 high-order position | Economy/territory | Preprimary gross enrollment |
|---|---|---|
| 1 | Gibraltar | 105.60% |
| 2 | Seychelles | 104.29% |
| 3 | Mauritius | 102.00% |
| 4 | San Marino | 100.13% |
| 5 | Cuba | 99.62% |
| 6 | Belarus | 96.77% |
| 7 | Peru | 96.44% |
| 8 | Turks and Caicos Islands | 96.15% |
| 9 | Costa Rica | 95.24% |
| 10 | St. Kitts and Nevis | 93.68% |
| 11 | China | 93.07% |
| 12 | Viet Nam | 92.45% |
| 13 | Moldova | 90.33% |
| 14 | Philippines | 90.23% |
| 15 | British Virgin Islands | 87.88% |
| 2021 low-order position | Economy/territory | Preprimary gross enrollment |
|---|---|---|
| 1 | Somalia, Fed. Rep. | 1.15% |
| 2 | Chad | 1.27% |
| 3 | Micronesia, Fed. Sts. | 5.89% |
| 4 | Burkina Faso | 6.50% |
| 5 | Niger | 7.03% |
| 6 | Djibouti | 11.62% |
| 7 | Burundi | 16.49% |
| 8 | Senegal | 17.58% |
| 9 | Saudi Arabia | 18.32% |
| 10 | Guinea | 19.66% |
| 11 | Benin | 23.13% |
| 12 | Sierra Leone | 25.00% |
| 13 | Bosnia and Herzegovina | 25.47% |
| 14 | Jordan | 26.60% |
| 15 | Oman | 27.40% |
The 2020 and 2021 averages are not a global trend
The 2020 mean is 83.46% and the 2021 mean 54.82%, but the two groups contain different economies and territories. The gap should not be described as a one-year collapse in global preprimary participation. A true time trend requires matching the same economies across consecutive years.
This dataset provides the latest non-empty observation for each economy rather than a balanced panel. Differences between annual subgroup averages therefore reflect both real enrollment patterns and which economies happen to have an observation in that year.
What a low gross enrollment ratio can indicate
A low gross ratio means total enrollment at the preprimary level is small relative to the population of official preprimary age. Access to programs, education costs, institutional coverage, demographic structure, and the design of the education system can all contribute. The indicator alone does not identify which factor is responsible.
Official preprimary ages and program structures also differ across education systems. International comparisons are useful, but a country-specific interpretation should consider how preprimary education is defined and organized locally.
Values above 100% should be retained
Across all latest observations, 29 values are at or above 100%. The 2020 subset contains 20 such observations and the 2021 subset 4. These are possible under the gross-enrollment definition and should not be capped at 100 or converted to missing values.
However, a ratio above 100% should not be used as proof that every child of official preprimary age is enrolled. A net enrollment rate, age-specific participation measure, and information about the duration of preprimary education provide better evidence for that question.
Complete list of the 207 latest observations
The table below lists the latest non-empty observation for every economy and territory in alphabetical order. The original observation year is shown explicitly. Values above 100% are preserved because they are valid for a gross enrollment ratio.
| Economy/territory | Observation year | Preprimary gross enrollment |
|---|---|---|
| Afghanistan | 2011 | 1.06% |
| Albania | 2021 | 69.23% |
| Algeria | 2011 | 79.07% |
| American Samoa | 1992 | 68.39% |
| Andorra | 1983 | 167.54% |
| Angola | 2016 | 39.61% |
| Antigua and Barbuda | 2018 | 70.25% |
| Argentina | 2020 | 76.19% |
| Armenia | 2021 | 28.78% |
| Aruba | 2015 | 103.52% |
| Australia | 2020 | 160.21% |
| Austria | 2020 | 102.86% |
| Azerbaijan | 2021 | 46.29% |
| Bahamas, The | 2019 | 39.74% |
| Bahrain | 2020 | 52.60% |
| Bangladesh | 2021 | 36.38% |
| Barbados | 2021 | 75.13% |
| Belarus | 2021 | 96.77% |
| Belgium | 2020 | 112.43% |
| Belize | 2021 | 34.17% |
| Benin | 2021 | 23.13% |
| Bermuda | 2015 | 68.75% |
| Bhutan | 2021 | 51.93% |
| Bolivia | 2020 | 78.47% |
| Bosnia and Herzegovina | 2021 | 25.47% |
| Botswana | 2015 | 21.45% |
| Brazil | 2020 | 85.94% |
| British Virgin Islands | 2021 | 87.88% |
| Brunei Darussalam | 2020 | 63.48% |
| Bulgaria | 2020 | 84.29% |
| Burkina Faso | 2021 | 6.50% |
| Burundi | 2021 | 16.49% |
| Cabo Verde | 2019 | 74.70% |
| Cambodia | 2021 | 33.57% |
| Cameroon | 2019 | 35.62% |
| Canada | 2020 | 48.92% |
| Cayman Islands | 2018 | 89.33% |
| Central African Republic | 2017 | 2.93% |
| Chad | 2021 | 1.27% |
| Chile | 2020 | 84.51% |
| China | 2021 | 93.07% |
| Colombia | 2020 | 85.93% |
| Comoros | 2018 | 21.81% |
| Congo, Dem. Rep. | 2020 | 6.86% |
| Congo, Rep. | 2018 | 14.29% |
| Costa Rica | 2021 | 95.24% |
| Cote d’Ivoire | 2022 | 10.72% |
| Croatia | 2020 | 70.91% |
| Cuba | 2021 | 99.62% |
| Curacao | 2020 | 94.02% |
| Cyprus | 2020 | 86.66% |
| Czechia | 2020 | 113.53% |
| Denmark | 2020 | 103.20% |
| Djibouti | 2021 | 11.62% |
| Dominica | 2021 | 66.03% |
| Dominican Republic | 2021 | 33.36% |
| Ecuador | 2021 | 55.29% |
| Egypt, Arab Rep. | 2019 | 29.27% |
| El Salvador | 2014 | 65.35% |
| Equatorial Guinea | 2015 | 43.36% |
| Eritrea | 2019 | 23.85% |
| Estonia | 2019 | 94.31% |
| Eswatini | 2014 | 30.01% |
| Ethiopia | 2021 | 30.12% |
| Fiji | 2021 | 31.34% |
| Finland | 2020 | 88.36% |
| France | 2020 | 106.66% |
| French Polynesia | 1996 | 100.34% |
| Gabon | 2019 | 42.99% |
| Gambia, The | 2022 | 41.94% |
| Georgia | 2020 | 95.25% |
| Germany | 2020 | 108.03% |
| Ghana | 2020 | 116.14% |
| Gibraltar | 2021 | 105.60% |
| Greece | 2020 | 93.28% |
| Grenada | 2020 | 130.81% |
| Guam | 1984 | 114.31% |
| Guatemala | 2021 | 49.84% |
| Guinea | 2021 | 19.66% |
| Guinea-Bissau | 2014 | 13.21% |
| Guyana | 2014 | 62.33% |
| Haiti | 1985 | 5.57% |
| Honduras | 2021 | 33.77% |
| Hong Kong SAR, China | 2020 | 93.65% |
| Hungary | 2020 | 90.84% |
| Iceland | 2020 | 95.10% |
| India | 2021 | 51.69% |
| Indonesia | 2018 | 62.34% |
| Iran, Islamic Rep. | 2020 | 72.48% |
| Iraq | 2011 | 3.82% |
| Ireland | 2020 | 95.35% |
| Israel | 2020 | 111.23% |
| Italy | 2020 | 92.66% |
| Jamaica | 2011 | 92.36% |
| Japan | 2015 | 86.70% |
| Jordan | 2021 | 26.60% |
| Kazakhstan | 2020 | 74.13% |
| Kenya | 2019 | 65.14% |
| Kiribati | 2020 | 88.81% |
| Korea, Rep. | 2020 | 91.78% |
| Kuwait | 2020 | 60.25% |
| Kyrgyz Republic | 2021 | 38.54% |
| Lao PDR | 2021 | 49.32% |
| Latvia | 2020 | 94.63% |
| Lebanon | 1985 | 54.26% |
| Lesotho | 2019 | 33.05% |
| Liberia | 2020 | 128.48% |
| Libya | 2006 | 9.82% |
| Liechtenstein | 2020 | 102.24% |
| Lithuania | 2020 | 89.14% |
| Luxembourg | 2020 | 92.20% |
| Macao SAR, China | 2021 | 86.40% |
| Madagascar | 2019 | 40.15% |
| Malawi | 2015 | 83.58% |
| Malaysia | 2021 | 87.50% |
| Maldives | 2020 | 76.06% |
| Mali | 2020 | 7.60% |
| Malta | 2020 | 112.49% |
| Marshall Islands | 2021 | 67.77% |
| Mauritania | 2015 | 10.49% |
| Mauritius | 2021 | 102.00% |
| Mexico | 2020 | 70.60% |
| Micronesia, Fed. Sts. | 2021 | 5.89% |
| Moldova | 2021 | 90.33% |
| Mongolia | 2021 | 80.15% |
| Montenegro | 2021 | 72.87% |
| Morocco | 2021 | 59.87% |
| Mozambique | 1986 | 11.62% |
| Myanmar | 2018 | 8.53% |
| Namibia | 2021 | 36.51% |
| Naoero | 2020 | 32.15% |
| Nepal | 2022 | 93.70% |
| Netherlands | 2020 | 91.95% |
| New Zealand | 2020 | 91.68% |
| Nicaragua | 2020 | 69.04% |
| Niger | 2021 | 7.03% |
| Nigeria | 2018 | 23.46% |
| North Macedonia | 2020 | 31.04% |
| Norway | 2020 | 96.34% |
| Oman | 2021 | 27.40% |
| Pakistan | 2019 | 82.56% |
| Palau | 2020 | 70.51% |
| Panama | 2020 | 26.97% |
| Papua New Guinea | 2018 | 45.85% |
| Paraguay | 2020 | 51.09% |
| Peru | 2021 | 96.44% |
| Philippines | 2021 | 90.23% |
| Poland | 2020 | 93.87% |
| Portugal | 2020 | 99.36% |
| Puerto Rico (US) | 2016 | 37.53% |
| Qatar | 2021 | 54.00% |
| Romania | 2020 | 94.91% |
| Russian Federation | 2019 | 85.99% |
| Rwanda | 2021 | 28.20% |
| Samoa | 2021 | 41.43% |
| San Marino | 2021 | 100.13% |
| Sao Tome and Principe | 2016 | 50.31% |
| Saudi Arabia | 2021 | 18.32% |
| Senegal | 2021 | 17.58% |
| Serbia | 2021 | 63.79% |
| Seychelles | 2021 | 104.29% |
| Sierra Leone | 2021 | 25.00% |
| Singapore | 2020 | 96.07% |
| Sint Maarten (Dutch part) | 2014 | 78.15% |
| Slovak Republic | 2020 | 101.78% |
| Slovenia | 2020 | 93.97% |
| Solomon Islands | 2019 | 93.27% |
| Somalia, Fed. Rep. | 2021 | 1.15% |
| South Africa | 2020 | 17.55% |
| South Sudan | 2018 | 11.59% |
| Spain | 2020 | 101.83% |
| Sri Lanka | 2020 | 71.84% |
| St. Kitts and Nevis | 2021 | 93.68% |
| St. Lucia | 2020 | 78.05% |
| St. Vincent and the Grenadines | 2020 | 113.83% |
| Sudan | 2018 | 47.40% |
| Suriname | 2021 | 78.15% |
| Sweden | 2020 | 100.39% |
| Switzerland | 2020 | 102.87% |
| Syrian Arab Republic | 2013 | 5.55% |
| Tajikistan | 2017 | 9.91% |
| Tanzania | 2021 | 77.25% |
| Thailand | 2022 | 74.37% |
| Timor-Leste | 2020 | 27.87% |
| Togo | 2021 | 29.19% |
| Tonga | 2020 | 48.32% |
| Trinidad and Tobago | 2021 | 64.49% |
| Tunisia | 2016 | 44.62% |
| Turkiye | 2020 | 39.75% |
| Turkmenistan | 2020 | 35.91% |
| Turks and Caicos Islands | 2021 | 96.15% |
| Tuvalu | 2021 | 85.94% |
| Uganda | 2017 | 14.41% |
| Ukraine | 2020 | 85.82% |
| United Arab Emirates | 2020 | 94.21% |
| United Kingdom | 2020 | 105.76% |
| United States | 2020 | 72.40% |
| Uruguay | 2020 | 97.14% |
| Uzbekistan | 2021 | 44.01% |
| Vanuatu | 2020 | 102.61% |
| Venezuela, RB | 2017 | 69.52% |
| Viet Nam | 2021 | 92.45% |
| Virgin Islands (U.S.) | 1993 | 139.96% |
| West Bank and Gaza | 2021 | 49.48% |
| Yemen, Rep. | 2016 | 1.59% |
| Zambia | 2017 | 8.70% |
| Zimbabwe | 2021 | 74.32% |
How to interpret the comparison
First, the 207 latest observations do not share one year. Second, gross enrollment is different from net enrollment and can exceed 100%. Third, averages for different annual subgroups should not be treated as a time series unless the same economies are matched. Fourth, the indicator does not by itself explain why enrollment is high or low.
Education statistics can be revised as administrative records and population estimates change. For a current country-specific assessment, the latest World Bank time series and national education statistics should be examined together.
Source and calculation
The source is World Bank World Development Indicators SE.PRE.ENRR, School enrollment, preprimary (% gross). Summary statistics for the full latest-observation set and the 2020 and 2021 same-year groups are calculated from the corresponding published observations.
Frequently Asked Questions
Can preprimary gross enrollment exceed 100%?
Yes. The gross ratio includes all enrolled children regardless of exact age and compares them with the official preprimary-age population, so values above 100% are possible.
Are all 207 latest observations from 2022?
No. 77 are from 2020, 67 from 2021, only 4 from 2022, and some are much older.
Is gross enrollment the same as net enrollment?
No. Gross enrollment includes all students enrolled at the level regardless of age, while net enrollment focuses on children within the official age range.
Related Articles
Green Map creates custom-edited map images using open geographic data sources such as geoBoundaries, Natural Earth, OpenStreetMap, and government open data. These maps are edited visual materials, not raw data files, and are provided for education, documents, presentations, and graphic reference.