Preprimary education duration differs substantially across education systems. In 2025, the World Bank reports a numeric value for 202 economies and territories out of a 217-economy master set; 15 have no reported value for this indicator. Among the 202 observations, the mean duration is 4.07 years and the median is 4 years. Three years is the most common structure with 62 economies, while six years appears in 51. The indicator describes the standard number of grades or years in the preprimary stage, not the average amount of time that an individual child actually attends.
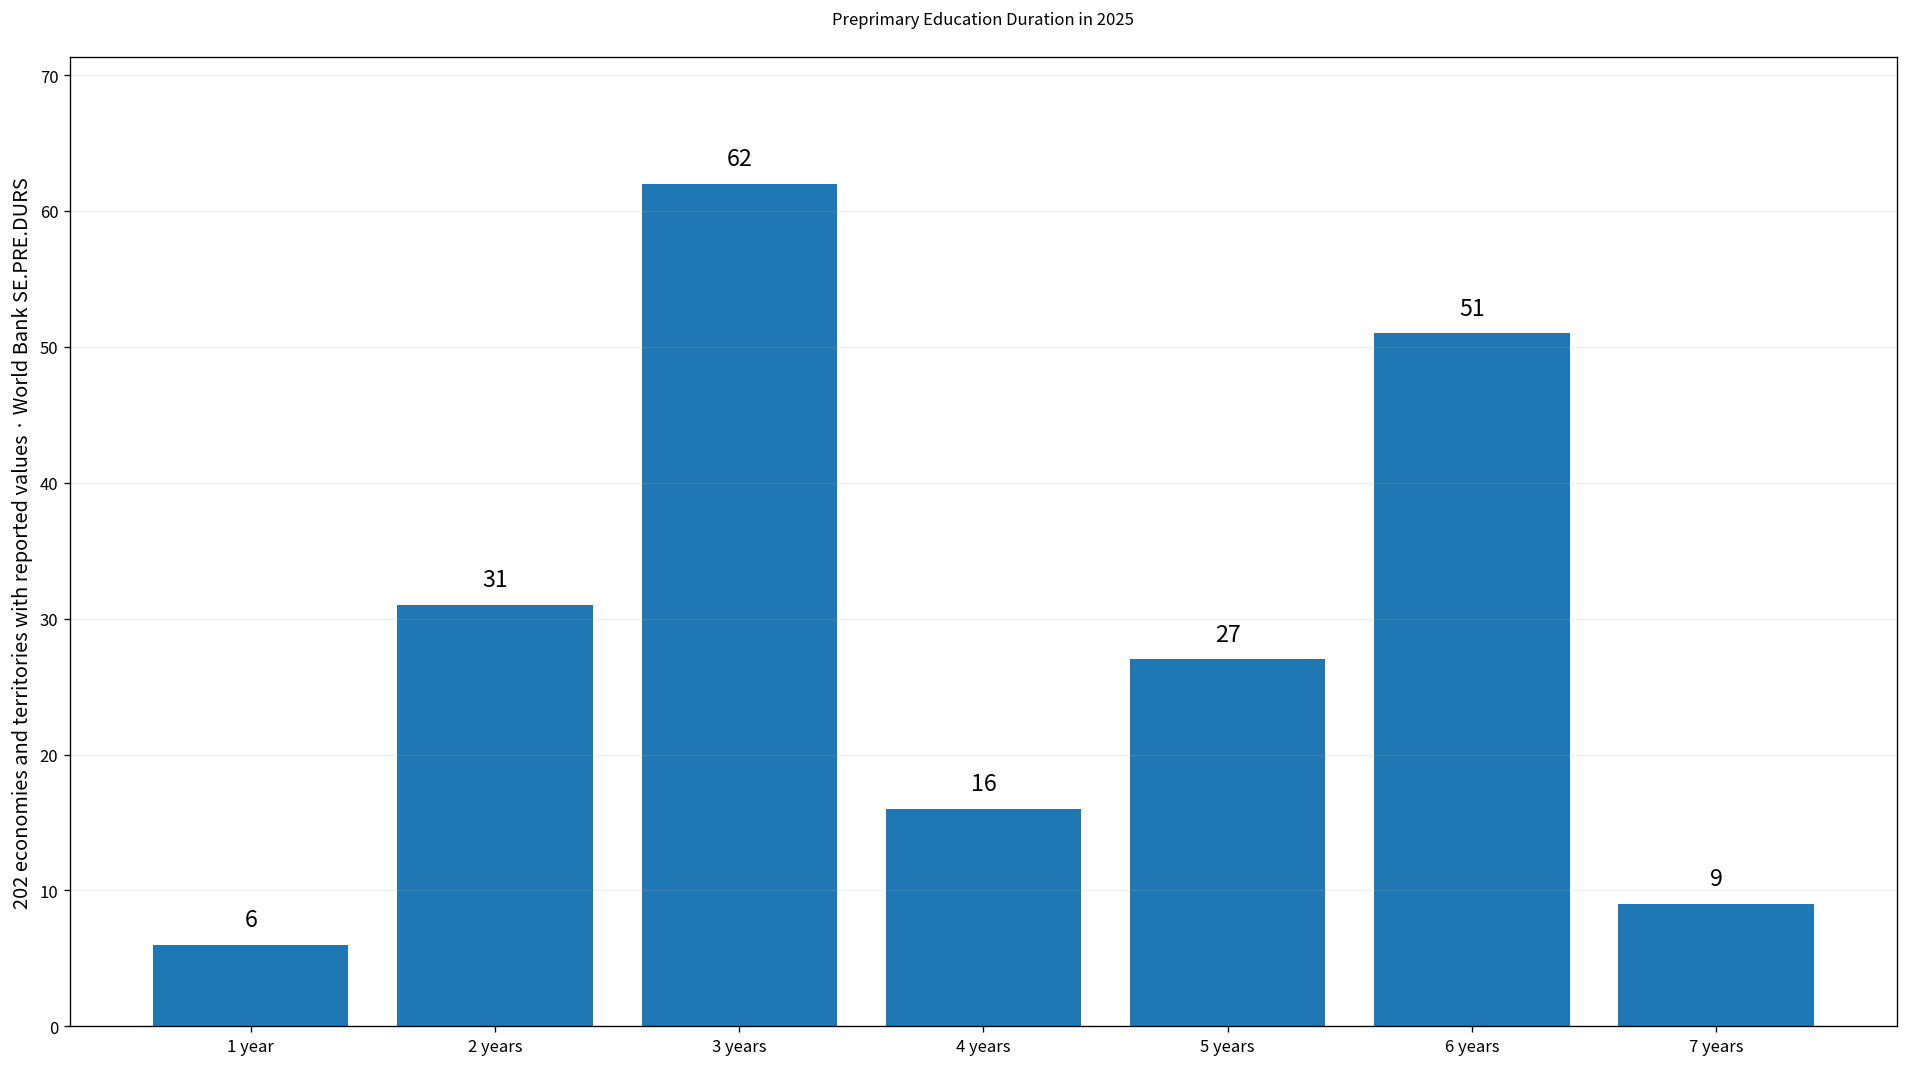
Table of Contents
What preprimary education duration measures
World Bank indicator SE.PRE.DURS describes the number of grades or years in the preprimary education stage. A value of three years means that the standard education structure allocates roughly three years to preprimary education. It does not mean every child attends for three years, nor does it measure the average completed duration for enrolled children.
This distinction is essential when comparing countries. A system with six years of preprimary education does not necessarily have higher enrolment, broader access, or better learning outcomes than a system with two or three years. Duration is a structural feature of the education system. Participation, attendance, quality, gender balance, and completion require separate indicators.
Three years is the most common 2025 structure
Among the 202 economies and territories with a value, 62 report three years, equal to 30.7% of the observed set. Six years appears in 51 observations (25.2%), two years in 31 (15.3%), and five years in 27 (13.4%). Four years is reported for 16 economies, seven years for 9, and one year for 6.
| Preprimary duration | Economies/territories | Share of 202 reported values |
|---|---|---|
| 1 year | 6 | 3.0% |
| 2 years | 31 | 15.3% |
| 3 years | 62 | 30.7% |
| 4 years | 16 | 7.9% |
| 5 years | 27 | 13.4% |
| 6 years | 51 | 25.2% |
| 7 years | 9 | 4.5% |
The first quartile is 3 years and the third quartile is 6 years, placing the middle half of observed systems between those values. Yet the distribution is not concentrated around a single duration. Large groups at three and six years show that several institutional models coexist rather than one global standard.
The observed range runs from one to seven years
The one-year group contains Afghanistan, Bermuda, Algeria, Iran, Islamic Rep., Philippines, Tanzania. At the opposite end, the seven-year group contains Estonia, Guatemala, Croatia, Hungary, Indonesia, Liechtenstein, Lithuania, El Salvador, South Africa. These are the endpoints of the 2025 distribution. The difference should not be read as a sevenfold difference in educational opportunity because the indicator measures program structure, not participation or teaching time actually received by every child.
Education systems can define the boundary between early childhood education, preprimary education, and primary education differently. Some systems classify programs beginning at younger ages within the preprimary stage, while others define a shorter school-readiness period immediately before primary entry. Those institutional choices affect the reported duration.
Two-, three-, and six-year models account for most observations
The two-, three-, and six-year groups together contain 144 economies, or 71.3% of the reported set. The three- and six-year groups alone account for 113 observations (55.9%). This pattern suggests that global preprimary structures cluster around several common designs rather than forming a smooth continuum.
The indicator does not explain why a country uses a particular duration. Entry ages, the legal definition of education stages, coordination between childcare and education authorities, curriculum design, and primary-school starting age may all matter. Country-specific explanations require national education-system documentation rather than inference from the duration number alone.
Fifteen economies have no reported 2025 value
The 2025 master set contains 15 economies and territories without a reported numeric value: American Samoa, Channel Islands, Faroe Islands, Greenland, Guam, Isle of Man, Luxembourg, St. Martin (French part), Northern Mariana Islands, New Caledonia, Portugal, French Polynesia, United States, Virgin Islands (U.S.), Kosovo. These cases are not assigned zero years. A missing observation and a genuine zero-duration education stage are different concepts, so the 15 unavailable values are excluded from the mean and distribution.
The coverage also illustrates why the count should not be treated as a sovereign-country total. World Bank country and economy lists include separately reported territories and other entities. The relevant comparison is therefore 202 reported values within a 217-economy reporting frame, not a claim about the number of sovereign states in the world.
Preprimary duration is not the same as compulsory education
A five- or six-year preprimary stage does not mean all of those years are legally compulsory. Compulsory education is defined through separate laws and indicators, and in many systems the legal requirement begins at primary school or covers only the final part of preprimary education. Standard stage duration and compulsory duration should therefore be compared separately.
The indicator also does not reveal the primary-school entry age by itself. Two systems can report the same preprimary duration but begin the stage at different ages, or they can report different durations while having similar primary-entry ages. A complete structural comparison would combine preprimary duration with official entry ages and the duration of primary and secondary stages.
Duration and enrolment answer different questions
Duration is a feature of system design; enrolment measures participation. A six-year preprimary stage can coexist with uneven attendance across ages, while a two-year stage can have near-universal participation. Researchers interested in access should use gross or net preprimary enrolment indicators, age-specific participation rates, or attendance data alongside duration.
Other education characteristics also remain outside this measure. Public versus private provision, teacher qualifications, pupil-teacher ratios, spending, gender composition, and learning outcomes can all vary independently of the number of years in the standard preprimary stage. The duration indicator is most useful when the question is how education systems structure the stage before primary school.
Complete 2025 status for 217 economies and territories
The table below lists the World Bank 2025 country/economy frame alphabetically. The 202 numeric observations are shown in years, while the 15 unavailable cases are labeled as having no reported value. Missing values are not converted to zero.
| Economy/territory | Year | Preprimary duration |
|---|---|---|
| Afghanistan | 2025 | 1 year |
| Albania | 2025 | 5 years |
| Algeria | 2025 | 1 year |
| American Samoa | 2025 | No reported value |
| Andorra | 2025 | 3 years |
| Angola | 2025 | 3 years |
| Antigua and Barbuda | 2025 | 5 years |
| Argentina | 2025 | 6 years |
| Armenia | 2025 | 3 years |
| Aruba | 2025 | 5 years |
| Australia | 2025 | 5 years |
| Austria | 2025 | 6 years |
| Azerbaijan | 2025 | 5 years |
| Bahamas, The | 2025 | 2 years |
| Bahrain | 2025 | 6 years |
| Bangladesh | 2025 | 3 years |
| Barbados | 2025 | 5 years |
| Belarus | 2025 | 4 years |
| Belgium | 2025 | 6 years |
| Belize | 2025 | 2 years |
| Benin | 2025 | 2 years |
| Bermuda | 2025 | 1 year |
| Bhutan | 2025 | 3 years |
| Bolivia | 2025 | 2 years |
| Bosnia and Herzegovina | 2025 | 6 years |
| Botswana | 2025 | 3 years |
| Brazil | 2025 | 6 years |
| British Virgin Islands | 2025 | 5 years |
| Brunei Darussalam | 2025 | 3 years |
| Bulgaria | 2025 | 4 years |
| Burkina Faso | 2025 | 3 years |
| Burundi | 2025 | 3 years |
| Cabo Verde | 2025 | 3 years |
| Cambodia | 2025 | 6 years |
| Cameroon | 2025 | 2 years |
| Canada | 2025 | 6 years |
| Cayman Islands | 2025 | 4 years |
| Central African Republic | 2025 | 3 years |
| Chad | 2025 | 3 years |
| Channel Islands | 2025 | No reported value |
| Chile | 2025 | 6 years |
| China | 2025 | 3 years |
| Colombia | 2025 | 6 years |
| Comoros | 2025 | 3 years |
| Congo, Dem. Rep. | 2025 | 3 years |
| Congo, Rep. | 2025 | 3 years |
| Costa Rica | 2025 | 6 years |
| Cote d’Ivoire | 2025 | 3 years |
| Croatia | 2025 | 7 years |
| Cuba | 2025 | 6 years |
| Curacao | 2025 | 6 years |
| Cyprus | 2025 | 6 years |
| Czechia | 2025 | 3 years |
| Denmark | 2025 | 6 years |
| Djibouti | 2025 | 2 years |
| Dominica | 2025 | 5 years |
| Dominican Republic | 2025 | 3 years |
| Ecuador | 2025 | 3 years |
| Egypt, Arab Rep. | 2025 | 2 years |
| El Salvador | 2025 | 7 years |
| Equatorial Guinea | 2025 | 6 years |
| Eritrea | 2025 | 2 years |
| Estonia | 2025 | 7 years |
| Eswatini | 2025 | 3 years |
| Ethiopia | 2025 | 3 years |
| Faroe Islands | 2025 | No reported value |
| Fiji | 2025 | 3 years |
| Finland | 2025 | 6 years |
| France | 2025 | 3 years |
| French Polynesia | 2025 | No reported value |
| Gabon | 2025 | 3 years |
| Gambia, The | 2025 | 5 years |
| Georgia | 2025 | 6 years |
| Germany | 2025 | 6 years |
| Ghana | 2025 | 5 years |
| Gibraltar | 2025 | 4 years |
| Greece | 2025 | 6 years |
| Greenland | 2025 | No reported value |
| Grenada | 2025 | 5 years |
| Guam | 2025 | No reported value |
| Guatemala | 2025 | 7 years |
| Guinea | 2025 | 3 years |
| Guinea-Bissau | 2025 | 3 years |
| Guyana | 2025 | 2 years |
| Haiti | 2025 | 6 years |
| Honduras | 2025 | 3 years |
| Hong Kong SAR, China | 2025 | 3 years |
| Hungary | 2025 | 7 years |
| Iceland | 2025 | 6 years |
| India | 2025 | 3 years |
| Indonesia | 2025 | 7 years |
| Iran, Islamic Rep. | 2025 | 1 year |
| Iraq | 2025 | 2 years |
| Ireland | 2025 | 5 years |
| Isle of Man | 2025 | No reported value |
| Israel | 2025 | 6 years |
| Italy | 2025 | 3 years |
| Jamaica | 2025 | 6 years |
| Japan | 2025 | 3 years |
| Jordan | 2025 | 2 years |
| Kazakhstan | 2025 | 5 years |
| Kenya | 2025 | 3 years |
| Kiribati | 2025 | 3 years |
| Korea, Dem. People’s Rep. | 2025 | 4 years |
| Korea, Rep. | 2025 | 6 years |
| Kosovo | 2025 | No reported value |
| Kuwait | 2025 | 2 years |
| Kyrgyz Republic | 2025 | 6 years |
| Lao PDR | 2025 | 6 years |
| Latvia | 2025 | 6 years |
| Lebanon | 2025 | 3 years |
| Lesotho | 2025 | 3 years |
| Liberia | 2025 | 3 years |
| Libya | 2025 | 2 years |
| Liechtenstein | 2025 | 7 years |
| Lithuania | 2025 | 7 years |
| Luxembourg | 2025 | No reported value |
| Macao SAR, China | 2025 | 3 years |
| Madagascar | 2025 | 3 years |
| Malawi | 2025 | 3 years |
| Malaysia | 2025 | 2 years |
| Maldives | 2025 | 4 years |
| Mali | 2025 | 3 years |
| Malta | 2025 | 2 years |
| Marshall Islands | 2025 | 4 years |
| Mauritania | 2025 | 6 years |
| Mauritius | 2025 | 3 years |
| Mexico | 2025 | 6 years |
| Micronesia, Fed. Sts. | 2025 | 3 years |
| Moldova | 2025 | 6 years |
| Monaco | 2025 | 3 years |
| Mongolia | 2025 | 4 years |
| Montenegro | 2025 | 5 years |
| Morocco | 2025 | 5 years |
| Mozambique | 2025 | 3 years |
| Myanmar | 2025 | 5 years |
| Namibia | 2025 | 2 years |
| Naoero | 2025 | 3 years |
| Nepal | 2025 | 2 years |
| Netherlands | 2025 | 3 years |
| New Caledonia | 2025 | No reported value |
| New Zealand | 2025 | 5 years |
| Nicaragua | 2025 | 6 years |
| Niger | 2025 | 3 years |
| Nigeria | 2025 | 5 years |
| North Macedonia | 2025 | 5 years |
| Northern Mariana Islands | 2025 | No reported value |
| Norway | 2025 | 6 years |
| Oman | 2025 | 6 years |
| Pakistan | 2025 | 2 years |
| Palau | 2025 | 3 years |
| Panama | 2025 | 6 years |
| Papua New Guinea | 2025 | 4 years |
| Paraguay | 2025 | 5 years |
| Peru | 2025 | 6 years |
| Philippines | 2025 | 1 year |
| Poland | 2025 | 4 years |
| Portugal | 2025 | No reported value |
| Puerto Rico (US) | 2025 | 6 years |
| Qatar | 2025 | 6 years |
| Romania | 2025 | 6 years |
| Russian Federation | 2025 | 6 years |
| Rwanda | 2025 | 3 years |
| Samoa | 2025 | 2 years |
| San Marino | 2025 | 6 years |
| Sao Tome and Principe | 2025 | 3 years |
| Saudi Arabia | 2025 | 4 years |
| Senegal | 2025 | 3 years |
| Serbia | 2025 | 6 years |
| Seychelles | 2025 | 2 years |
| Sierra Leone | 2025 | 5 years |
| Singapore | 2025 | 6 years |
| Sint Maarten (Dutch part) | 2025 | 6 years |
| Slovak Republic | 2025 | 3 years |
| Slovenia | 2025 | 5 years |
| Solomon Islands | 2025 | 3 years |
| Somalia, Fed. Rep. | 2025 | 3 years |
| South Africa | 2025 | 7 years |
| South Sudan | 2025 | 3 years |
| Spain | 2025 | 6 years |
| Sri Lanka | 2025 | 2 years |
| St. Kitts and Nevis | 2025 | 4 years |
| St. Lucia | 2025 | 4 years |
| St. Martin (French part) | 2025 | No reported value |
| St. Vincent and the Grenadines | 2025 | 2 years |
| Sudan | 2025 | 2 years |
| Suriname | 2025 | 2 years |
| Sweden | 2025 | 6 years |
| Switzerland | 2025 | 2 years |
| Syrian Arab Republic | 2025 | 3 years |
| Tajikistan | 2025 | 4 years |
| Tanzania | 2025 | 1 year |
| Thailand | 2025 | 5 years |
| Timor-Leste | 2025 | 3 years |
| Togo | 2025 | 3 years |
| Tonga | 2025 | 2 years |
| Trinidad and Tobago | 2025 | 2 years |
| Tunisia | 2025 | 3 years |
| Turkiye | 2025 | 6 years |
| Turkmenistan | 2025 | 5 years |
| Turks and Caicos Islands | 2025 | 2 years |
| Tuvalu | 2025 | 3 years |
| Uganda | 2025 | 3 years |
| Ukraine | 2025 | 5 years |
| United Arab Emirates | 2025 | 6 years |
| United Kingdom | 2025 | 5 years |
| United States | 2025 | No reported value |
| Uruguay | 2025 | 6 years |
| Uzbekistan | 2025 | 4 years |
| Vanuatu | 2025 | 2 years |
| Venezuela, RB | 2025 | 5 years |
| Viet Nam | 2025 | 6 years |
| Virgin Islands (U.S.) | 2025 | No reported value |
| West Bank and Gaza | 2025 | 2 years |
| Yemen, Rep. | 2025 | 6 years |
| Zambia | 2025 | 4 years |
| Zimbabwe | 2025 | 2 years |
How to interpret the comparison
First, the figure is a standard stage duration, not average attendance. Second, more years do not automatically imply better access or quality. Third, preprimary duration should not be substituted for compulsory-education duration. Fourth, missing values must remain separate from genuine numeric observations.
Fifth, the World Bank reporting frame includes separately reported territories, so the 217 master rows are not a sovereign-state count. Sixth, education structures can change when governments revise entry ages, curricula, or stage definitions. For a current country-specific description, the World Bank indicator should be read together with the relevant national education authority.
Source and calculation
The source is World Bank World Development Indicators, SE.PRE.DURS: Preprimary education, duration (years). All observations used for the comparison refer to 2025. The mean, median, quartiles, and duration counts use the 202 economies and territories with a numeric value; the 15 cases without a reported value are left out of those calculations rather than imputed.
Frequently Asked Questions
What is the median preprimary education duration in 2025?
The median among the 202 economies and territories with reported values is 4 years; the mean is 4.07 years.
Does a longer preprimary duration mean higher enrolment?
No. Duration measures the standard length of the education stage, while enrolment measures actual participation.
Were the 15 missing 2025 values treated as zero years?
No. Missing observations are kept separate and excluded from the distribution calculations.
Related Articles
Green Map creates custom-edited map images using open geographic data sources such as geoBoundaries, Natural Earth, OpenStreetMap, and government open data. These maps are edited visual materials, not raw data files, and are provided for education, documents, presentations, and graphic reference.