Average heat content for renewable fuels consumed in the non-CHP Electric Power Sector varies widely across U.S. states in 2025. The U.S. Energy Information Administration’s Electric Power Operational Data return one annual observation for every state plus the District of Columbia when the query is fixed to fueltypeid=REN, sectorid=90, field=heat-content. All 51 observations are from 2025, and the source metadata label the unit Btu per physical units. There are no missing values in this state-level slice.
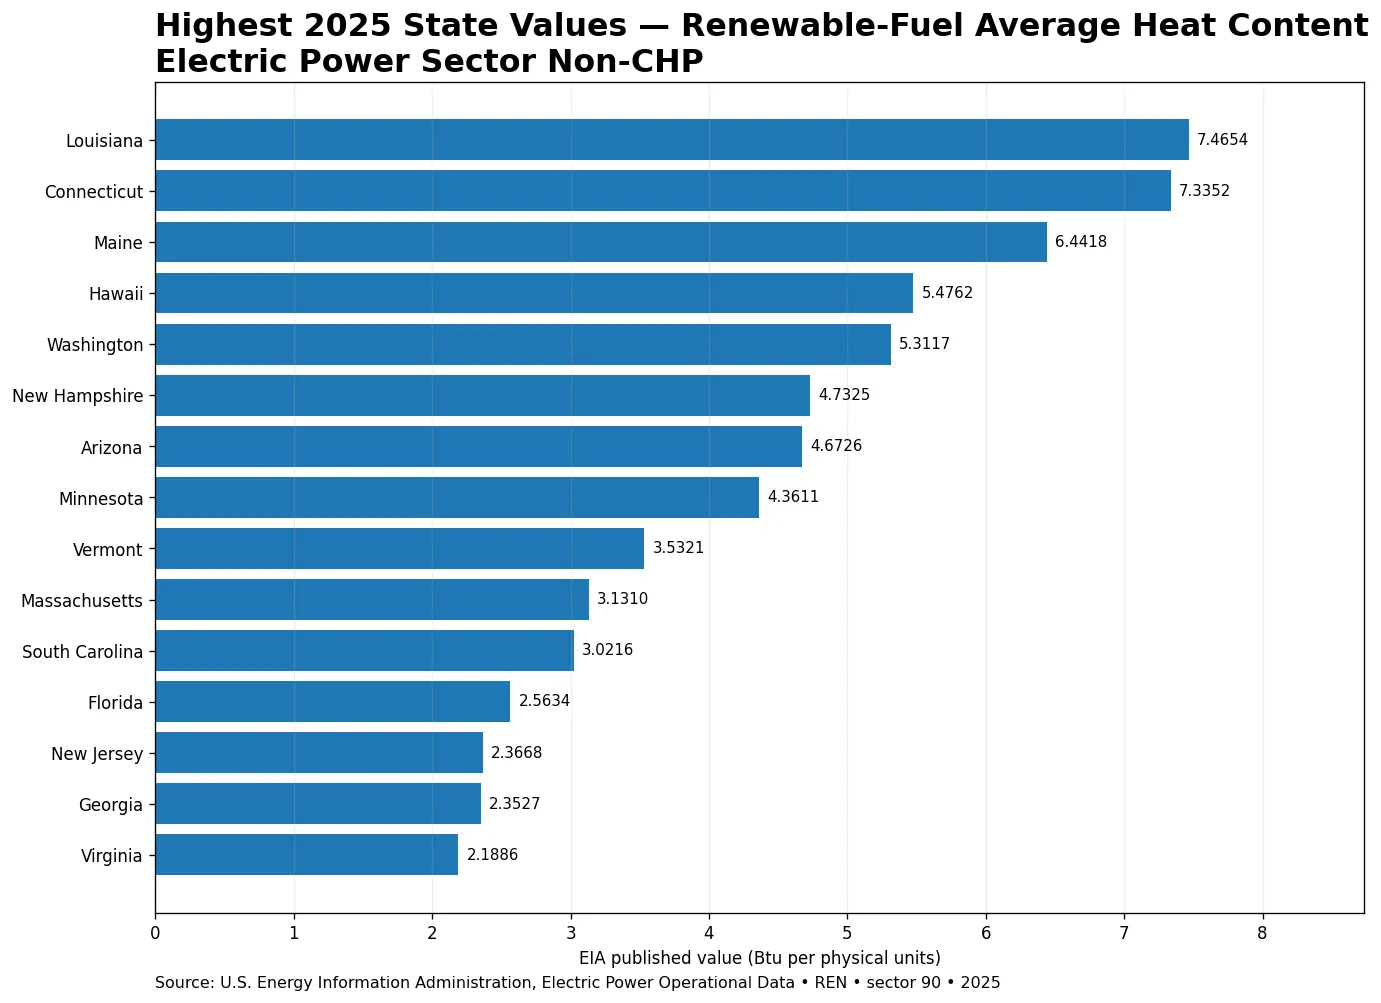
Louisiana has the highest published value at 7.4654, closely followed by Connecticut at 7.3352. Maine is third at 6.4418, while Hawaii and Washington record 5.4762 and 5.3117. Alaska, the District of Columbia, North Dakota, South Dakota, and Wyoming are reported as exactly zero. These numbers are not renewable generation totals or renewable shares. They are heat-content coefficients for one defined fuel-and-sector combination, so a higher value should not be read as better efficiency, more renewable capacity, or stronger policy performance.
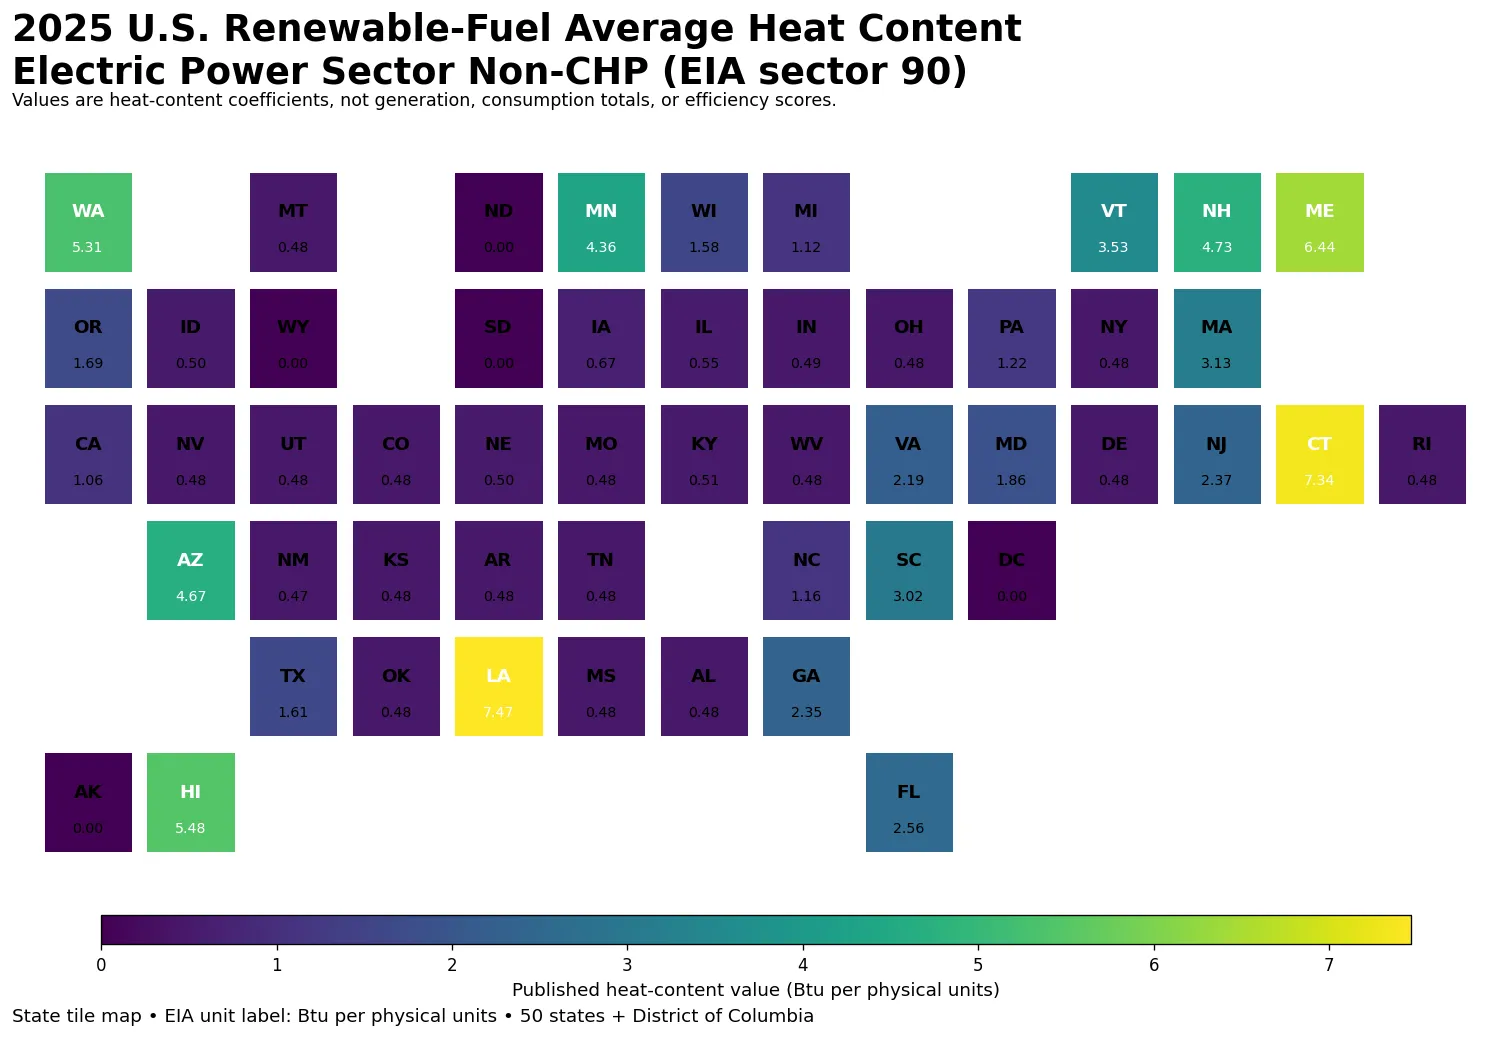
Table of Contents
All 51 jurisdictions use the same 2025 observation year
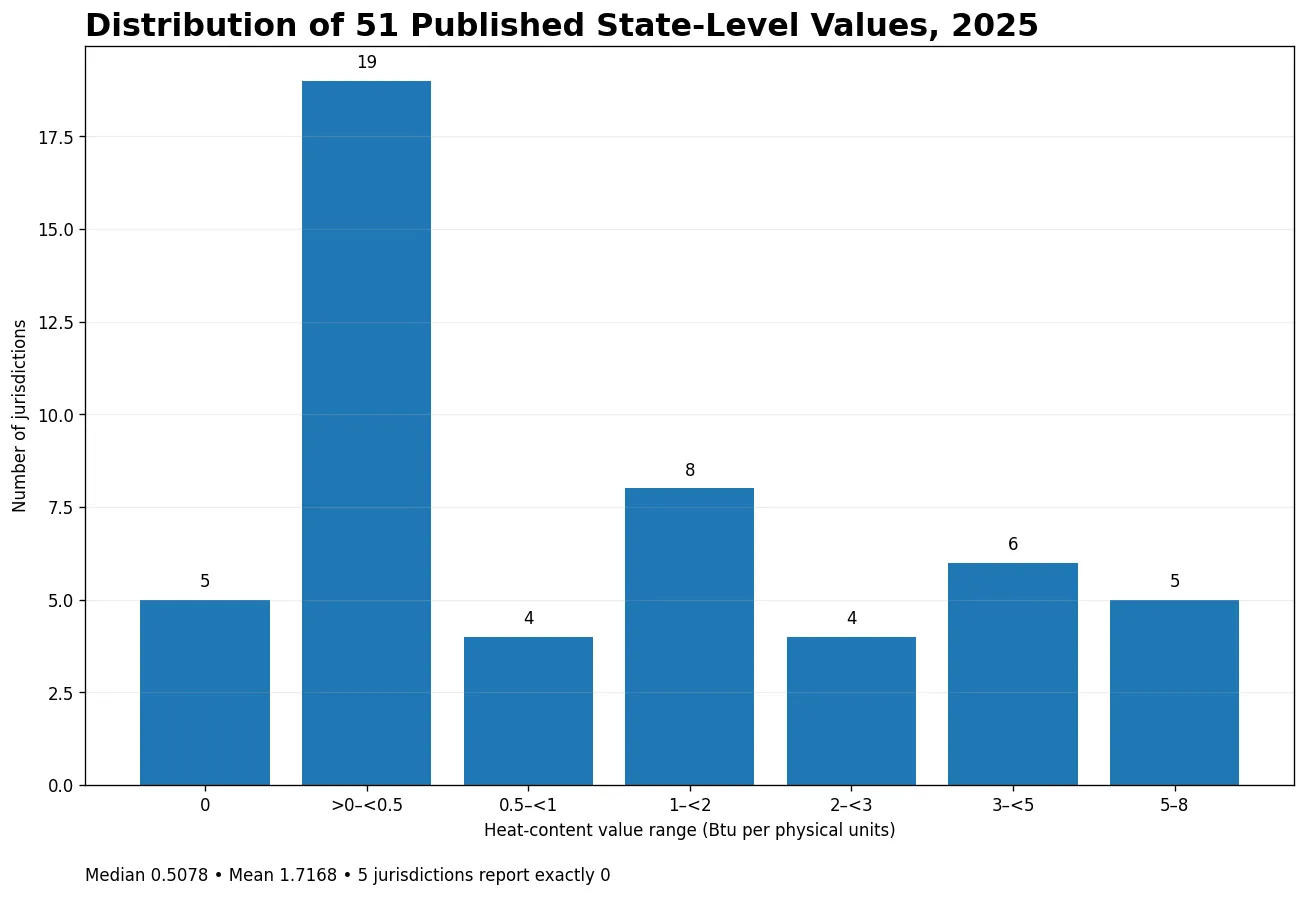
The common observation year makes this dataset easier to compare than a latest-available series assembled from different dates. Every row has year=2025, so the ranking does not combine older state observations with newer ones. The value field also has no missing entries. That does not mean every jurisdiction has a positive coefficient: five rows contain a numeric zero. Those zeros are preserved as reported instead of being treated as missing or replaced with an imputed value.
The simple mean across the 51 jurisdictions is 1.7168, while the median is only 0.5078. The mean is about 3.4 times the median, showing how strongly the upper tail affects the average. The first quartile is 0.4759 and the third quartile is 2.3598. 28 jurisdictions are below 1, while 11 are at or above 3.
Louisiana and Connecticut are above 7
The upper tail is clear. Louisiana and Connecticut both exceed 7, followed by Maine at 6.4418. Hawaii and Washington are the only other jurisdictions above 5. New Hampshire records 4.7325, Arizona 4.6726, and Minnesota 4.3611. Vermont, Massachusetts, and South Carolina are between 3.0 and 3.6. The maximum is about 14.7 times the median, which is why the median is more representative of the center of this distribution than the simple mean.
| State / jurisdiction | Code | 2025 value |
|---|---|---|
| Louisiana | LA | 7.4654 |
| Connecticut | CT | 7.3352 |
| Maine | ME | 6.4418 |
| Hawaii | HI | 5.4762 |
| Washington | WA | 5.3117 |
| New Hampshire | NH | 4.7325 |
| Arizona | AZ | 4.6726 |
| Minnesota | MN | 4.3611 |
| Vermont | VT | 3.5321 |
| Massachusetts | MA | 3.1310 |
Why the EIA unit label is kept instead of forcing one conversion
EIA’s Form EIA-923 reporting instructions describe fuel heat content as energy per physical unit. The relevant physical unit depends on the fuel: solids can be reported by ton, liquids by barrel, and gases by thousand cubic feet. The API metadata for this aggregated state series use the generic label “Btu per physical units.” That label is therefore retained rather than converting every value to Btu/kWh, MMBtu/ton, or another denominator that is not supplied for the aggregated REN category.
REN is an aggregate renewable grouping rather than a single homogeneous fuel. The mix of renewable fuels represented in a state can differ, and the physical basis behind those components need not be identical. The safest use of the numbers is therefore a within-series comparison: the same fueltypeid, the same sectorid, the same field, and the same year. Comparisons with another fuel or another sector require checking the underlying physical units and composition first.
Sector 90 is the Electric Power Sector Non-CHP slice
The dataset labels sectorid=90 as Electric Power Sector Non-CHP. EIA distinguishes the Electric Power Sector from commercial and industrial generation, and it separately identifies combined heat and power (CHP) facilities. CHP plants produce electricity together with useful thermal output. This series focuses on the non-CHP portion of the Electric Power Sector rather than every generator or every renewable-energy use in the United States.
That distinction matters because a renewable heat-content series can change when the sector filter changes. A series for independent power producers, total Electric Power, or all sectors can include a different set of plants and fuels. Similar-looking titles should therefore be compared by their fueltypeid, sectorid, field, and year, not by the word “renewable” alone.
The five reported zeros are not missing values
Alaska, the District of Columbia, North Dakota, South Dakota, and Wyoming each have a reported value of 0.0000 in this exact 2025 query. Because the rows and years are present, these are not null observations. At the same time, a zero should not be generalized into a claim that the jurisdiction has no renewable generation or no renewable resources. It describes the value published for this particular REN · sector 90 · heat-content slice.
Keeping zero distinct from missing data is important for both maps and summary statistics. Replacing zero with an average would alter the official observations, while treating it as no-data would hide a published result. The analysis therefore keeps all five zeros exactly as supplied and does not infer a broader energy-system condition from them.
What this metric can and cannot tell you
Heat content is useful when physical fuel quantities need to be understood in energy terms. The wide state spread indicates that the published average coefficient is not uniform across the country for this renewable aggregate. That may reflect differences in the renewable fuel composition represented in each state. It does not, by itself, identify which state produced the most renewable electricity, used the most renewable fuel, operated the most efficient plants, or had the lowest emissions.
Those questions require different EIA measures. Generation fields answer output questions; consumption fields measure fuel use; capacity data describe the size of the installed fleet; and renewable shares require a denominator such as total generation. Reading the heat-content coefficient together with those measures can provide context, but the coefficient should not substitute for them.
Source and scope
The observations come from the U.S. Energy Information Administration’s Form EIA-923 and related electric-power operational data. EIA-923 collects generation, fuel consumption, stocks, and fuel characteristics from power plants. EIA’s sector definitions are documented in its Guide to Electric Power Data. This analysis uses the 51 verified state-level observations as published and applies no interpolation or imputation.
The scope is a single-year cross-section. No year-over-year growth rate is calculated because only the 2025 slice is used here, and the aggregated REN category is not decomposed into individual renewable fuels. The results are therefore best read as a precise answer to a narrow question: how did EIA’s published renewable-fuel heat-content coefficient vary across states in the 2025 Electric Power Sector Non-CHP slice?
Frequently Asked Questions
Which state had the highest renewable-fuel average heat-content value in 2025?
Louisiana had the highest value in the EIA REN · sector 90 · heat-content slice at 7.4654, followed by Connecticut at 7.3352 and Maine at 6.4418.
Does a higher heat-content value mean more renewable electricity generation?
No. Heat content is an energy-per-physical-unit coefficient. It does not directly measure generation, fuel-consumption totals, installed capacity, renewable share, or plant efficiency.
Do the five zero values mean those jurisdictions have no renewable energy?
No. They are numeric zeros reported for this specific REN · sector 90 · heat-content query. Other EIA generation, consumption, or sector series can show different information.
Related Articles
Green Map creates custom-edited map images using open geographic data sources such as geoBoundaries, Natural Earth, OpenStreetMap, and government open data. These maps are edited visual materials, not raw data files, and are provided for education, documents, presentations, and graphic reference.