World Bank indicator IC.GOV.DURS.ZS reports the percentage of senior management time spent dealing with government-regulation requirements. The latest non-empty dataset covers 181 countries and economies with survey years ranging from 2007 to 2025. The unweighted mean across these latest observations is 7.96% and the median 6.79%.
This is not a measure of how much time ordinary citizens spend on public administration and it does not count the number of regulations. The Enterprise Survey asks firms what percentage of senior management’s total time in a typical week over the previous year was devoted to requirements imposed by government regulation.
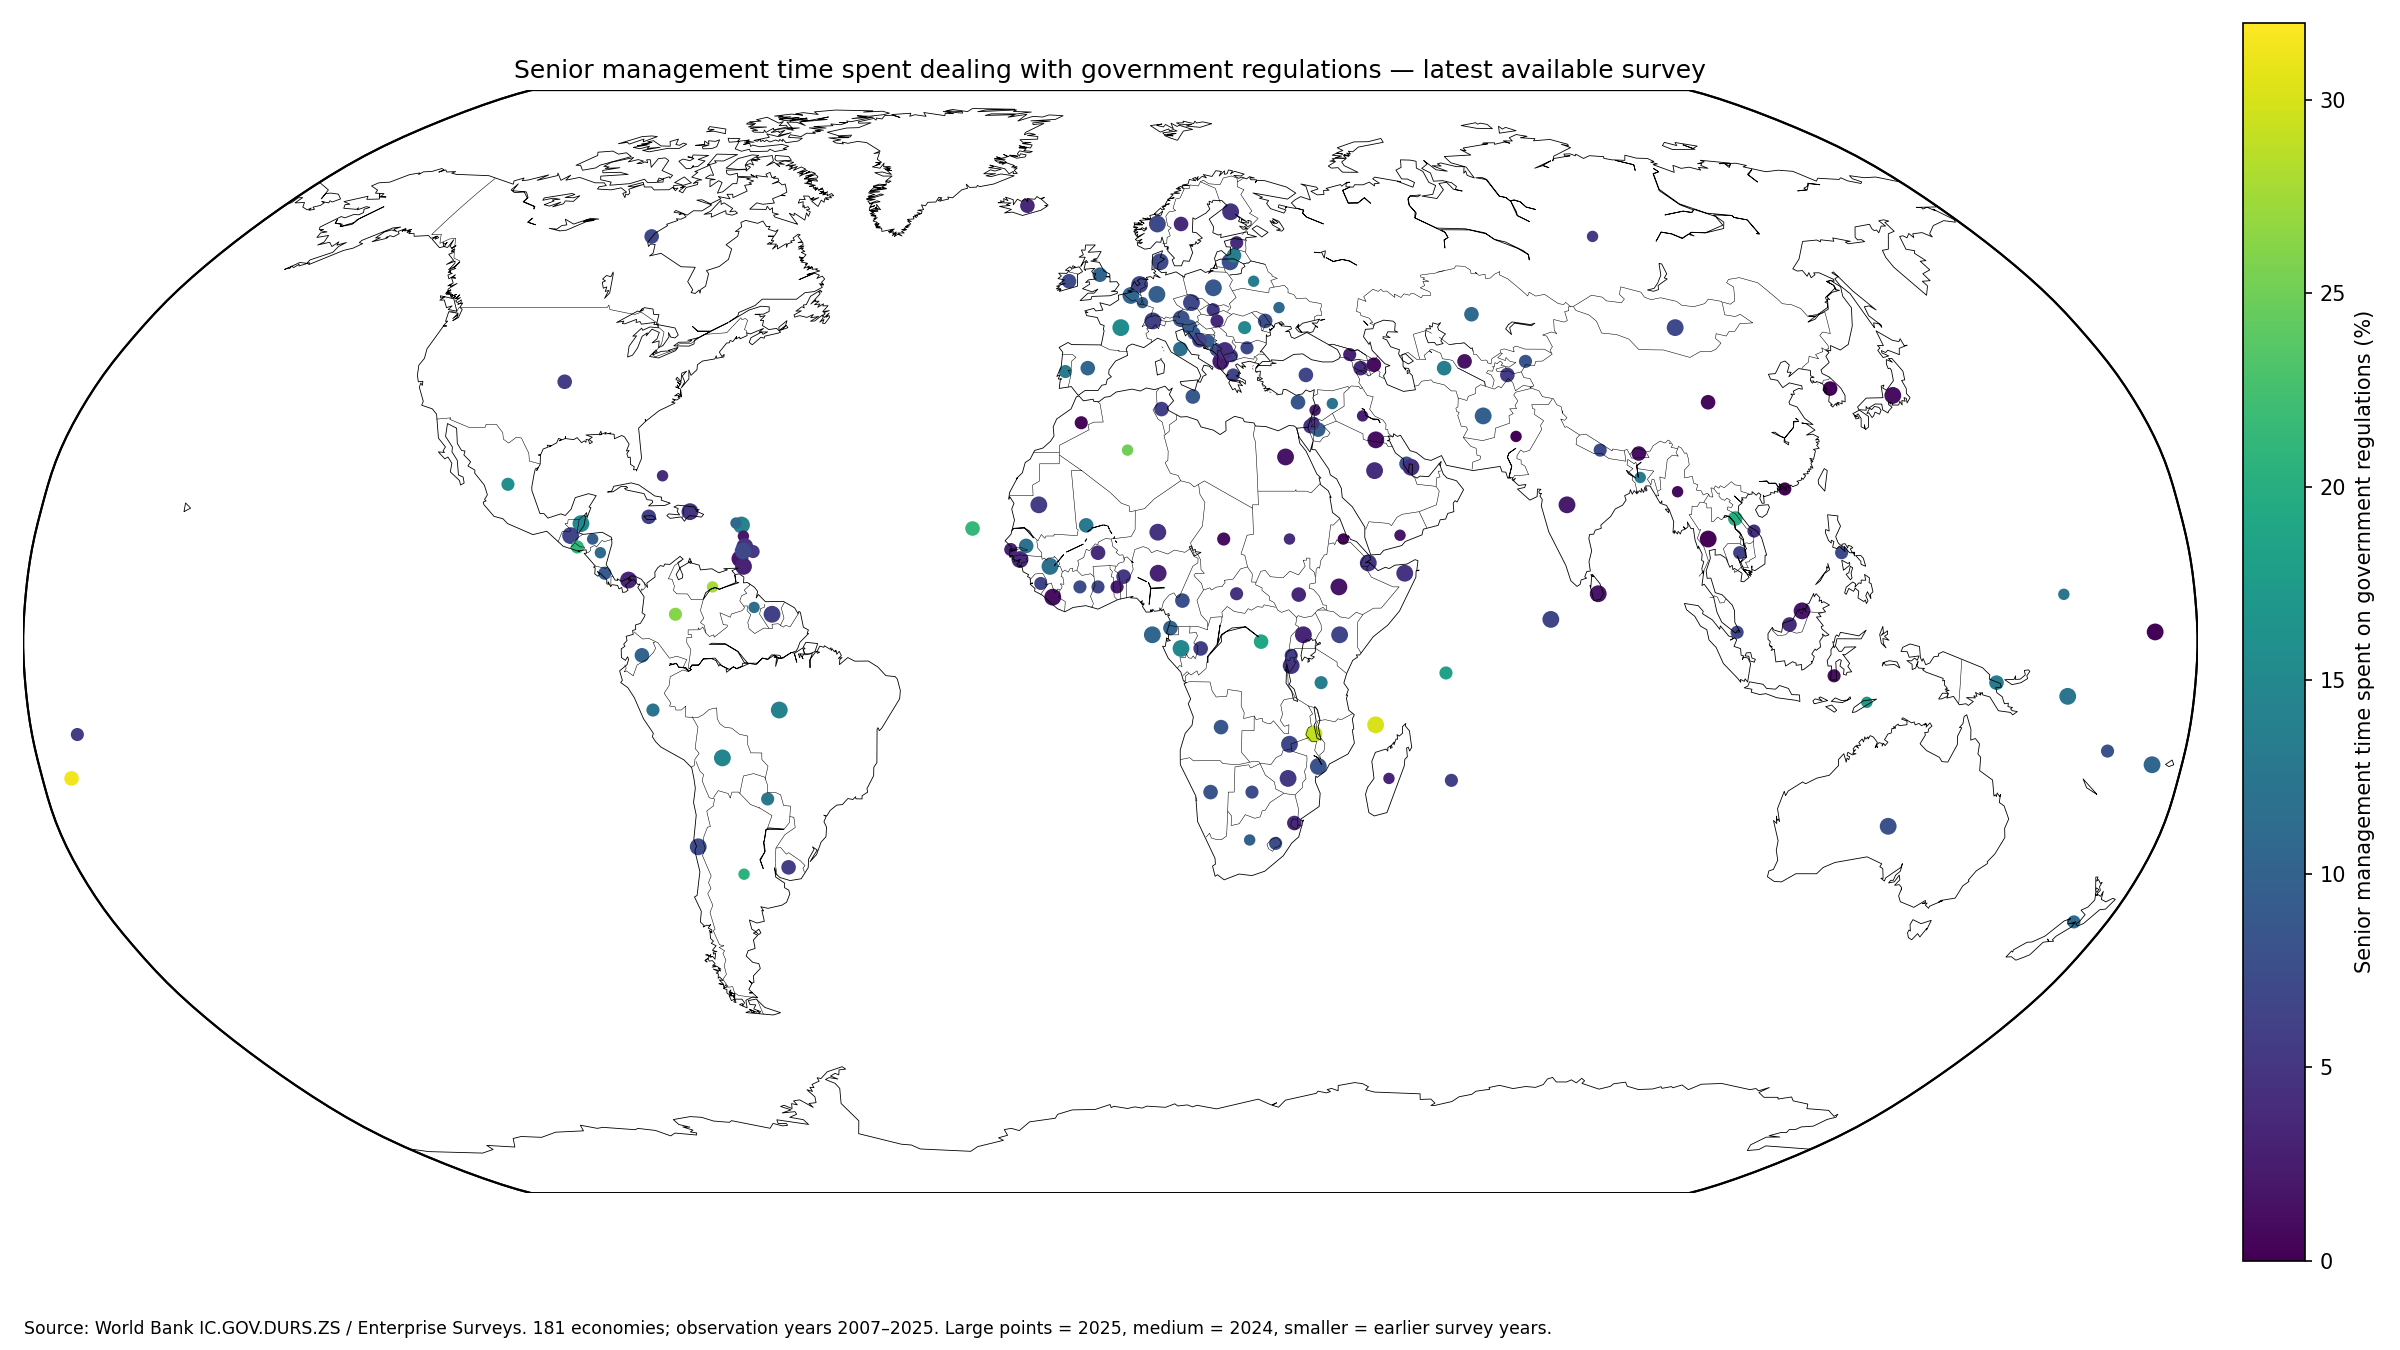
Table of Contents
The question covers taxes, customs, labor rules, licensing and registration
The World Bank metadata glossary defines the indicator as the average percentage of senior management time spent in a typical week dealing with requirements imposed by government regulations. Examples include taxes, customs, labor regulations, licensing, registration, dealings with officials and completing forms.
The numerator can therefore include management time used for compliance paperwork, meetings with officials and other regulatory obligations. The denominator is total senior-management time, so normal production, sales, personnel and strategy work remain outside the regulatory-time numerator.
The underlying survey represents formal private-sector firms
The Enterprise Surveys methodology uses stratified random sampling to represent the formal private sector covered by the survey. The standard universe includes registered privately owned firms with at least five workers in manufacturing and eligible service industries, with strata for firm size, sector and location.
The indicator should not be generalized to informal businesses, the entire agricultural or extractive economy, public agencies, or every self-employed worker. It describes the regulatory-compliance experience of firms in the Enterprise Survey universe.
The latest-observation median is 6.79%
The median across 181 latest observations is 6.79%. The middle half lies between 4.13% and 10.42%. The simple mean of 7.96% is slightly above the median.
24 observations are below 2%, 38 from 2% to under 5%, 69 from 5% to under 10%, 34 from 10% to under 15%, 7 from 15% to under 20%, and 9 are at least 20%.
| Senior-management regulation time | Economies | Share of 181 |
|---|---|---|
| Below 2% | 24 | 13.3% |
| 2% to under 5% | 38 | 21.0% |
| 5% to under 10% | 69 | 38.1% |
| 10% to under 15% | 34 | 18.8% |
| 15% to under 20% | 7 | 3.9% |
| 20% or more | 9 | 5.0% |
Tonga has the highest latest observation at 31.33%
Tonga records 31.33%, followed by Comoros 30.07%, Malawi 28.92%, Venezuela 27.63%, Colombia 26.17%, and Algeria 25.10%.
Those values do not come from one common year. Tonga is from 2024, Comoros and Malawi from 2025, Colombia from 2023, Venezuela from 2010 and Algeria from 2007. The complete latest-value ranking maximizes coverage rather than time consistency.
| True latest-observation rank | Country or economy | Survey year | Senior-management time share |
|---|---|---|---|
| 1 | Tonga | 2024 | 31.33% |
| 2 | Comoros | 2025 | 30.07% |
| 3 | Malawi | 2025 | 28.92% |
| 4 | Venezuela, RB | 2010 | 27.63% |
| 5 | Colombia | 2023 | 26.17% |
| 6 | Algeria | 2007 | 25.10% |
| 7 | Cabo Verde | 2024 | 21.34% |
| 8 | El Salvador | 2023 | 20.98% |
| 9 | Argentina | 2017 | 20.51% |
| 10 | Lao PDR | 2024 | 19.95% |
| 11 | Congo, Dem. Rep. | 2024 | 19.03% |
| 12 | Seychelles | 2023 | 18.39% |
| 13 | Timor-Leste | 2021 | 17.22% |
| 14 | Mexico | 2023 | 15.81% |
| 15 | France | 2025 | 15.47% |
The synchronized 2025 subset contains 62 economies
Among the 62 observations from 2025, Comoros records 30.07%, Malawi 28.92%, France 15.47%, Gabon 14.94%, Belize 14.65%, and Bolivia 14.55%.
| 2025 rank | Country or economy | Senior-management time share |
|---|---|---|
| 1 | Comoros | 30.07% |
| 2 | Malawi | 28.92% |
| 3 | France | 15.47% |
| 4 | Gabon | 14.94% |
| 5 | Belize | 14.65% |
| 6 | Bolivia | 14.55% |
| 7 | Antigua and Barbuda | 14.26% |
| 8 | Brazil | 13.96% |
| 9 | Solomon Islands | 12.43% |
| 10 | Guinea | 11.70% |
| 11 | Sao Tome and Principe | 10.51% |
| 12 | Fiji | 10.42% |
| 13 | Belgium | 10.41% |
| 14 | Afghanistan | 9.70% |
| 15 | Germany | 9.60% |
The 2025 subset has an unweighted mean of 7.15%, a median of 6.36%, a first quartile of 3.50% and a third quartile of 8.67%. For same-year comparison, this subset is more coherent than the full 2007–2025 latest-value map.
The 5% to 10% band is the largest group in 2025
In 2025, 10 observations are below 2%, 17 are from 2% to under 5%, 22 from 5% to under 10%, 10 from 10% to under 15%, 1 from 15% to under 20%, and 2 are at least 20%.
Most reporting economies in 2025 are in single digits or the low teens, while Comoros and Malawi stand out above 20%. A mean alone would hide that shape.
Kiribati and Thailand have the lowest 2025 observations
Kiribati records 0.13%, Thailand 0.30%, Japan 1.17%, Liberia 1.19%, and Kuwait 1.34%.
A low value means surveyed firms report that senior managers spend relatively little of their time on regulatory requirements. It does not by itself prove that the country has fewer regulations or a better regulatory system.
| Low-end 2025 order | Country or economy | Senior-management time share |
|---|---|---|
| 1 | Kiribati | 0.13% |
| 2 | Thailand | 0.30% |
| 3 | Japan | 1.17% |
| 4 | Liberia | 1.19% |
| 5 | Kuwait | 1.34% |
| 6 | Egypt, Arab Rep. | 1.70% |
| 7 | Brunei Darussalam | 1.79% |
| 8 | Sri Lanka | 1.80% |
| 9 | Grenada | 1.85% |
| 10 | Ethiopia | 1.87% |
| 11 | India | 2.32% |
| 12 | Albania | 2.67% |
| 13 | Trinidad and Tobago | 3.06% |
| 14 | Nigeria | 3.07% |
| 15 | Panama | 3.35% |
Latin American 2025 observations span roughly 3% to 15%
Belize records 14.65%, Bolivia 14.55%, Brazil 13.96%, Chile 7.33%, Guatemala 6.52%, Suriname 6.22%, the Dominican Republic 4.89%, Panama 3.35%, and Trinidad and Tobago 3.06%.
The same broad region therefore contains substantial differences in the amount of senior-management time firms report. The aggregate indicator cannot separate how much of the difference comes from taxes, customs, labor rules, permits or registration.
| Latin America 2025 examples | Survey year | Senior-management time share |
|---|---|---|
| Belize | 2025 | 14.65% |
| Bolivia | 2025 | 14.55% |
| Brazil | 2025 | 13.96% |
| Chile | 2025 | 7.33% |
| Guatemala | 2025 | 6.52% |
| Suriname | 2025 | 6.22% |
| Dominican Republic | 2025 | 4.89% |
| Panama | 2025 | 3.35% |
| Trinidad and Tobago | 2025 | 3.06% |
Western European 2025 values also vary widely
France records 15.47%, Belgium 10.41%, Germany 9.60%, Austria 8.10%, Denmark 7.25%, the Netherlands 6.69%, Switzerland 5.99%, and Finland 4.71%.
Even economies with broadly similar administrative capacity can show different firm experiences. Industry mix, firm size, location and the specific regulatory contacts faced by respondents can all differ.
| European 2025 examples | Survey year | Senior-management time share |
|---|---|---|
| France | 2025 | 15.47% |
| Belgium | 2025 | 10.41% |
| Germany | 2025 | 9.60% |
| Poland | 2025 | 8.84% |
| Austria | 2025 | 8.10% |
| Lithuania | 2025 | 7.80% |
| Denmark | 2025 | 7.25% |
| Norway | 2025 | 7.06% |
| Netherlands | 2025 | 6.69% |
| Switzerland | 2025 | 5.99% |
| Finland | 2025 | 4.71% |
African 2025 observations cover the widest range
Comoros is at 30.07% and Malawi 28.92%, while Ethiopia is 1.87% and Liberia 1.19%. Gabon records 14.94%, Guinea 11.70%, Sao Tome and Principe 10.51%, Mozambique 8.18%, and Kenya 6.69%.
The range may reflect genuine differences in compliance time together with differences in firm structure, respondents’ interpretation and the regulatory situation at the time of fieldwork. One country should not be treated as representative of the region.
| Africa 2025 examples | Survey year | Senior-management time share |
|---|---|---|
| Comoros | 2025 | 30.07% |
| Malawi | 2025 | 28.92% |
| Gabon | 2025 | 14.94% |
| Guinea | 2025 | 11.70% |
| Sao Tome and Principe | 2025 | 10.51% |
| Mozambique | 2025 | 8.18% |
| Zambia | 2025 | 6.76% |
| Kenya | 2025 | 6.69% |
| Mauritania | 2025 | 5.79% |
| Zimbabwe | 2025 | 5.27% |
| Burundi | 2025 | 4.99% |
| Djibouti | 2025 | 4.98% |
| Somalia, Fed. Rep. | 2025 | 4.86% |
| Niger | 2025 | 4.78% |
| Guinea-Bissau | 2025 | 3.56% |
| Uganda | 2025 | 3.48% |
| Nigeria | 2025 | 3.07% |
| Ethiopia | 2025 | 1.87% |
| Liberia | 2025 | 1.19% |
Asian and Middle Eastern 2025 observations range from below 1% to nearly 10%
Afghanistan records 9.70%, Mongolia 7.21%, the Maldives 6.50%, Qatar 4.38%, Saudi Arabia 4.14%, India 2.32%, Sri Lanka 1.80%, Brunei Darussalam 1.79%, Kuwait 1.34%, Japan 1.17%, and Thailand 0.30%.
The variation is another reminder that this is not a direct count of laws or regulatory pages. It is an experience-based firm survey about management time actually devoted to compliance requirements.
| Asia and Middle East 2025 examples | Survey year | Senior-management time share |
|---|---|---|
| Afghanistan | 2025 | 9.70% |
| Mongolia | 2025 | 7.21% |
| Maldives | 2025 | 6.50% |
| Qatar | 2025 | 4.38% |
| Saudi Arabia | 2025 | 4.14% |
| India | 2025 | 2.32% |
| Sri Lanka | 2025 | 1.80% |
| Brunei Darussalam | 2025 | 1.79% |
| Egypt, Arab Rep. | 2025 | 1.70% |
| Kuwait | 2025 | 1.34% |
| Japan | 2025 | 1.17% |
| Thailand | 2025 | 0.30% |
Pacific 2025 observations also diverge
Solomon Islands records 12.43%, Fiji 10.42%, Australia 8.09%, and Kiribati 0.13%. A small same-year set still spans almost the entire lower half of the world distribution.
Small island economies can differ sharply from large economies in industrial structure and sample size, so survey design and the underlying economy profile matter when reading precise rankings.
| Pacific 2025 examples | Survey year | Senior-management time share |
|---|---|---|
| Solomon Islands | 2025 | 12.43% |
| Fiji | 2025 | 10.42% |
| Australia | 2025 | 8.09% |
| Kiribati | 2025 | 0.13% |
The percentage is not a score of regulatory quality or government efficiency
More management time can signal a heavier compliance burden, but the indicator does not say whether the underlying regulations are socially useful, unnecessary, well designed or poorly enforced. Safety, labor, environmental and consumer protections can require management time while serving legitimate policy objectives.
Likewise, a low percentage does not prove that rules are predictable, fair or efficiently administered. Licensing duration, tax administration, customs performance, corruption experiences and dispute-resolution indicators provide different pieces of the business-environment picture.
Firm size and sector composition still matter
Enterprise Surveys use stratified samples and survey weights to represent the covered private-sector universe, but economies have different industrial structures. Manufacturing, retail, professional services, transport and other sectors can face different regulatory interactions.
Small, medium and large firms can also differ in compliance complexity. Survey weighting improves representativeness within an economy; it does not make every economy’s sector structure identical.
The measure is based on respondent recall rather than an administrative time log
Senior managers report the percentage for a typical week over the previous year. The measure therefore depends on respondents’ memory, interpretation of what counts as regulatory work, and judgment about a typical week.
Large cross-economy differences can still be informative, but very small gaps should not be treated as perfectly precise rankings without consulting survey standard errors and implementation details.
Survey year does not mean the same firms are measured every calendar year
The WDI series is displayed annually, but Enterprise Surveys are refreshed when an economy is surveyed. That is why the latest non-empty values come from many different years. Some fieldwork rounds can also span several months or cross calendar years.
Among the 181 latest observations, 62 are from 2025, 48 from 2024, and 45 from 2023. The 2024–2025 group contains 110 observations, while 26 latest values are from 2022 or earlier.
| Latest survey year | Economies |
|---|---|
| 2025 | 62 |
| 2024 | 48 |
| 2023 | 45 |
| 2022 | 4 |
| 2021 | 1 |
| 2020 | 2 |
| 2019 | 3 |
| 2018 | 1 |
| 2017 | 1 |
| 2016 | 3 |
| 2014 | 1 |
| 2013 | 1 |
| 2010 | 5 |
| 2009 | 3 |
| 2007 | 1 |
A 2007 observation should not be read as a current 2025 condition
The oldest latest observation in this dataset is from 2007. Tax systems, e-government, labor rules, licensing processes and firm structure can change dramatically over such a long period.
The map therefore uses the largest points for 2025, medium points for 2024, and smaller points for older surveys. Geographic coverage is preserved without hiding the time mismatch.
The simple economy mean is not a firm-weighted global average
The 7.96% latest-value mean and the 7.15% 2025 mean give each economy one equal weight. A large economy with millions of firms and a small economy each contribute one country indicator.
They should be read as descriptive summaries of country-level indicators, not as the percentage of management time spent by all firms in the world combined.
Source and calculation notes
The source is World Bank World Development Indicators series IC.GOV.DURS.ZS, based on World Bank Enterprise Surveys. The analysis uses 181 latest non-empty observations for distribution and ranking statistics and separately summarizes the 62 observations from 2025.
All 181 country codes are matched to geographic centroids for the map, producing a 100% match. Published values are left unchanged and point size communicates survey-year recency.
Frequently Asked Questions
What work is included in time spent dealing with government regulations?
Examples include taxes, customs, labor regulations, licensing, registration, dealings with officials and completing regulatory forms.
Does a high value mean regulation is bad?
No. The indicator measures management time devoted to regulatory requirements; it does not directly score regulatory necessity, quality, fairness or government efficiency.
Are all 181 observations from 2025?
No. Sixty-two are from 2025, 48 from 2024, 45 from 2023, and the remaining latest observations date from 2007–2022.
Related Articles
Green Map creates custom-edited map images using open geographic data sources such as geoBoundaries, Natural Earth, OpenStreetMap, and government open data. These maps are edited visual materials, not raw data files, and are provided for education, documents, presentations, and graphic reference.