World Bank indicator BX.GSR.CCIS.ZS provides the latest non-empty ICT service-export share of total service exports for 190 countries and economies. Observation years range from 2000 to 2025: 94 values are from 2025, 64 from 2024, and 14 from 2023. The unweighted mean across all latest observations is 9.59% and the median 5.93%.
The numerator is ICT service exports, not ICT goods. The denominator is balance-of-payments service exports. The ratio therefore measures the composition of international service exports rather than the absolute dollar size of a country’s software, telecommunications, data, or information-service exports.
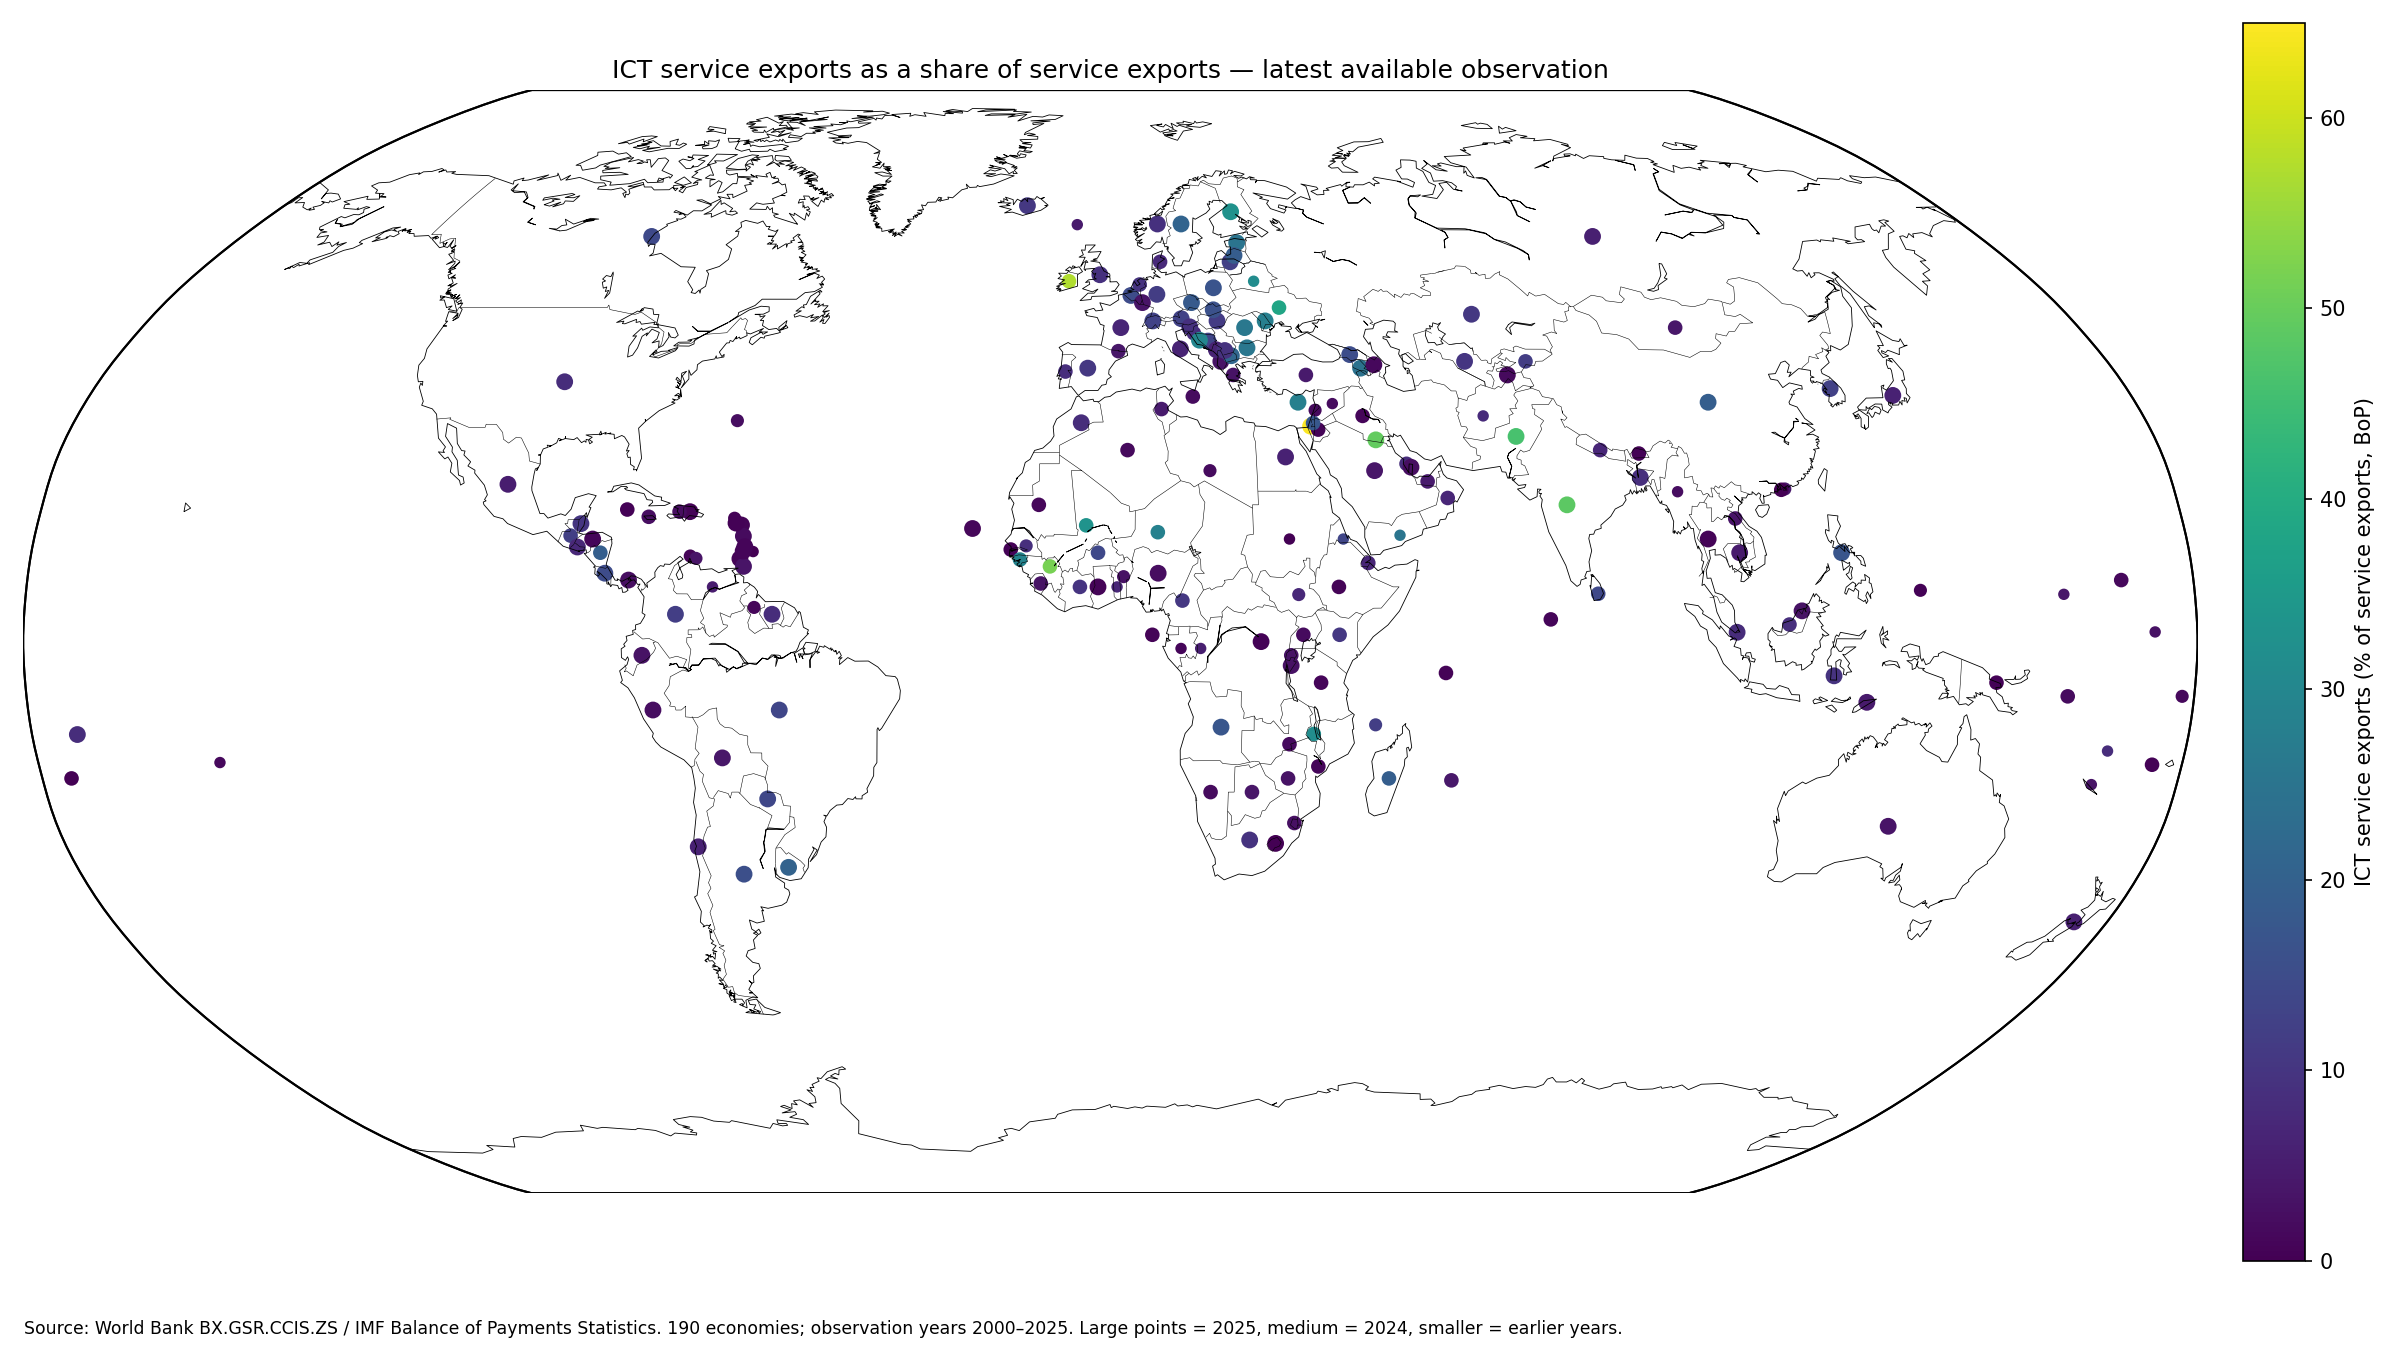
Table of Contents
ICT services include communications, post and courier, computer and information services
The World Bank metadata glossary defines ICT service exports to include computer and communications services plus information services. Telecommunications, postal and courier services, computer data, and news-related service transactions are part of the scope.
Exports of physical ICT products such as computers, communications equipment, semiconductors and electronic components are merchandise trade rather than this service indicator. ICT goods and ICT services should therefore be analyzed separately.
The denominator is service exports in the balance of payments
The denominator covers services exported by residents to non-residents under the balance-of-payments framework. Travel, transport, finance, insurance, intellectual-property services, other business services and additional service categories can all affect the total denominator.
An ICT share of 40% means that roughly 40 of every 100 units of service exports are classified as ICT services. It does not mean ICT services equal 40% of GDP, 40% of merchandise exports, or 40% of all goods and services exports.
The latest-observation median is 5.93%
The median across 190 latest observations is 5.93%. The middle half lies between 1.92% and 12.46%. The simple mean of 9.59% is higher because a smaller group of economies with shares above 20% stretches the upper tail.
32 observations are below 1%, 29 from 1% to under 3%, 29 from 3% to under 5%, 39 from 5% to under 10%, 37 from 10% to under 20%, 18 from 20% to under 40%, and 6 are at least 40%.
| Latest ICT-service export share | Economies | Share of 190 |
|---|---|---|
| Below 1% | 32 | 16.8% |
| 1% to under 3% | 29 | 15.3% |
| 3% to under 5% | 29 | 15.3% |
| 5% to under 10% | 39 | 20.5% |
| 10% to under 20% | 37 | 19.5% |
| 20% to under 40% | 18 | 9.5% |
| 40% or more | 6 | 3.2% |
Israel, Ireland and Guinea have the highest latest shares
Israel records 64.69%, Ireland 57.37%, Guinea 51.77%, Kuwait 49.27%, India 48.60%, and Pakistan 46.06% in their latest available observations.
Ireland and Guinea are 2024 observations, while Israel, Kuwait, India and Pakistan are from 2025. The full ranking therefore maximizes coverage but is not a fully synchronized 2025 comparison.
| True latest-observation rank | Country or economy | Observation year | ICT-service share |
|---|---|---|---|
| 1 | Israel | 2025 | 64.69% |
| 2 | Ireland | 2024 | 57.37% |
| 3 | Guinea | 2024 | 51.77% |
| 4 | Kuwait | 2025 | 49.27% |
| 5 | India | 2025 | 48.60% |
| 6 | Pakistan | 2025 | 46.06% |
| 7 | Ukraine | 2024 | 38.18% |
| 8 | Mali | 2024 | 33.34% |
| 9 | Finland | 2025 | 32.78% |
| 10 | Malawi | 2024 | 31.70% |
| 11 | Belarus | 2021 | 31.41% |
| 12 | Serbia | 2025 | 29.86% |
| 13 | Guinea-Bissau | 2024 | 29.36% |
| 14 | Niger | 2024 | 28.27% |
| 15 | Cyprus | 2025 | 28.07% |
The synchronized 2025 subset covers 94 economies
Among the 94 observations from 2025, Israel records 64.69%, Kuwait 49.27%, India 48.60%, Pakistan 46.06%, Finland 32.78%, and Serbia 29.86%.
| 2025 rank | Country or economy | ICT-service share |
|---|---|---|
| 1 | Israel | 64.69% |
| 2 | Kuwait | 49.27% |
| 3 | India | 48.60% |
| 4 | Pakistan | 46.06% |
| 5 | Finland | 32.78% |
| 6 | Serbia | 29.86% |
| 7 | Cyprus | 28.07% |
| 8 | Moldova | 27.77% |
| 9 | Romania | 26.01% |
| 10 | Bulgaria | 25.68% |
| 11 | Estonia | 25.00% |
| 12 | Armenia | 24.52% |
| 13 | North Macedonia | 21.52% |
| 14 | Sweden | 20.66% |
| 15 | Uruguay | 20.35% |
The 2025 subset has an unweighted mean of 11.65%, a median of 8.98%, a first quartile of 3.33%, and a third quartile of 15.13%. For same-year comparison, this 94-economy subset is temporally cleaner than the full latest-value map.
The largest 2025 group is between 10% and 20%
In 2025, 11 observations are below 1%, 9 from 1% to under 3%, 10 from 3% to under 5%, 23 from 5% to under 10%, 26 from 10% to under 20%, 11 from 20% to under 40%, and 4 are at least 40%.
Even within one reference year, the range runs from about one tenth of one percent to more than 60%. Countries differ sharply in the composition of the services they sell internationally.
India and Pakistan stand out within South Asia
India records 48.60% and Pakistan 46.06% in 2025. Bangladesh is much lower at 8.79%. Sri Lanka records 14.06% in 2024, Nepal 7.05%, the Maldives 0.93%, and Bhutan 0.45%; Afghanistan’s latest value is 7.83% from 2020.
The large intra-regional spread does not automatically mean the high-share economies export more ICT services in dollars. Travel, transport, finance and other services also change the denominator.
| South Asia examples | Observation year | ICT-service share |
|---|---|---|
| India | 2025 | 48.60% |
| Pakistan | 2025 | 46.06% |
| Sri Lanka | 2024 | 14.06% |
| Bangladesh | 2025 | 8.79% |
| Afghanistan | 2020 | 7.83% |
| Nepal | 2024 | 7.05% |
| Maldives | 2024 | 0.93% |
| Bhutan | 2024 | 0.45% |
Northern Europe and the Baltics contain several high shares
Finland records 32.78%, Estonia 25.00%, Sweden 20.66%, Latvia 19.02%, Lithuania 12.44%, Iceland 10.62%, and Norway 8.93% in 2025. Denmark’s latest value is 7.46% in 2024.
The spatial cluster is visible, but the values do not converge to one level. Differences in the broader service-export mix and the structure of internationally traded digital and communications services still matter.
| Nordic and Baltic examples | Observation year | ICT-service share |
|---|---|---|
| Finland | 2025 | 32.78% |
| Estonia | 2025 | 25.00% |
| Sweden | 2025 | 20.66% |
| Latvia | 2025 | 19.02% |
| Lithuania | 2025 | 12.44% |
| Iceland | 2025 | 10.62% |
| Norway | 2025 | 8.93% |
| Denmark | 2024 | 7.46% |
Central and Eastern Europe also shows a high-share cluster
Ukraine’s latest observation is 38.18% in 2024. In 2025, Serbia records 29.86%, Moldova 27.77%, Romania 26.01%, Bulgaria 25.68%, North Macedonia 21.52%, and Poland 16.89%.
Croatia is lower at 7.77% in 2024, Slovenia 9.06% in 2025, and Hungary 11.27%. Geographic proximity therefore does not eliminate substantial differences in export-service composition.
| Central and Eastern Europe examples | Observation year | ICT-service share |
|---|---|---|
| Ukraine | 2024 | 38.18% |
| Serbia | 2025 | 29.86% |
| Moldova | 2025 | 27.77% |
| Romania | 2025 | 26.01% |
| Bulgaria | 2025 | 25.68% |
| North Macedonia | 2025 | 21.52% |
| Poland | 2025 | 16.89% |
| Hungary | 2025 | 11.27% |
| Slovenia | 2025 | 9.06% |
| Croatia | 2024 | 7.77% |
Kuwait is a clear outlier within the Gulf
Kuwait records 49.27% in 2025, while Bahrain is 8.26% in 2024, Oman 6.98%, the United Arab Emirates 4.58%, Saudi Arabia 3.62% in 2025, and Qatar 2.37%.
Economies in the same region can have very different denominators. Large travel, transport, finance or business-service exports can reduce ICT’s percentage even when the underlying ICT-service export value is substantial.
| Gulf examples | Observation year | ICT-service share |
|---|---|---|
| Kuwait | 2025 | 49.27% |
| Bahrain | 2024 | 8.26% |
| Oman | 2024 | 6.98% |
| United Arab Emirates | 2024 | 4.58% |
| Saudi Arabia | 2025 | 3.62% |
| Qatar | 2025 | 2.37% |
West Africa ranges from above 50% to below 1%
Guinea records 51.77%, Mali 33.34%, Guinea-Bissau 29.36%, and Niger 28.27%, all with latest observations from 2024. Cote d’Ivoire is 9.87%, Senegal 8.67%, Benin 3.04%, Ghana 0.61%, and the Gambia 0.31%.
The ratio cannot be explained by the size of the telecommunications sector alone. A relatively small denominator of other service exports can also raise the ICT share, while a broad service-export base can lower it.
| West Africa examples | Observation year | ICT-service share |
|---|---|---|
| Guinea | 2024 | 51.77% |
| Mali | 2024 | 33.34% |
| Guinea-Bissau | 2024 | 29.36% |
| Niger | 2024 | 28.27% |
| Cote d’Ivoire | 2024 | 9.87% |
| Senegal | 2023 | 8.67% |
| Togo | 2020 | 6.92% |
| Benin | 2023 | 3.04% |
| Ghana | 2025 | 0.61% |
| Gambia, The | 2024 | 0.31% |
Many Caribbean economies are below 3%
Jamaica’s latest value is 2.43% in 2024, while Dominica is 1.78%, St. Lucia 0.86%, St. Vincent and the Grenadines 0.79%, Grenada 0.72%, Antigua and Barbuda 0.55%, and the Dominican Republic 0.52%.
Travel-heavy service exports can mechanically make the ICT percentage smaller, but this indicator alone cannot prove that tourism is the reason for every low Caribbean observation.
| Caribbean examples | Observation year | ICT-service share |
|---|---|---|
| Jamaica | 2024 | 2.43% |
| Dominica | 2025 | 1.78% |
| St. Lucia | 2025 | 0.86% |
| St. Vincent and the Grenadines | 2025 | 0.79% |
| Grenada | 2025 | 0.72% |
| Antigua and Barbuda | 2025 | 0.55% |
| Dominican Republic | 2025 | 0.52% |
| Barbados | 2017 | 0.23% |
A low percentage does not prove ICT-service exports are small in dollars
Macao SAR, China records 0.03%, Sudan 0.06%, Lesotho 0.10%, and Tonga 0.12% in their latest observations. Those percentages describe composition, not absolute export value.
Absolute scale requires value series such as ICT service exports in current U.S. dollars and total service exports in current U.S. dollars. A large service exporter can have a low percentage and still export a significant value of ICT services.
| Low-end rank | Country or economy | Observation year | ICT-service share |
|---|---|---|---|
| 1 | Macao SAR, China | 2024 | 0.03% |
| 2 | Sudan | 2022 | 0.06% |
| 3 | Lesotho | 2025 | 0.10% |
| 4 | Tonga | 2024 | 0.12% |
| 5 | Barbados | 2017 | 0.23% |
| 6 | Papua New Guinea | 2024 | 0.26% |
| 7 | Palau | 2023 | 0.26% |
| 8 | Gambia, The | 2024 | 0.31% |
| 9 | St. Kitts and Nevis | 2025 | 0.36% |
| 10 | Cayman Islands | 2024 | 0.38% |
| 11 | Sint Maarten (Dutch part) | 2023 | 0.42% |
| 12 | Bhutan | 2024 | 0.45% |
| 13 | Congo, Dem. Rep. | 2025 | 0.46% |
| 14 | Fiji | 2024 | 0.47% |
| 15 | Jordan | 2024 | 0.51% |
A rising ICT share does not necessarily mean ICT export value increased
Both numerator and denominator move. If ICT-service exports are unchanged while travel, transport or other service exports fall, the ICT percentage can rise. Conversely, ICT exports can increase while the share falls if other services grow faster.
Time-series analysis should therefore pair the percentage with ICT-service export values and total service-export values before making statements about absolute growth.
ICT services and ICT goods are different trade statistics
Computers, telecom equipment, semiconductors and electronic components are goods and are recorded in merchandise trade. They are not added to the numerator of BX.GSR.CCIS.ZS simply because they are ICT products.
A country can be a major hardware exporter without having a high ICT-service share, while an economy with little hardware manufacturing can specialize in software, data, information or communications services.
Balance-of-payments exports are transactions between residents and non-residents
The balance of payments records international transactions between residents of an economy and non-residents. Domestic sales of software, cloud services or telecommunications to domestic customers are not international ICT-service exports.
That residence-based boundary is essential when comparing this indicator with broader measures of the domestic digital economy, which can include large amounts of activity that never cross an international border.
Mixed observation years are the main limitation of the latest-value map
Of the 190 latest observations, 94 are from 2025 and 64 from 2024, giving 158 observations from those two years. Fourteen are from 2023 and 18 are from 2022 or earlier; the oldest latest value dates to 2000.
The latest-non-empty approach broadens coverage but does not synchronize time. Point sizes on the map therefore distinguish 2025, 2024 and older observations rather than presenting every country as if it had a 2025 value.
| Observation year | Economies |
|---|---|
| 2025 | 94 |
| 2024 | 64 |
| 2023 | 14 |
| 2022 | 2 |
| 2021 | 2 |
| 2020 | 2 |
| 2019 | 1 |
| 2017 | 1 |
| 2016 | 4 |
| 2015 | 1 |
| 2014 | 2 |
| 2011 | 1 |
| 2010 | 1 |
| 2000 | 1 |
The simple country mean is not a service-export-weighted world ICT share
The 9.59% overall mean and 11.65% 2025 mean give every reporting economy equal weight. A large service exporter and a small economy each contribute one country percentage.
A global ICT share of service exports requires weighting by the value of service exports or using an official aggregate. The simple means here summarize the cross-country distribution only.
Source and calculation notes
The source is World Bank World Development Indicators series BX.GSR.CCIS.ZS, based on IMF Balance of Payments Statistics Yearbook and data files. The analysis uses 190 latest non-empty observations for rankings and distribution statistics and separately summarizes the 94 observations from 2025.
All 190 country codes are matched to geographic centroids for the map, producing a 100% match. No missing economy is filled with zero, and point size distinguishes observation-year recency.
Frequently Asked Questions
What services are included in ICT service exports?
The World Bank definition includes communications, postal and courier, computer and data, and information or news-related service transactions.
Does a high ICT-service share mean ICT export value is large?
Not necessarily. The indicator is a percentage of total service exports, so absolute ICT export value must be checked with a value series.
Are all 190 observations from 2025?
No. Ninety-four are from 2025, 64 from 2024, 14 from 2023, and the remaining latest observations are older.
Related Articles
Green Map creates custom-edited map images using open geographic data sources such as geoBoundaries, Natural Earth, OpenStreetMap, and government open data. These maps are edited visual materials, not raw data files, and are provided for education, documents, presentations, and graphic reference.