World Bank indicator SI.RMT.COST.IB.ZS measures the average total transaction cost of sending USD 200 to a specific destination country as a percentage of the amount sent. The latest non-empty dataset covers 104 economies: 93 observations are from 2023 and the remaining 11 are older, dating from 2016 to 2021.
Across all 104 latest observations, the simple mean is 3.53% and the median 2.88%. The published Malawi value of -49.69% is an extreme negative outlier that pulls the mean downward. For the 93 observations from 2023, the mean is 3.44%, but it rises to 4.01% when Malawi is excluded; the 2023 median is 3.22%.
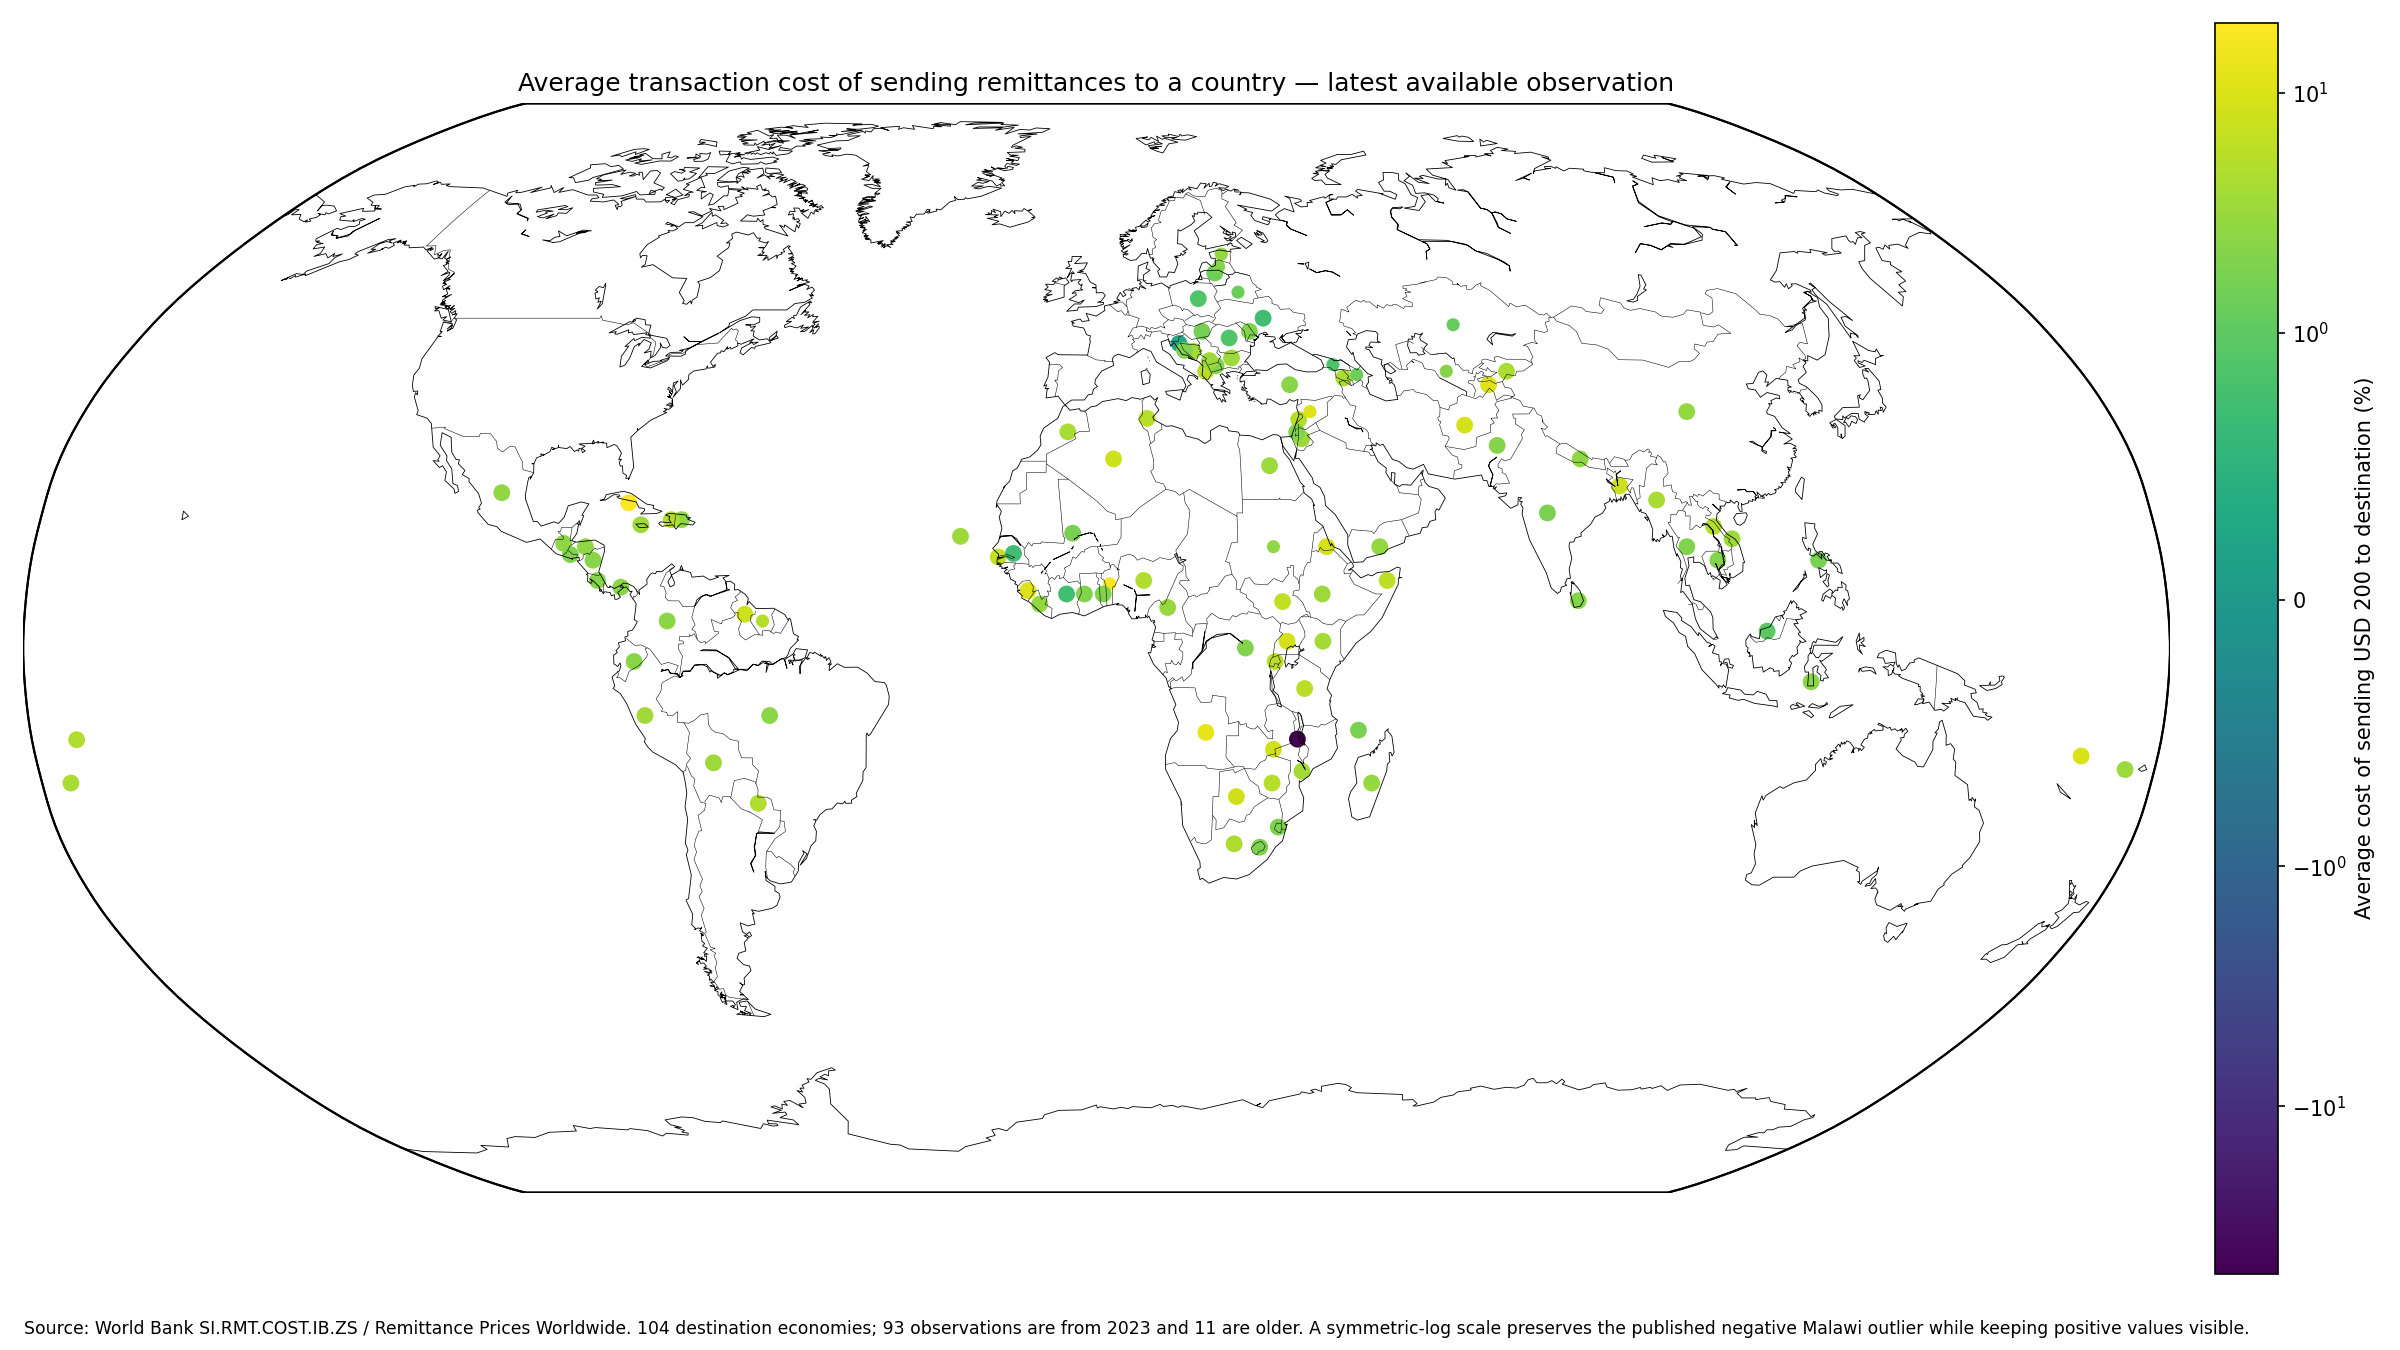
Table of Contents
The indicator measures the average cost of sending USD 200 to a destination
The World Bank metadata glossary defines the national inbound measure as the simple average of the total transaction cost charged by each remittance service provider in Remittance Prices Worldwide for sending USD 200 to a specific country, expressed as a percentage of the amount sent.
A 5% value is therefore roughly equivalent to an average total cost of USD 10 on a USD 200 transfer. It is not a guaranteed quote for an individual user, because actual prices vary by sending country, provider, payment instrument, receiving method, exchange rate and transfer channel.
Total cost combines the visible fee and the exchange-rate margin
The Remittance Prices Worldwide methodology treats the total cost as the transfer fee plus the exchange-rate margin. The exchange-rate margin captures the percentage difference between a market reference rate and the rate actually applied to the transaction.
A service with a small upfront fee can still be expensive when the exchange rate is unfavorable. Conversely, a somewhat larger fee can coexist with a small total cost if the exchange-rate margin is narrow. The indicator is designed to compare the combined cost rather than the advertised fee alone.
USD 200 is a standardized benchmark, not every transfer amount
RPW surveys standardized transfer amounts to make providers and corridors comparable. The WDI national-average indicator is defined around the cost of sending USD 200.
Pricing schedules often vary by amount, so the percentage cost of sending USD 50, USD 500 or USD 1,000 need not match the USD 200 benchmark. A real transfer decision should use a quote for the actual amount and corridor.
The 2023 median is 3.22%
Among the 93 observations dated 2023, the median is 3.22%, the first quartile 2.06% and the third quartile 4.70%. The mean is 3.44% with Malawi included and 4.01% across the other 92 observations.
45 of the 93 observations are below 3%, 26 are from 3% to under 5%, 18 are from 5% to under 10%, and 4 are at least 10%. Malawi is the only negative observation. The 3% level is important in SDG 10.c, but a national average below 3% does not prove that every provider or corridor serving that country is below the target.
| 2023 national-average cost band | Economies | Share of 93 |
|---|---|---|
| Below 0% | 1 | 1.1% |
| 0% to under 3% | 44 | 47.3% |
| 3% to under 5% | 26 | 28.0% |
| 5% to under 10% | 18 | 19.4% |
| 10% or more | 4 | 4.3% |
Cuba and Angola have the highest 2023 destination averages
Cuba records 19.63%, Angola 12.78%, Sierra Leone 10.34%, Tajikistan 10.33%, Vanuatu 9.49%, Eritrea 9.16%, Afghanistan 9.02%, Uganda 8.86%, Botswana 8.41%, and Zambia 8.13%.
A high national average can reflect the mix of corridors and providers, competition, foreign-exchange conditions, payment infrastructure, regulation, cash dependence and other market features. The indicator itself does not isolate which factor caused a country’s level.
| High 2023 destination averages | Average total cost |
|---|---|
| Cuba | 19.63% |
| Angola | 12.78% |
| Sierra Leone | 10.34% |
| Tajikistan | 10.33% |
| Vanuatu | 9.49% |
| Eritrea | 9.16% |
| Afghanistan | 9.02% |
| Uganda | 8.86% |
| Botswana | 8.41% |
| Zambia | 8.13% |
| Guyana | 7.92% |
| Algeria | 7.83% |
| Bangladesh | 7.65% |
| Gambia, The | 6.76% |
| South Sudan | 6.47% |
Malawi’s -49.69% is a published but extreme exception
The 2023 Malawi value is -49.69% in the underlying World Bank series. Because total cost includes the exchange-rate margin, a sufficiently favorable applied exchange rate relative to the market reference rate can produce a negative margin and an arithmetically negative total-cost average.
The value is far outside the normal range and should not be translated into the simple claim that senders routinely receive a 49.69% rebate. It is preserved as published, but the article reports the median and the mean excluding Malawi to show how strongly this one observation affects summary statistics.
| Low 2023 destination averages | Average total cost |
|---|---|
| Malawi | -49.69% |
| Croatia | 0.27% |
| Ukraine | 0.72% |
| Senegal | 0.72% |
| Cote d’Ivoire | 0.74% |
| Romania | 0.87% |
| Poland | 0.87% |
| Malaysia | 0.98% |
| Lithuania | 1.40% |
| Hungary | 1.61% |
| Philippines | 1.67% |
| Mali | 1.73% |
| Comoros | 1.74% |
| India | 1.76% |
| Lesotho | 1.82% |
Several Eastern European destinations have averages near or below 2%
Croatia records 0.27%, Ukraine 0.72%, Romania 0.87%, Poland 0.87%, Lithuania 1.40%, Hungary 1.61%, Serbia 1.94%, and Moldova 2.01% in 2023. Bulgaria is higher at 3.46%.
The geographic cluster is descriptive rather than causal. The origin-country mix and provider set can differ by destination, so neighboring receiving markets do not necessarily face identical remittance-market conditions.
| Eastern Europe examples | Observation year | Average total cost |
|---|---|---|
| Bulgaria | 2023 | 3.46% |
| Moldova | 2023 | 2.01% |
| Serbia | 2023 | 1.94% |
| Hungary | 2023 | 1.61% |
| Lithuania | 2023 | 1.40% |
| Poland | 2023 | 0.87% |
| Romania | 2023 | 0.87% |
| Ukraine | 2023 | 0.72% |
| Croatia | 2023 | 0.27% |
West Africa ranges from below 1% to double digits
Sierra Leone is at 10.34% and the Gambia 6.76%, while Senegal is 0.72%, Cote d’Ivoire 0.74%, Mali 1.73%, Ghana 2.01%, and Togo 2.06%. Benin’s latest value is 17.35%, but it dates to 2020 rather than 2023.
That combination shows why both value and observation year matter. A latest-value map broadens coverage, but older observations should not be presented as if they describe the same 2023 market conditions.
| West Africa examples | Observation year | Average total cost |
|---|---|---|
| Benin | 2020 | 17.35% |
| Sierra Leone | 2023 | 10.34% |
| Gambia, The | 2023 | 6.76% |
| Togo | 2023 | 2.06% |
| Ghana | 2023 | 2.01% |
| Mali | 2023 | 1.73% |
| Cote d’Ivoire | 2023 | 0.74% |
| Senegal | 2023 | 0.72% |
South Asia also shows a large spread
Afghanistan records 9.02% and Bangladesh 7.65%, while Nepal is 2.53%, Sri Lanka 2.19%, Pakistan 2.14%, and India 1.76%. All six observations are from 2023, so the differences are not caused by mixed years.
Corridor competition, digital channels, cash networks, exchange-rate arrangements and the set of major sending countries can differ across destinations. Users should consult corridor-level data when choosing an actual service.
| South Asia examples | Observation year | Average total cost |
|---|---|---|
| Afghanistan | 2023 | 9.02% |
| Bangladesh | 2023 | 7.65% |
| Nepal | 2023 | 2.53% |
| Sri Lanka | 2023 | 2.19% |
| Pakistan | 2023 | 2.14% |
| India | 2023 | 1.76% |
The Americas include both the highest value and many sub-3% averages
Cuba is at 19.63%, Guyana 7.93%, Haiti 4.70%, and Paraguay 4.66%. Mexico is 2.65%, the Dominican Republic 2.52%, Panama 2.49%, Brazil 2.42%, Colombia 2.43%, Ecuador 2.30%, Costa Rica 2.26%, and El Salvador 2.00%.
A receiving-country average compresses many origin-destination corridors into one number. A sender from one country can therefore face a very different price from a sender using another corridor to the same destination.
| Americas examples | Observation year | Average total cost |
|---|---|---|
| Cuba | 2023 | 19.63% |
| Guyana | 2023 | 7.92% |
| Haiti | 2023 | 4.70% |
| Paraguay | 2023 | 4.66% |
| Mexico | 2023 | 2.65% |
| Dominican Republic | 2023 | 2.52% |
| Panama | 2023 | 2.49% |
| Colombia | 2023 | 2.43% |
| Brazil | 2023 | 2.42% |
| Ecuador | 2023 | 2.30% |
| Costa Rica | 2023 | 2.26% |
| El Salvador | 2023 | 2.00% |
The national measure is a simple provider-price average, not transaction weighted
The World Bank national average gives each observed remittance service price a place in the simple average. It does not weight providers by how many customers use them or corridors by the volume of money transferred.
A low-cost provider with a very large market share and a high-cost provider with little usage can both influence the simple average as price observations. The statistic is therefore a standardized market-price measure rather than an estimate of the exact average cost actually paid across all remittance dollars.
Providers that do not disclose the exchange rate can be excluded
World Bank metadata states that providers are excluded when they do not disclose the exchange rate used for the transaction. Without that rate, the exchange-rate margin and total comparable cost cannot be calculated consistently.
The resulting country average therefore covers the providers and corridors captured by RPW, not every formal and informal method through which money might reach a country.
The annual WDI value represents third-quarter data
The WDI metadata describes the source as quarterly data represented annually and notes that the reference-year value reflects third-quarter data. The 2023 observation is therefore not a twelve-month average of every transfer price charged during 2023.
Remittance prices can change with promotions, exchange rates, competition and regulation. Users needing the latest market quote should use the current corridor pages in Remittance Prices Worldwide rather than treating the WDI annual value as a live price.
Eleven of the 104 latest observations predate 2023
Ninety-three latest observations are from 2023. Azerbaijan, Belarus, Estonia, Georgia, Kazakhstan, Latvia and Uzbekistan are from 2021; Benin is from 2020, Suriname from 2017, and Sudan and the Syrian Arab Republic from 2016.
The map therefore uses larger points for 2023 and smaller points for older observations. It is a latest-available coverage map rather than a fully synchronized 2023 world map.
| Latest observation year | Economies |
|---|---|
| 2023 | 93 |
| 2021 | 7 |
| 2020 | 1 |
| 2017 | 1 |
| 2016 | 2 |
The SDG 3% target and 5% corridor ceiling are not identical to this national average
SDG 10.c calls for reducing migrant-remittance transaction costs below 3% and eliminating corridors above 5%. SI.RMT.COST.IB.ZS is an average across services sending money into one destination country.
A national average below 3% can coexist with individual providers or corridors above 5%, while a country average above 3% can still offer low-cost digital options. Formal target assessment requires the underlying corridor and provider distribution.
Source and calculation notes
The source is World Bank World Development Indicators series SI.RMT.COST.IB.ZS, based on Remittance Prices Worldwide. The analysis separates the 104 latest non-empty observations from the synchronized 93-country 2023 subset and calculates means, medians, quartiles, bands, rankings and regional comparisons directly from the supplied values.
All 104 country codes are matched to geographic centroids for the map, producing a 100% match. The published negative Malawi value is retained rather than zero-filled or deleted. Symmetric-log normalization is used only for the visual scale; table and text values remain unchanged.
Frequently Asked Questions
Does the remittance-cost indicator include only the transfer fee?
No. Total cost combines the sender fee with the exchange-rate margin relative to the market reference rate.
Why is Malawi’s 2023 value negative?
The World Bank series publishes -49.69%. Because exchange-rate margin is part of total cost, an unusually favorable applied rate can make the arithmetic total negative; the value is an extreme outlier.
Does a national average below 3% mean every corridor meets the SDG target?
No. The national figure averages provider prices to a destination; individual corridors and services can still be above or below the target.
Related Articles
Green Map creates custom-edited map images using open geographic data sources such as geoBoundaries, Natural Earth, OpenStreetMap, and government open data. These maps are edited visual materials, not raw data files, and are provided for education, documents, presentations, and graphic reference.