World Bank indicator SE.SEC.PRIV.ZS provides a latest non-empty estimate of the private share of secondary-school enrollment for 196 countries and economies. Observation years range from 1999 to 2025. The unweighted country mean is 21.74%, the median 14.48%, the first quartile 7.16%, and the third quartile 28.52%.
The indicator is about students, not the number of schools. Its numerator is students enrolled in private secondary institutions, while its denominator is total secondary enrollment in both public and private institutions. It therefore describes the structure of enrollment by provider rather than school counts or the share of all secondary-age children who attend private school.
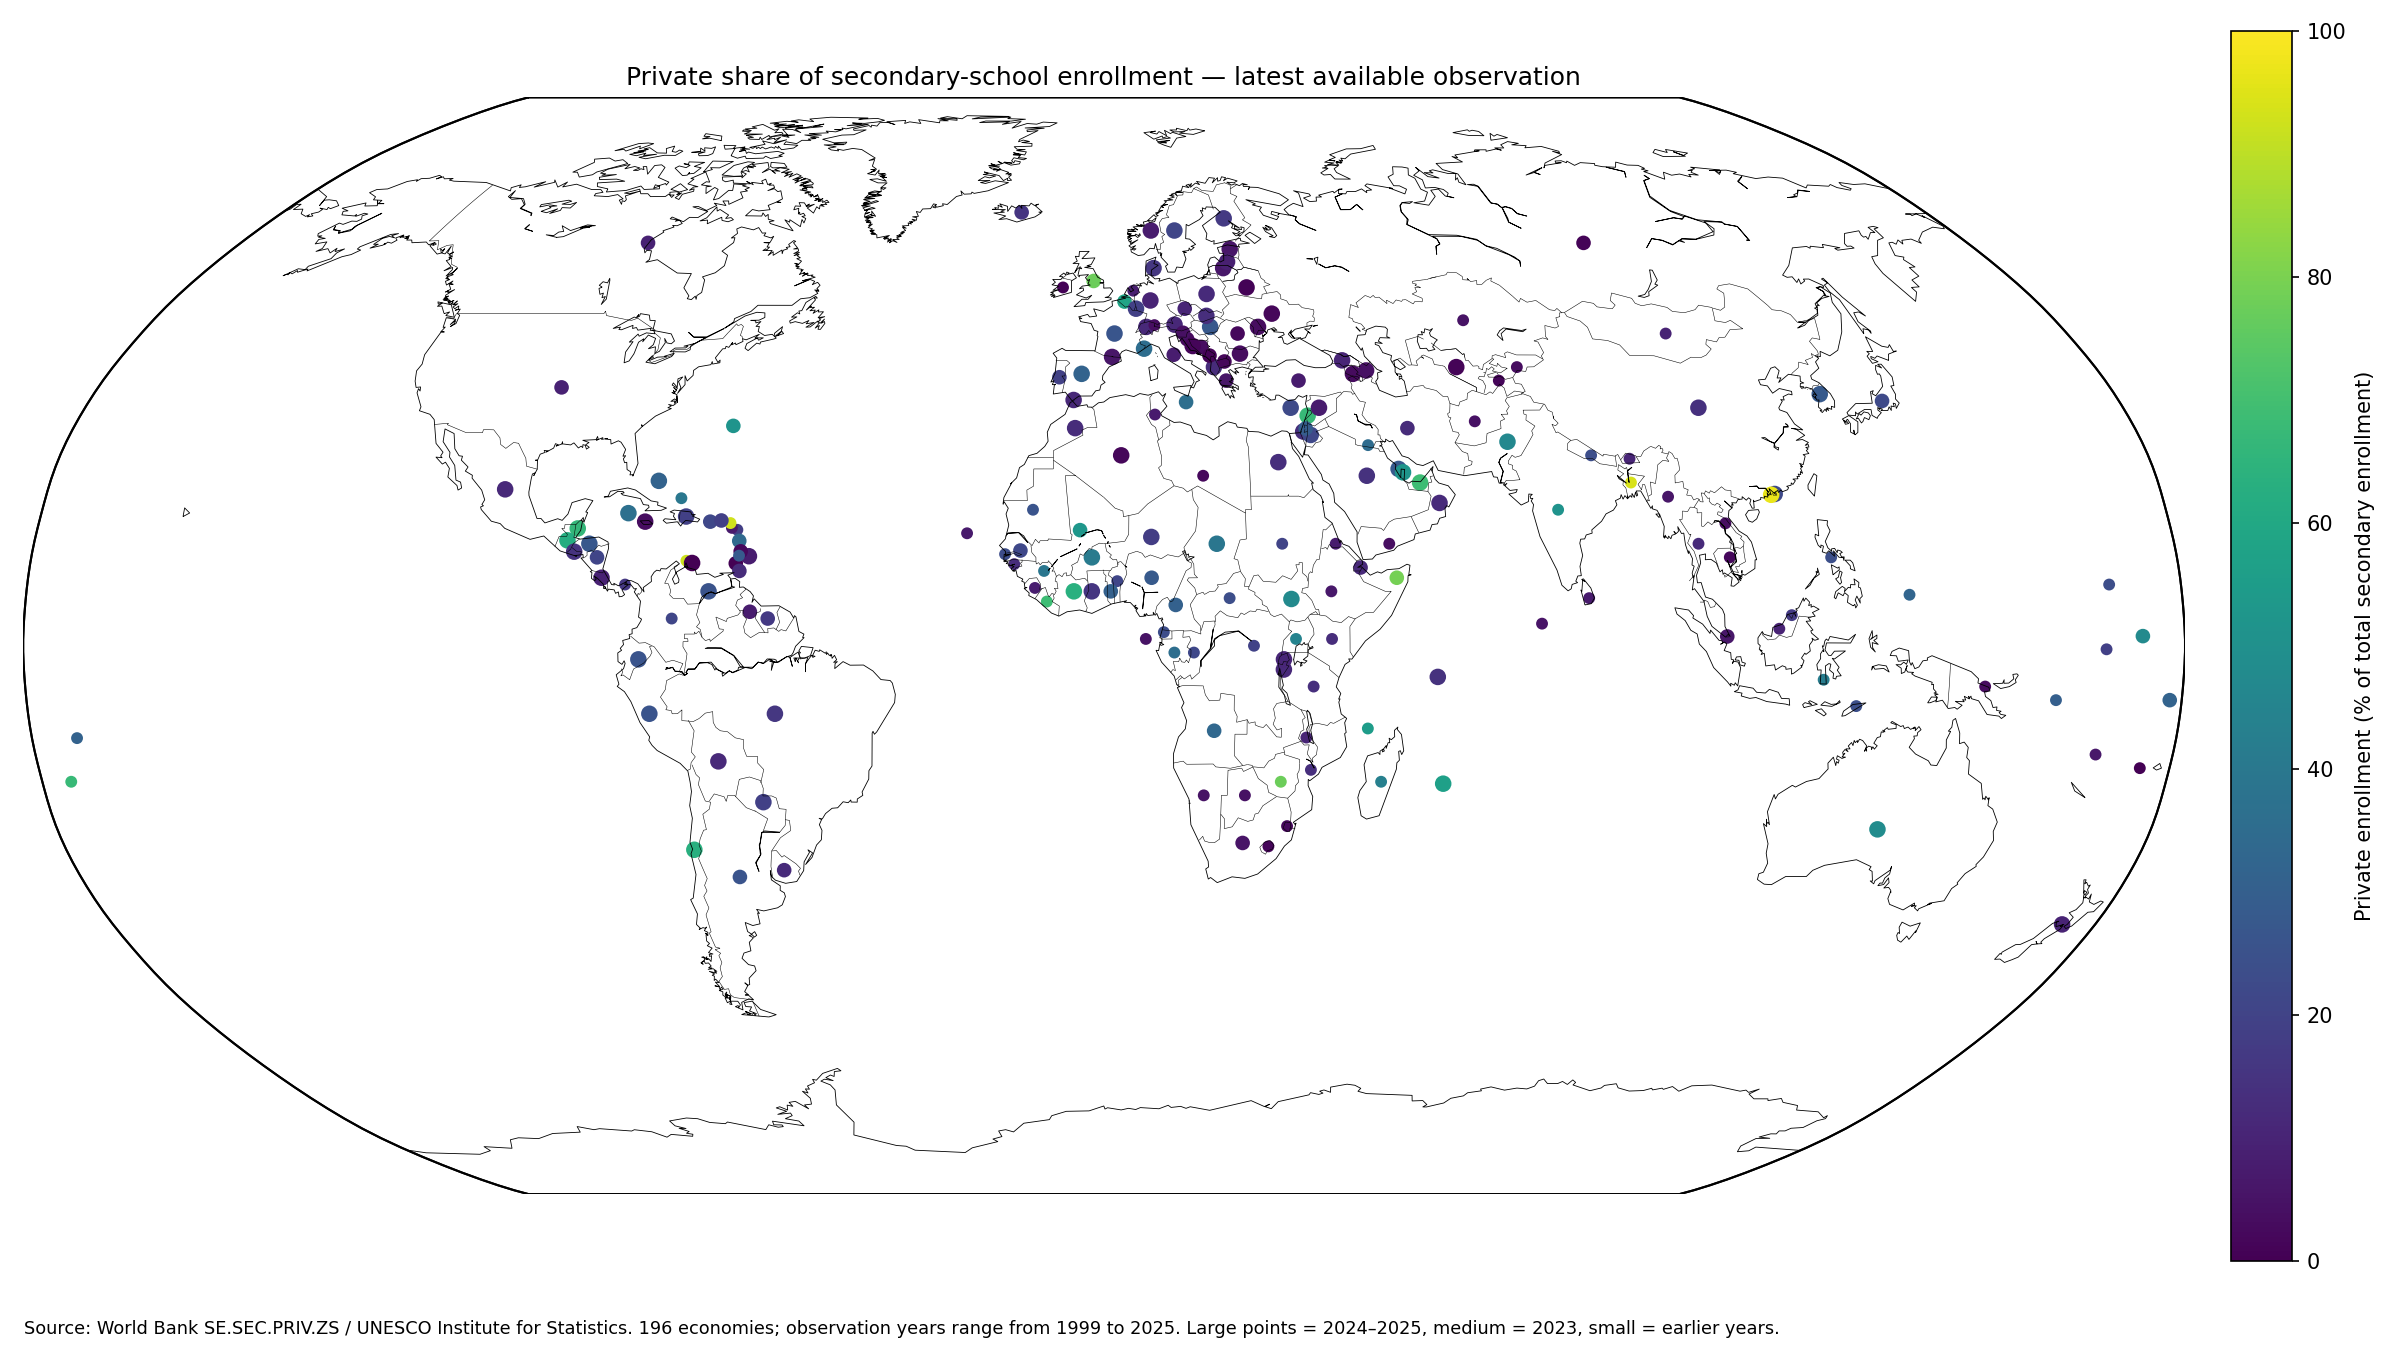
Table of Contents
What the private secondary-enrollment share measures
The World Bank metadata glossary states that the indicator is calculated by dividing the number of students enrolled in private educational institutions at the secondary level by total secondary enrollment in public and private institutions, then multiplying by 100.
A value of 30% therefore means roughly 30 of every 100 enrolled secondary students are in private institutions. It does not mean 30% of all adolescents are enrolled in private secondary education because adolescents who are not enrolled are outside the denominator.
Private status is based on control and management
The UNESCO Institute for Statistics definition describes a private educational institution as one controlled and managed by a non-governmental body, or governed mainly by members not selected by a public agency.
Private institutions can be operated by religious organizations, nonprofit foundations, nongovernmental organizations, communities, businesses, or other private bodies. For-profit status is not the defining criterion, and government subsidies do not automatically turn a privately controlled institution into a public one.
The median latest observation is 14.48%
The median across the 196 latest observations is 14.48%. The middle half lies between 7.16% and 28.52%. The simple mean of 21.74% is higher than the median because a relatively small set of observations above 60% extends the upper tail.
37 observations are below 5%, 31 are from 5% to under 10%, 48 from 10% to under 20%, 50 from 20% to under 40%, 15 from 40% to under 60%, and 15 are at least 60%.
| Latest private-enrollment share | Economies | Share of 196 |
|---|---|---|
| Below 5% | 37 | 18.9% |
| 5% to under 10% | 31 | 15.8% |
| 10% to under 20% | 48 | 24.5% |
| 20% to under 40% | 50 | 25.5% |
| 40% to under 60% | 15 | 7.7% |
| 60% or more | 15 | 7.7% |
The highest latest observations include older survey years
Macao SAR, China records the highest latest value at 96.68%, followed by Bangladesh at 93.90%, Sint Maarten at 92.72%, and Aruba at 92.38%.
Bangladesh is a 2017 observation, while Sint Maarten and Aruba are from 2012. The full table is therefore a latest-available comparison rather than a ranking for one current year.
| Latest-observation rank | Country or economy | Observation year | Private share of secondary enrollment |
|---|---|---|---|
| 1 | Macao SAR, China | 2024 | 96.68% |
| 2 | Bangladesh | 2017 | 93.90% |
| 3 | Sint Maarten (Dutch part) | 2012 | 92.72% |
| 4 | Aruba | 2012 | 92.38% |
| 5 | Somalia, Fed. Rep. | 2023 | 79.19% |
| 6 | United Kingdom | 2023 | 77.45% |
| 7 | Zimbabwe | 2012 | 77.41% |
| 8 | United Arab Emirates | 2024 | 68.68% |
| 9 | Liberia | 2020 | 68.45% |
| 10 | Tonga | 2020 | 67.42% |
| 11 | Lebanon | 2024 | 67.29% |
| 12 | Belize | 2024 | 66.39% |
| 13 | Cote d’Ivoire | 2024 | 63.32% |
| 14 | Chile | 2024 | 63.23% |
| 15 | Guatemala | 2024 | 61.83% |
A synchronized 2024 comparison covers 77 economies
Among the 77 observations from 2024, Macao SAR, China records 96.68%, the United Arab Emirates 68.68%, Lebanon 67.29%, Belize 66.39%, Cote d’Ivoire 63.32%, and Chile 63.23%.
| 2024 rank | Country or economy | Private share of secondary enrollment |
|---|---|---|
| 1 | Macao SAR, China | 96.68% |
| 2 | United Arab Emirates | 68.68% |
| 3 | Lebanon | 67.29% |
| 4 | Belize | 66.39% |
| 5 | Cote d’Ivoire | 63.32% |
| 6 | Chile | 63.23% |
| 7 | Guatemala | 61.83% |
| 8 | Mauritius | 56.36% |
| 9 | Qatar | 52.05% |
| 10 | Australia | 48.05% |
| 11 | South Sudan | 47.58% |
| 12 | Pakistan | 46.84% |
| 13 | Burkina Faso | 41.21% |
| 14 | Chad | 39.32% |
| 15 | Cayman Islands | 36.70% |
The 2024 subset has an unweighted mean of 22.31% and a median of 14.50%. The first quartile is 9.60% and the third quartile 28.11%. 11 observations are below 5%, 10 from 5% to under 10%, 26 from 10% to under 20%, 17 from 20% to under 40%, 6 from 40% to under 60%, and 7 are at least 60%.
Only one latest observation is from 2025
Burundi is the only economy in this latest-value file with a 2025 observation, at 11.67%. A source period extending to 2025 does not mean all 196 economies have 2025 data.
There are 77 observations from 2024 and 45 from 2023, giving 123 observations from 2023 or later. Extending the window to 2022 or later gives 130, while 44 latest observations are older than 2020.
| Observation year | Economies |
|---|---|
| 2025 | 1 |
| 2024 | 77 |
| 2023 | 45 |
| 2022 | 7 |
| 2021 | 10 |
| 2020 | 12 |
| 2019 | 6 |
| 2018 | 10 |
| 2017 | 4 |
| 2016 | 6 |
| 2015 | 2 |
| 2014 | 1 |
| 2013 | 2 |
| 2012 | 4 |
| 2009 | 1 |
| 2007 | 2 |
| 2006 | 1 |
| 2004 | 2 |
| 2002 | 1 |
| 2000 | 1 |
| 1999 | 1 |
A high private share does not mean high secondary enrollment
The denominator includes only students who are enrolled in secondary education. Children of secondary-school age who are out of school are not counted in the private-share denominator.
A country can therefore have a high private share and a low overall enrollment rate, or a low private share and a high enrollment rate. Gross enrollment ratios, net enrollment rates, and out-of-school rates answer participation questions that this indicator does not.
The indicator is not the share of schools that are private
A country can have a small number of large private schools and a high private share of students, or many small private schools and a low student share. Institution counts and student enrollment shares are different statistics.
Questions about the number or percentage of private schools require school-level institution counts. This series measures enrolled students only.
A high private share is not a measure of educational quality
The indicator contains no direct information on learning outcomes, teacher qualifications, class size, tuition, affordability, facilities, or student selection. A high or low private share cannot establish whether education quality is better or worse.
Comparing outcomes across public and private schools requires additional evidence and careful adjustment for student backgrounds, selection, public subsidies, and local context.
Private does not mean for-profit
UNESCO’s definition includes institutions managed by religious bodies, NGOs, foundations, associations, businesses, and other non-governmental entities. Many private institutions are nonprofit.
The legal and funding arrangements of private education differ substantially across countries, so the same 30% enrollment share can reflect very different institutional systems.
Unregistered private schools may be undercounted
World Bank metadata warns that religious or private schools that are not registered with the government or do not follow the common national curriculum may not be captured in official data.
A very low recorded private share should therefore not automatically be interpreted as proof that non-public education is absent. Statistical coverage depends on national registration and reporting systems.
The reference year can represent a school year spanning two calendar years
UIS education statistics use a reference year associated with the school year. If a school year runs from September 2023 through June 2024, for example, the observation can be labeled 2024.
Countries also use different academic calendars. A common 2024 label improves comparability but does not guarantee that every observation covers exactly the same months.
Reported zero is different from missing data
Two of the 196 numeric latest observations are exactly 0%. These are reported numeric values rather than missing observations converted to zero. All 196 rows used here contain a number because the World Bank query retrieves the most recent non-empty observation.
A recorded zero means no private-secondary enrollment was reported within the official statistical coverage for that observation. It cannot by itself establish whether unregistered or nonstandard institutions existed outside the reporting system.
The simple country mean is not a global student-weighted share
The 21.74% simple mean gives every one of the 196 economies equal weight. A country with millions of secondary students and a small territory each contribute one observation.
A global share of secondary students in private institutions would require weighting by total secondary enrollment in each country. That is different from the simple mean used here to summarize the cross-country distribution.
Source and calculation notes
The source is World Bank World Development Indicators series SE.SEC.PRIV.ZS, based on UNESCO Institute for Statistics data. The analysis uses 196 latest non-empty observations to calculate mean, median, quartiles, distribution bands and rankings, and separately summarizes the 77 observations from 2024.
All 196 country codes are matched to geographic centroids for the map, producing a 100% match. Point size distinguishes 2024–2025, 2023 and earlier observations, and no missing value is filled with zero.
Frequently Asked Questions
Is the private secondary-school share the percentage of schools that are private?
No. It is the number of students enrolled in private secondary institutions divided by total secondary enrollment in public and private institutions.
Does a high private share mean a high secondary-enrollment rate?
Not necessarily. This indicator describes the public-private composition of students who are already enrolled; overall participation requires enrollment-rate indicators.
Are all 196 observations from 2025?
No. Observation years range from 1999 to 2025, and Burundi is the only 2025 observation in this latest-value dataset.
Related Articles
Green Map creates custom-edited map images using open geographic data sources such as geoBoundaries, Natural Earth, OpenStreetMap, and government open data. These maps are edited visual materials, not raw data files, and are provided for education, documents, presentations, and graphic reference.