U.S. Energy Information Administration data for 2025 show that Texas had the largest all-fuel energy consumption among IPP Non-CHP plants, at 2,643.43 million MMBtu. Pennsylvania followed with 1,992.00, Illinois with 1,639.64, and Ohio with 1,033.94. The dataset covers all 50 states plus the District of Columbia, with no missing or zero values.
Adding the 51 state and District values gives 12,915.37 million MMBtu. One MMBtu equals one million Btu, so one million MMBtu equals one trillion Btu. On that basis, the state sum is about 12.92 quadrillion Btu, while Texas alone is about 2.64 quadrillion Btu. The sum is presented as a direct total of the supplied state observations rather than relabeled as a separate official U.S. aggregate.
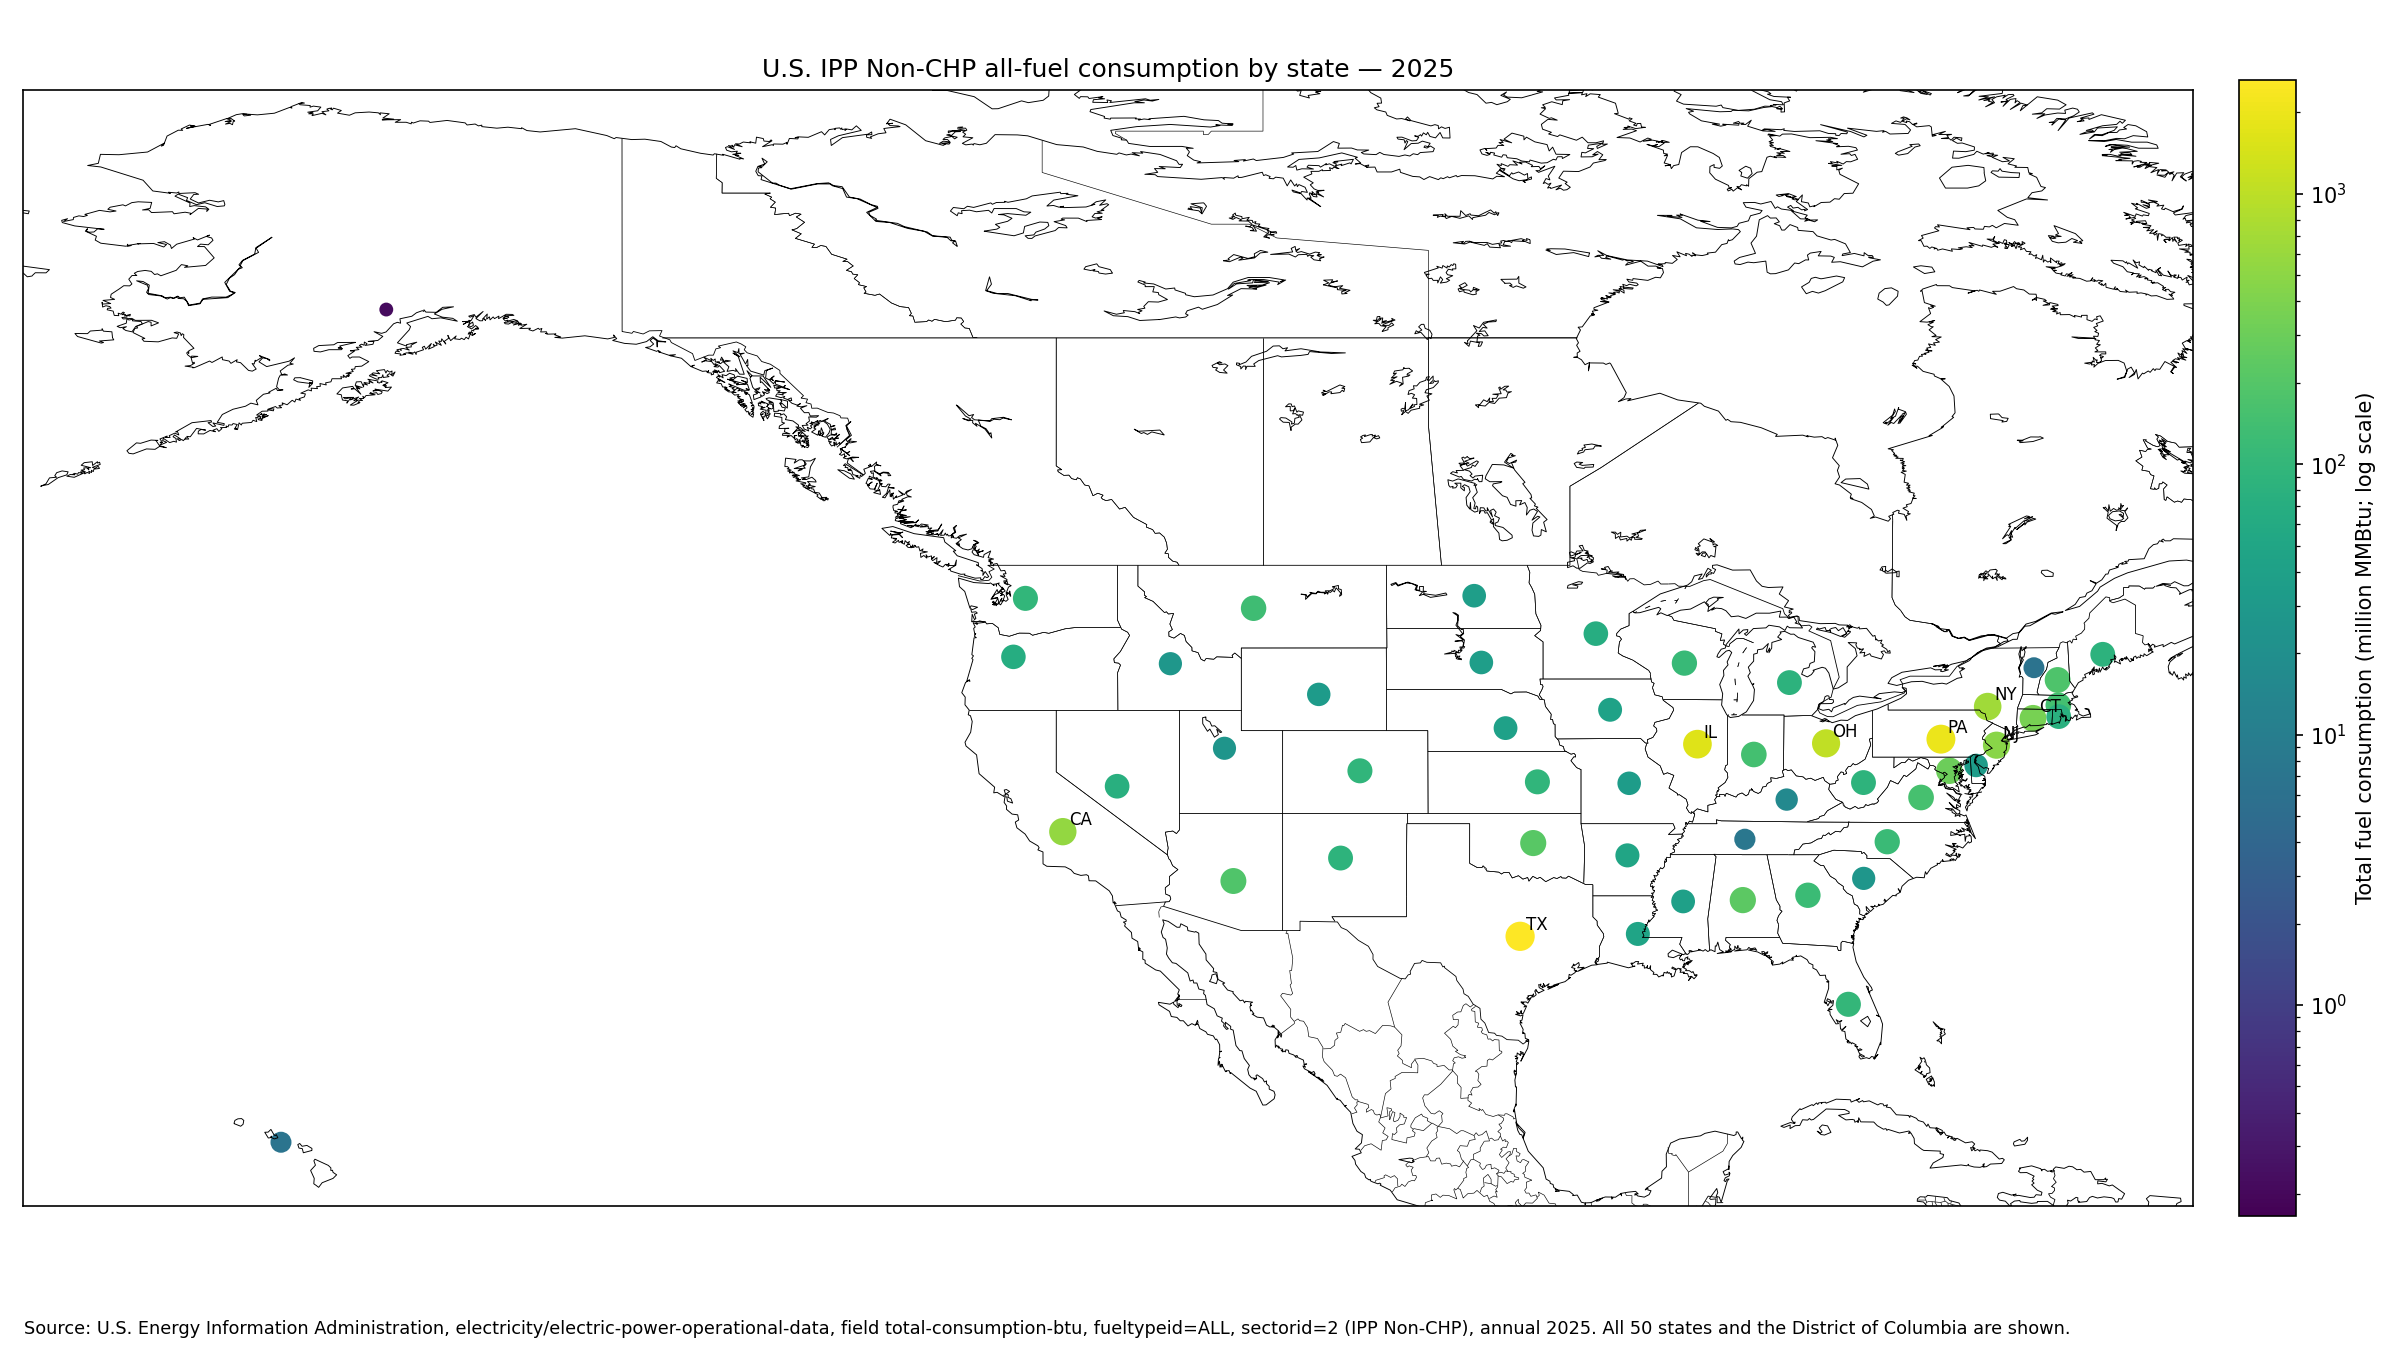
Table of Contents
What IPP Non-CHP means
The EIA Guide to Electric Power Data divides generating plants into industry sectors. Sector 2 is independent power producers that are not combined heat and power plants. These are producers whose primary business is selling electricity but whose selected facilities are classified as non-CHP.
This means the figures are not all U.S. power-plant fuel consumption. Electric utilities, IPP CHP plants, and commercial or industrial generating facilities are separate EIA sectors. The present comparison isolates sectorid=2.
The ALL fuel facet is an aggregate
fueltypeid=ALL combines the fuel categories included in the selected EIA route. It does not show natural gas, coal, petroleum, or any other individual fuel separately.
That makes the metric useful for comparing total energy input across states, but not for identifying each state’s fuel mix. Fuel-specific analysis requires the corresponding EIA fuel facets.
total-consumption-btu is not electricity sold to customers
The field is total-consumption-btu. It represents the heat content of fuels consumed by the selected generating sector, expressed in Btu terms. It is not retail electricity consumption, retail sales, or net generation measured in MWh.
Generation and fuel input are related but not interchangeable. Two plant fleets producing the same amount of electricity can consume different amounts of fuel because technologies, fuels, operating conditions, and heat rates differ.
Texas accounts for about one-fifth of the 51-state sum
Texas represents 20.5% of the sum of all 51 observations. Pennsylvania contributes 15.4%, Illinois 12.7%, and Ohio 8.0%. Together the top four account for 56.6%.
The top five states account for 61.7% and the top ten for 76.6%. The geographic distribution is therefore highly concentrated. Explaining why requires additional variables such as capacity, generation, fuel mix, and plant utilization.
| Rank | State or district | Million MMBtu | Share of 51-state sum |
|---|---|---|---|
| 1 | Texas | 2,643.43 | 20.5% |
| 2 | Pennsylvania | 1,992.00 | 15.4% |
| 3 | Illinois | 1,639.64 | 12.7% |
| 4 | Ohio | 1,033.94 | 8.0% |
| 5 | New York | 660.95 | 5.1% |
| 6 | California | 551.76 | 4.3% |
| 7 | New Jersey | 480.55 | 3.7% |
| 8 | Connecticut | 365.09 | 2.8% |
| 9 | Maryland | 295.42 | 2.3% |
| 10 | Alabama | 232.89 | 1.8% |
| 11 | Oklahoma | 211.58 | 1.6% |
| 12 | Arizona | 186.84 | 1.4% |
| 13 | New Hampshire | 175.91 | 1.4% |
| 14 | Virginia | 153.46 | 1.2% |
| 15 | Massachusetts | 146.94 | 1.1% |
Pennsylvania and Illinois also exceed 1.5 quadrillion Btu
Pennsylvania’s 1,992.00 million MMBtu is about 1.99 quadrillion Btu, while Illinois reaches roughly 1.64 quadrillion Btu. Ohio is just above 1 quadrillion Btu at 1.03.
Below those four, New York records 660.95 million MMBtu, California 551.76, New Jersey 480.55, and Connecticut 365.09. Six jurisdictions are at or above 500 million MMBtu.
The median is 85.34 million MMBtu
The unweighted mean across the 51 jurisdictions is 253.24 million MMBtu, while the median is only 85.34. The first quartile is 35.94 and the third quartile 164.69.
The mean is roughly three times the median because the largest states create a long upper tail. Median and quartiles therefore describe a typical state observation better than the mean alone.
Thirty jurisdictions are below 100 million MMBtu
5 jurisdictions are below 10 million MMBtu, 14 are from 10 to under 50, and 11 are from 50 to under 100. Together those groups contain 30 of the 51 observations.
Another 12 are from 100 to under 250, 3 from 250 to under 500, and only 6 are at least 500 million MMBtu.
| 2025 consumption band (million MMBtu) | Jurisdictions | Share of 51 |
|---|---|---|
| Below 10 | 5 | 9.8% |
| 10 to under 50 | 14 | 27.5% |
| 50 to under 100 | 11 | 21.6% |
| 100 to under 250 | 12 | 23.5% |
| 250 to under 500 | 3 | 5.9% |
| 500 or more | 6 | 11.8% |
The District of Columbia and Alaska are at the low end
The District of Columbia has the smallest value at 0.16539 million MMBtu, followed by Alaska at 0.21563, Vermont at 6.52, Hawaii at 6.81, and Tennessee at 7.56.
A small value does not mean the jurisdiction uses little electricity overall. It means the selected IPP Non-CHP sector reports little all-fuel consumption in that jurisdiction. Other utility and plant sectors can dominate the local power system.
| Low-end rank | State or district | Million MMBtu |
|---|---|---|
| 1 | District of Columbia | 0.17 |
| 2 | Alaska | 0.22 |
| 3 | Vermont | 6.52 |
| 4 | Hawaii | 6.81 |
| 5 | Tennessee | 7.56 |
| 6 | Kentucky | 15.56 |
| 7 | Utah | 25.83 |
| 8 | South Carolina | 27.05 |
| 9 | Idaho | 27.31 |
| 10 | Wyoming | 31.91 |
| 11 | Missouri | 33.44 |
| 12 | Delaware | 33.60 |
| 13 | North Dakota | 35.89 |
| 14 | South Dakota | 35.99 |
| 15 | Mississippi | 39.45 |
Why Non-CHP must be separated from CHP
Combined heat and power plants use fuel to produce electricity and useful thermal output together. Non-CHP plants are outside that combined-output category. EIA therefore separates IPP Non-CHP and IPP CHP into different sectors.
The field name total-consumption-btu is available across the operational-data route, but the sector facet determines which plant class is included. This slice excludes IPP CHP plants and should not be generalized to all independent power producers.
Net generation is a useful companion metric
Comparing the same sector’s net generation with its fuel input can help explain how much electricity output is associated with the reported energy input. States with large generation often have large fuel consumption, but the relationship is not one-to-one.
Any heat-rate calculation should first confirm identical plant-sector, fuel, and time coverage in both series. Dividing mismatched totals can create a misleading efficiency number.
High fuel consumption does not equal low efficiency
Absolute fuel consumption is strongly affected by system scale. A state with many large plants can consume much more fuel even if its generating fleet operates efficiently. A small fleet can have low total consumption while still using fuel inefficiently.
Heat rate, measured as Btu of fuel input per kWh of electricity output, is a more direct efficiency concept. The present dataset is a map of total energy input rather than a performance score.
The aggregate hides fuel composition
The ALL facet adds fuel categories together on a common Btu basis. Two states with similar totals can rely on very different mixes of fuels.
Questions about fuel switching, emissions, or commodity dependence require the fuel-specific EIA observations. Total Btu alone cannot reveal carbon intensity.
This is also different from electricity consumption by end users
The data are measured on the generation side, not at households and businesses. Retail electricity sales and customer consumption use different EIA datasets and different units.
Electricity can also cross state lines after it is generated. The geographic location of fuel consumption at power plants is therefore not the same as the location of final electricity use.
A common 2025 year makes the state comparison clean
All 51 observations are annual values for 2025. Unlike a latest-value dataset with different years, Texas, Pennsylvania, California, and every other jurisdiction are compared over the same reference period.
Coverage is also complete for the stated geography: all 50 states and the District of Columbia have numeric values, with no missing row converted to zero.
The map uses logarithmic visual scaling
The largest value, 2,643.43, is more than four orders of magnitude above the minimum of 0.16539 million MMBtu. A linear color scale would compress most states into nearly the same appearance.
The map therefore uses logarithmic color and point-size scaling for readability. The underlying state values are not transformed in the tables or calculations.
The state sum is kept distinct from a separately published U.S. aggregate
The 51 supplied observations sum to 12,915.37 million MMBtu, or about 12.92 quadrillion Btu. Because a separate EIA national aggregate can use its own rounding or aggregation rules, the article labels this number as the state-and-District sum.
This avoids implying that a derived sum and an independently published national total are automatically identical in every decimal place.
Source and calculation notes
The source is the U.S. Energy Information Administration API, electricity/electric-power-operational-data, with frequency=annual, year=2025, field=total-consumption-btu, fueltypeid=ALL, and sectorid=2. The EIA Electricity Data page provides related generation and fuel-consumption resources.
Mean, median, quartiles, rankings, distribution bands, concentration shares, and the 51-jurisdiction sum are calculated directly from the 51 published observations. Every state code and the District of Columbia are matched to the map.
Frequently Asked Questions
What does IPP Non-CHP mean?
It is EIA sector 2: independent power producers whose primary business is selling electricity and whose selected plants are not combined heat and power facilities.
How much energy is one million MMBtu?
One MMBtu is one million Btu, so one million MMBtu equals one trillion Btu. One thousand million MMBtu equals one quadrillion Btu.
Does higher fuel consumption mean lower generation efficiency?
No. This is an absolute energy-input total that is strongly affected by plant scale and generation. Efficiency requires a metric such as heat rate.
Related Articles
Green Map creates custom-edited map images using open geographic data sources such as geoBoundaries, Natural Earth, OpenStreetMap, and government open data. These maps are edited visual materials, not raw data files, and are provided for education, documents, presentations, and graphic reference.