World Bank indicator SH.STA.BFED.ZS provides a latest non-empty exclusive-breastfeeding observation for 148 countries and territories. Observation years range from 1995 to 2020. The unweighted mean is 41.22% and the median is 39.84%, with a first quartile of 26.81% and third quartile of 57.56%. The highest latest observation is Croatia at 98.13% and the lowest is St. Lucia at 3.50%.
The indicator should not be read as the percentage of children who were exclusively breastfed continuously for six months. The World Bank definition covers infants aged 0–5 months who were fed breast milk alone during the previous day. It is a previous-day feeding-status measure for the under-six-month population, not a longitudinal measure of how long each child maintained exclusive breastfeeding.
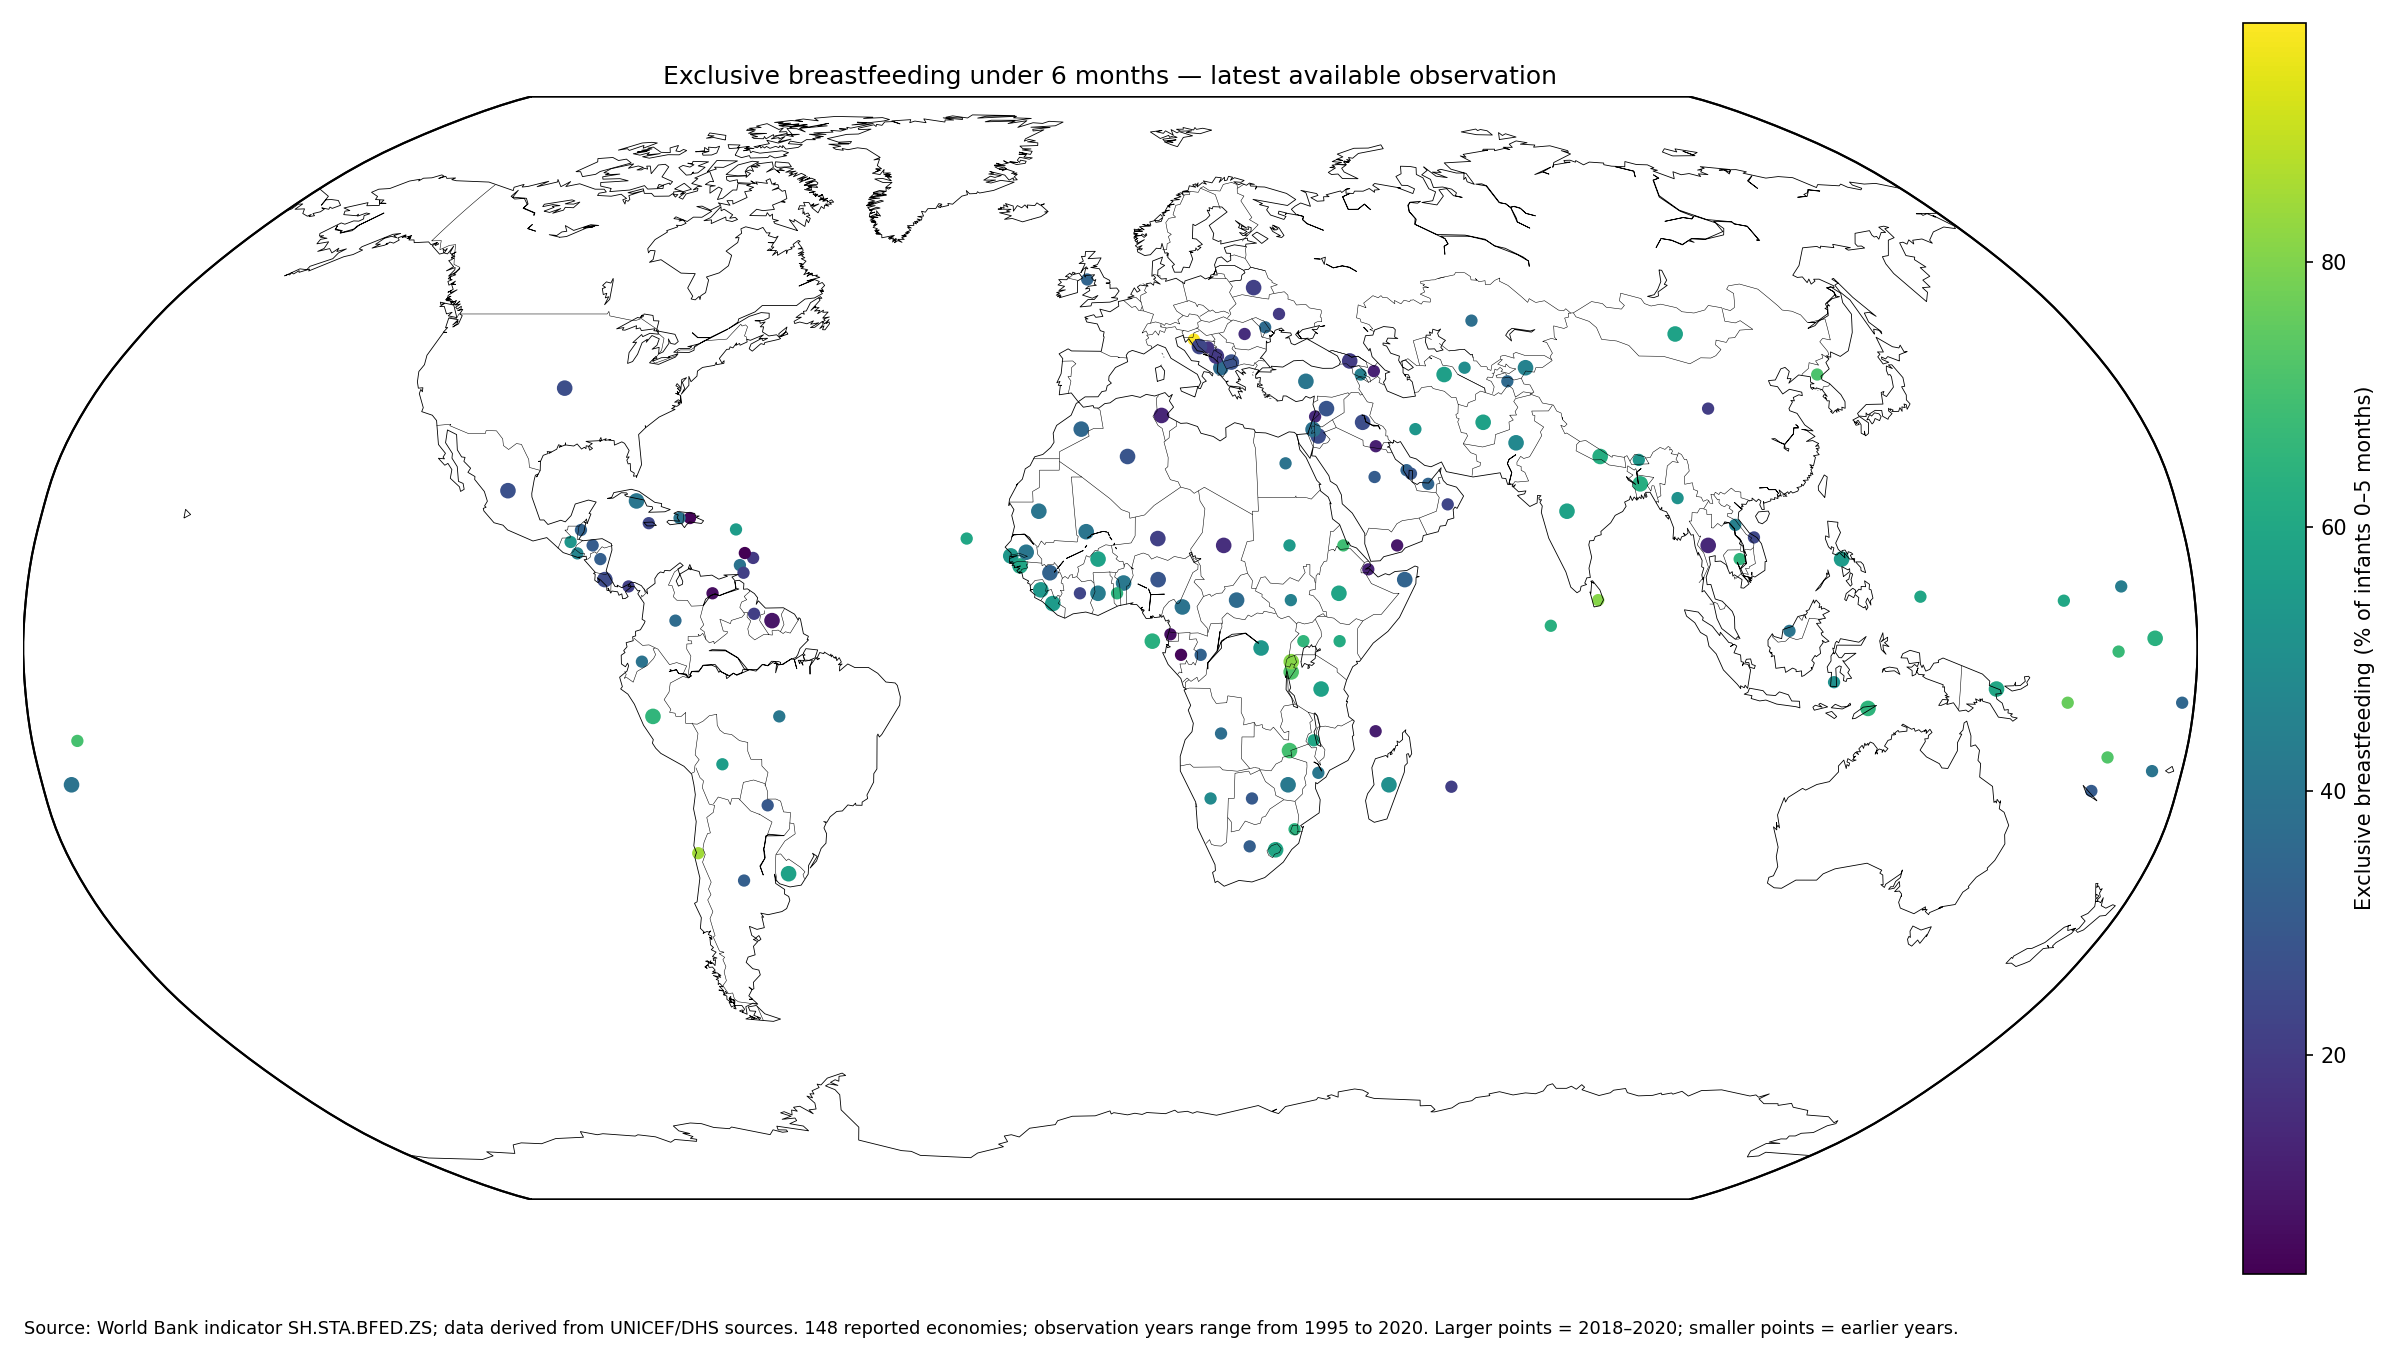
Table of Contents
What the exclusive-breastfeeding indicator actually measures
World Bank metadata defines exclusive breastfeeding as the percentage of children under six months who were fed breast milk alone, with no other liquids, during the past 24 hours. The standard calculation divides the number of infants aged 0–5 months receiving only breast milk on the previous day by all infants aged 0–5 months and multiplies by 100.
The official definition is available in the World Bank metadata glossary, while the World Bank API provides country observations. The source framework cites UNICEF and Demographic and Health Survey data.
The highest latest observations reach around 80% or more
Croatia records 98.13%, Chile 84.50%, Sri Lanka 80.93%, and Rwanda 80.90%. Solomon Islands is at 76.20%, Vanuatu 72.60%, Burundi 71.90%, and Samoa 70.30%. Those figures describe the latest observation available in the dataset for each economy, not one synchronized survey year.
Timing changes the interpretation. Croatia’s observation is from 2008 and Chile’s from 2006, while Rwanda’s is from 2020. A high value is therefore not automatically a recent value. The observation year should stay visible in any ranking.
| Rank | Country or territory | Observation year | Exclusive breastfeeding |
|---|---|---|---|
| 1 | Croatia | 2008 | 98.1% |
| 2 | Chile | 2006 | 84.5% |
| 3 | Sri Lanka | 2016 | 80.9% |
| 4 | Rwanda | 2020 | 80.9% |
| 5 | Solomon Islands | 2015 | 76.2% |
| 6 | Vanuatu | 2013 | 72.6% |
| 7 | Burundi | 2019 | 71.9% |
| 8 | Samoa | 2014 | 70.3% |
| 9 | Zambia | 2018 | 69.9% |
| 10 | Eritrea | 2010 | 68.7% |
| 11 | Naoero | 2007 | 67.2% |
| 12 | Uganda | 2016 | 65.5% |
| 13 | Peru | 2019 | 65.3% |
| 14 | Cambodia | 2014 | 65.2% |
| 15 | Timor-Leste | 2020 | 65.0% |
The low end falls below 20%
St. Lucia records 3.50%, the Dominican Republic 4.56%, Gabon 5.08%, Venezuela 7.10%, Equatorial Guinea 7.40%, Suriname 8.92%, and Yemen 9.70%. Kuwait, Azerbaijan, and Djibouti are also near the lower end.
A low percentage does not, by itself, identify a cause. The file contains no direct measures of maternity leave, employment conditions, healthcare access, social support, cultural practices, or household circumstances. Those factors require separate evidence.
| Low-end rank | Country or territory | Observation year | Exclusive breastfeeding |
|---|---|---|---|
| 1 | St. Lucia | 2012 | 3.5% |
| 2 | Dominican Republic | 2014 | 4.6% |
| 3 | Gabon | 2012 | 5.1% |
| 4 | Venezuela, RB | 1998 | 7.1% |
| 5 | Equatorial Guinea | 2011 | 7.4% |
| 6 | Suriname | 2018 | 8.9% |
| 7 | Yemen, Rep. | 2013 | 9.7% |
| 8 | Comoros | 2012 | 11.4% |
| 9 | Kuwait | 1996 | 11.9% |
| 10 | Azerbaijan | 2013 | 12.1% |
| 11 | Djibouti | 2012 | 12.4% |
| 12 | Tunisia | 2018 | 13.5% |
| 13 | Thailand | 2019 | 14.0% |
| 14 | Lebanon | 2009 | 14.8% |
| 15 | Romania | 2004 | 15.8% |
The median is 39.84%
The median latest observation is 39.84%. The middle half of country values falls between 26.81% and 57.56%. The simple mean of 41.22% sits about 1.38 percentage points above the median.
By broad bands, 20 observations are below 20%, 55 are from 20% to under 40%, 48 are from 40% to under 60%, 21 are from 60% to under 80%, and 4 are at least 80%. The distribution is broad rather than concentrated in one narrow range.
Observation years span 1995–2020
Only 62 of the 148 observations are from 2018–2020, while 91 are from 2015 or later. 24 observations are from 2010 or earlier. The full dataset therefore maximizes geographic coverage at the cost of temporal consistency.
An older observation is still the latest non-empty value available in this extract, but it should not be described as a current feeding pattern. Time-sensitive comparisons should prioritize recent observations or a common-year subset whenever coverage allows.
Only six observations are from 2020
The 2020 subset contains Rwanda, Timor-Leste, Mongolia, Liberia, The Gambia, and West Bank and Gaza. These six observations can be compared within the same year, but they are far too small a sample to stand in for the world.
This illustrates the trade-off between a latest-value map and a same-year map. The latest-value approach covers 148 economies but mixes years; the 2020-only view aligns time but loses most countries. Both are valid for different questions.
A previous-day measure is not a duration measure
Using the previous day gives survey teams a standardized recall window and reduces the burden of reconstructing months of feeding history. It captures what infants aged 0–5 months consumed yesterday, not whether every child has received only breast milk continuously since birth.
For that reason, the indicator should not be relabeled as ‘percentage exclusively breastfed for six full months.’ It is a prevalence measure among the under-six-month age group based on the previous day’s feeding.
Country averages do not describe an individual infant
The country percentage summarizes feeding status across surveyed infants. It does not determine an individual child’s nutritional status, growth, health outcome, or household circumstances. Population statistics and individual clinical or feeding decisions operate at different levels.
National averages can also hide variation by urban or rural residence, region, household income, maternal education, or other characteristics. Detailed equity analysis requires disaggregated survey data rather than a single national percentage.
Survey design and sampling matter
This indicator is largely derived from household survey systems. Countries conduct surveys in different years, which is why the latest-observation dates vary so widely. Sampling error and survey implementation can also affect measured percentages.
Small percentage-point differences should therefore be interpreted cautiously, especially when the observations come from different years. The largest and most durable pattern in this file is the broad cross-country range and the uneven timing of observations.
The map does not identify policy causes
Breastfeeding practices may be associated with maternity protection, workplace conditions, healthcare support, family circumstances, social norms, and other factors. None of those explanatory variables are contained in this five-column country file.
A high or low percentage should not be attributed to a single policy, culture, or population group without additional evidence. The map is useful for identifying patterns and questions, not for establishing causality.
The country mean is not an infant-weighted world rate
The 41.22% simple mean gives every country or territory equal weight. A country with a very large infant population and a small country each count once. It is therefore not the global percentage of all infants under six months who are exclusively breastfed.
A true global rate would require appropriate population and survey weights. The median likewise represents the middle country observation rather than the middle infant in the world.
Source and calculation notes
The source is World Bank World Development Indicators series SH.STA.BFED.ZS. The analysis uses the latest non-empty observation for 148 countries and territories and calculates the mean, median, quartiles, distribution bands, and rankings directly from those values. The official World Bank API provides the series.
The map joins all 148 country codes to geographic centroids, producing a 100% match for reported observations. Larger points mark 2018–2020 values and smaller points earlier years. Missing economies are left as no data rather than converted to zero.
Frequently Asked Questions
Does the indicator mean a child was exclusively breastfed continuously for six months?
No. It measures the share of infants aged 0–5 months who received only breast milk during the previous day.
Are all 148 observations from the same year?
No. Observation years range from 1995 to 2020, so percentages should be read together with their survey year.
Can a national percentage determine an individual infant’s health status?
No. It is a population feeding-practice indicator and does not directly assess an individual child's health, growth, or nutritional status.
Related Articles
Green Map creates custom-edited map images using open geographic data sources such as geoBoundaries, Natural Earth, OpenStreetMap, and government open data. These maps are edited visual materials, not raw data files, and are provided for education, documents, presentations, and graphic reference.