U.S. Bureau of Labor Statistics QCEW data for the first quarter of 2026 show a wide spread in average weekly wages across the 50 states and the District of Columbia. D.C. records the highest value at $2,725 per week, followed by New York at $2,363, Massachusetts at $2,201, and Connecticut at $2,080. Mississippi is lowest at $1,051. The unweighted median across the 51 state-level areas is $1,417, while the simple mean is $1,513.69.
This is not median weekly pay for an individual worker. QCEW is an establishment-based payroll system covering jobs subject to unemployment-insurance laws, and the quarterly average weekly wage is a payroll average. Industry mix, full-time and part-time composition, overtime, bonuses, seasonal activity, and changes in covered employment can all move the figure. It is best read as an average workplace wage measure for each state-level economy.
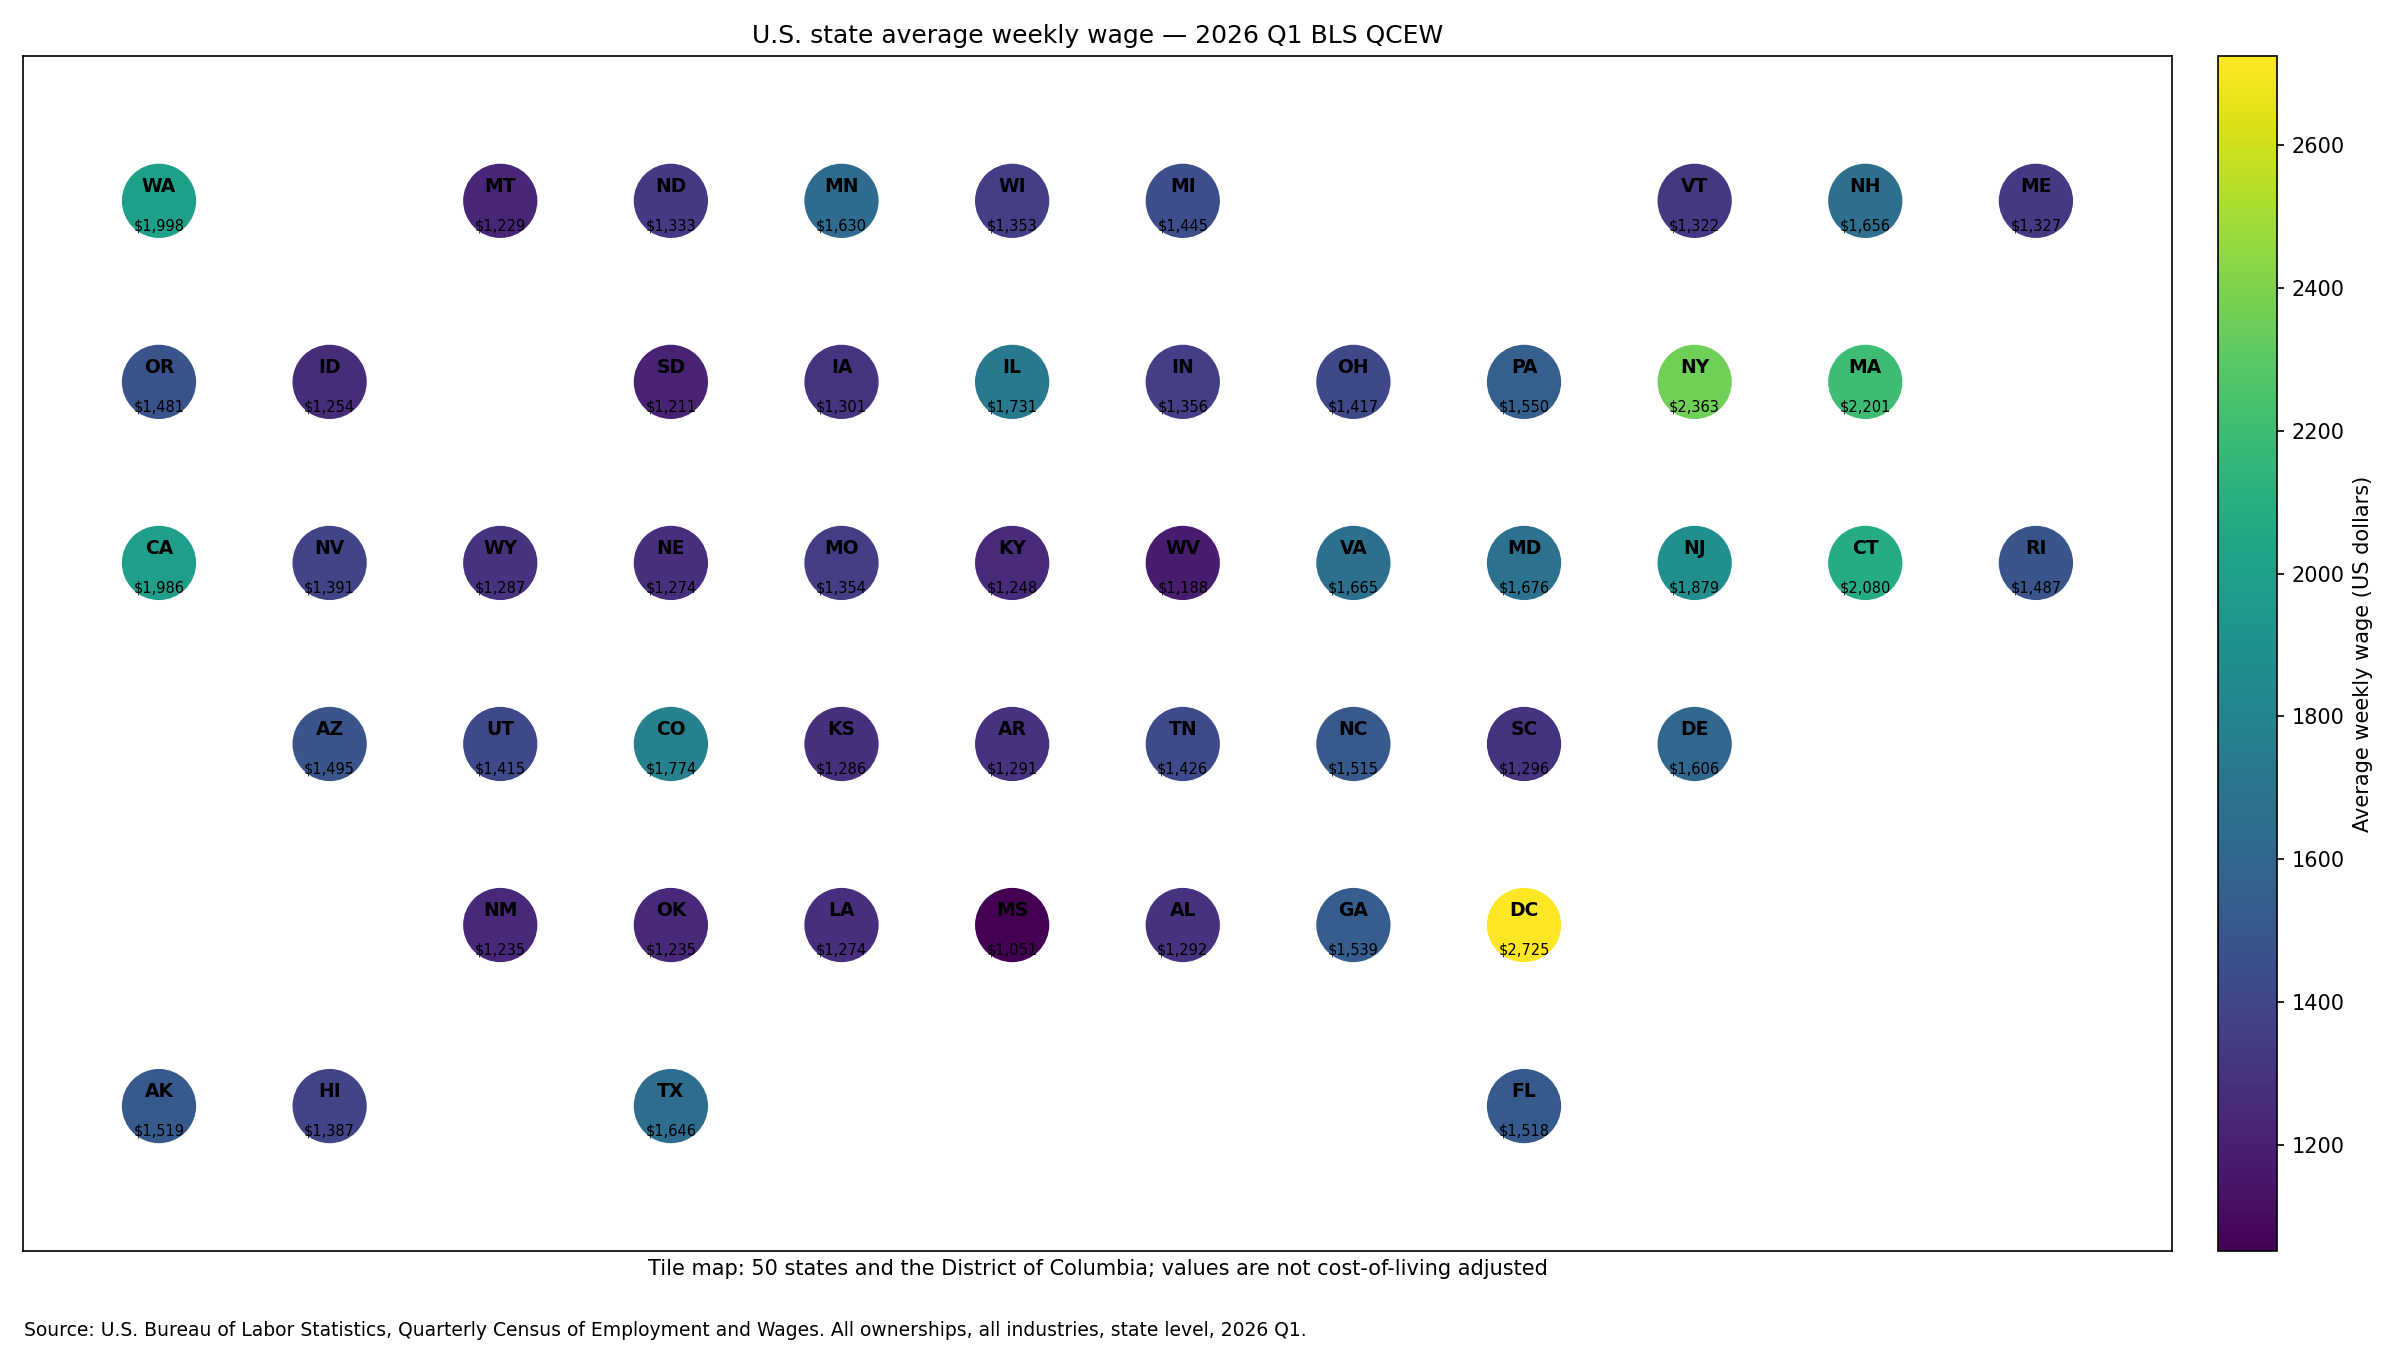
Table of Contents
D.C. and several Northeastern states lead the wage map
D.C., New York, Massachusetts, and Connecticut form the top four. New Jersey is also high at $1,879. On the West Coast, Washington reaches $1,998 and California $1,986, while Colorado stands out in the Mountain West at $1,774. The map therefore shows more than one high-wage cluster rather than a single region containing every top observation.
4 state-level areas are at or above $2,000 per week and 7 reach at least $1,800. The difference between D.C. and Mississippi is $1,674 per week, and the maximum is about 2.59 times the minimum. D.C. is a federal district rather than a state, but QCEW reports it as a state-level area, so it belongs in the 51-area comparison while retaining that geographic distinction.
| Rank | State or area | Average weekly wage | Over-the-year |
|---|---|---|---|
| 1 | District of Columbia | $2,725 | +4.5% |
| 2 | New York | $2,363 | +6.5% |
| 3 | Massachusetts | $2,201 | +4.8% |
| 4 | Connecticut | $2,080 | +5.2% |
| 5 | Washington | $1,998 | +2.7% |
| 6 | California | $1,986 | +2.7% |
| 7 | New Jersey | $1,879 | +3.3% |
| 8 | Colorado | $1,774 | +5.4% |
| 9 | Illinois | $1,731 | +4.1% |
| 10 | Maryland | $1,676 | +2.7% |
Mississippi and several Southern or interior states sit near the bottom
Mississippi is lowest at $1,051, followed by West Virginia at $1,188, South Dakota at $1,211, and Montana at $1,229. New Mexico and Oklahoma both report $1,235. In total, 15 state-level areas are below $1,300 per week.
A lower nominal weekly average does not automatically mean lower worker well-being. QCEW does not adjust for housing, prices, taxes, household size, or commuting, and the average can be influenced by the local mix of industries and job types. A cost-of-living comparison or household living-standard analysis would require different data.
| Low-end rank | State | Average weekly wage | Over-the-year |
|---|---|---|---|
| 1 | Mississippi | $1,051 | +3.3% |
| 2 | West Virginia | $1,188 | +3.4% |
| 3 | South Dakota | $1,211 | +4.2% |
| 4 | Montana | $1,229 | +3.5% |
| 5 | New Mexico | $1,235 | +2.7% |
| 6 | Oklahoma | $1,235 | +3.6% |
| 7 | Kentucky | $1,248 | +2.9% |
| 8 | Idaho | $1,254 | +6.2% |
| 9 | Louisiana | $1,274 | +4.0% |
| 10 | Nebraska | $1,274 | +3.7% |
The median is $1,417, below the $1,513.69 simple mean
The first quartile is $1,291.50, the median $1,417, and the third quartile $1,638.00. Half of the 51 observations therefore lie roughly between $1,292 and $1,638. The simple mean is about $97 above the median because the upper tail—especially D.C., New York, Massachusetts, and Connecticut—pulls the average upward.
This state mean is not the BLS national employment-weighted average. It gives California and Wyoming one observation each despite their very different employment bases. A true national average would aggregate total wages and covered employment, not simply average the 51 state-level percentages or dollar values.
New York posted the fastest over-the-year wage increase
The same QCEW source provides the percent change from 2025 Q1 to 2026 Q1. The unweighted mean change across the 51 areas is 3.79% and the median is 3.7%. New York leads at +6.5%, followed by Idaho at +6.2%, Wyoming at +5.8%, and Colorado at +5.4%.
| Growth rank | State or area | 2026 Q1 wage | Over-the-year change |
|---|---|---|---|
| 1 | New York | $2,363 | +6.5% |
| 2 | Idaho | $1,254 | +6.2% |
| 3 | Wyoming | $1,287 | +5.8% |
| 4 | Colorado | $1,774 | +5.4% |
| 5 | Connecticut | $2,080 | +5.2% |
| 6 | Alaska | $1,519 | +4.8% |
| 7 | Massachusetts | $2,201 | +4.8% |
| 8 | Oregon | $1,481 | +4.6% |
Hawaii has the smallest increase at +1.7%, followed by Nevada at +2.1% and North Dakota at +2.4%. Every state-level area in this slice has a positive over-the-year change, but that does not mean every worker’s paycheck rose by the reported percentage. Workforce composition and payroll timing can change the average.
High wage levels and rapid wage growth are different rankings
D.C. ranks first in the wage level but its over-the-year increase is 4.5%. Idaho, by contrast, has a relatively low level at $1,254 but the second-fastest increase at 6.2%. California is near the top in level at $1,986 but rose 2.7%. A map of wage levels answers a different question from a map of wage growth.
That distinction also matters for labor-market interpretation. Average wages can rise because high-wage industries expand, low-wage jobs decline, bonuses increase, or the composition of employment changes. Employment can grow while average wage growth slows, or average wages can rise during weak employment growth. Employment levels and employment growth should be reviewed separately.
Neighboring and nearby states can differ sharply
The Northeast contains several very high values, but Maine at $1,327 and Vermont at $1,322 are far below New York, Massachusetts, Connecticut, and New Jersey. On the Pacific side, Washington and California are close to $2,000, while Oregon is $1,481 and Nevada $1,391. Broad regional labels therefore hide meaningful state-level differences.
The Southeast also contains a wide range. Georgia at $1,539 and Florida at $1,518 are above Mississippi at $1,051, Alabama at $1,292, and South Carolina at $1,296. The tile map is useful precisely because it shows clusters and exceptions at the same time instead of forcing every state in a region into one category.
Average weekly wage is not the median worker paycheck
An arithmetic mean can be pulled upward by a smaller number of high-paid jobs. A state with a large share of finance, information, technology, or professional-services payroll can post a high average even if many workers earn less than that number. Quarterly bonuses can also affect the measured average.
For the pay of a typical worker, a median wage measure is generally more appropriate. For household living standards, household income and local price or housing-cost measures are needed. QCEW’s advantage is different: it provides a broad, employer-based view of payroll wages across states under a common administrative framework.
QCEW is workplace-based rather than residence-based
Jobs and wages are assigned to establishments. That matters in employment centers such as D.C. and New York, where many workers commute across jurisdictional boundaries. A person can live in Virginia or Maryland and work at an establishment in D.C.; the QCEW wage belongs to the workplace geography rather than the worker’s residence.
This is why a state wage map should not be treated as a household-income map. The first describes the payroll attached to workplaces; the second describes income attached to residents. Comparing the two can be useful, but they answer different geographic questions.
The 2026 Q1 reference period matters
These values are first-quarter 2026 averages, not annual 2026 averages. Quarterly bonuses, seasonal employment, changes in hours, and shifts in industry employment can make one quarter differ from another. A 2025 annual county-wage map is therefore not directly interchangeable with this 2026 Q1 state series because both the geography and the reference period differ.
The over-the-year comparison uses the same quarter one year earlier, which reduces some seasonal mismatch, but it does not hold the employment mix constant. A longer trend analysis should link several quarters using the same QCEW ownership, industry, aggregation level, and wage field.
Source and calculation notes
The source is the U.S. Bureau of Labor Statistics Quarterly Census of Employment and Wages for 2026 Q1. The series uses all ownerships (own_code 0), all industries (industry_code 10), state-level aggregation (level 50), and the published avg_wkly_wage field. All 50 states plus the District of Columbia have disclosed observations. The official BLS QCEW 2026 Q1 file contains the underlying records.
The mean, median, and quartiles give each of the 51 state-level areas equal weight. Over-the-year changes use the source field oty_avg_wkly_wage_pct_chg. The main visual is a tile map rather than a boundary-area choropleth so that Alaska, Hawaii, D.C., and the smallest Northeastern states remain legible while preserving broad U.S. spatial relationships.
Frequently Asked Questions
Which U.S. state-level area had the highest average weekly wage in 2026 Q1?
The District of Columbia was highest at $2,725 per week, followed by New York at $2,363 and Massachusetts at $2,201.
Is the QCEW average weekly wage the median paycheck of a worker?
No. It is an establishment-based payroll average and can be affected by industry mix, full-time and part-time composition, overtime, bonuses, and employment changes.
Does a higher average weekly wage mean a higher standard of living?
Not necessarily. QCEW wages are nominal and are not adjusted for housing costs, local prices, taxes, commuting, or household composition.
Related Articles
Green Map creates custom-edited map images using open geographic data sources such as geoBoundaries, Natural Earth, OpenStreetMap, and government open data. These maps are edited visual materials, not raw data files, and are provided for education, documents, presentations, and graphic reference.