U.S. county employment in March 2026 shows where covered jobs were concentrated at the end of the first quarter. The data come from the Bureau of Labor Statistics Quarterly Census of Employment and Wages (QCEW). Monthly employment represents covered workers who worked during, or received pay for, the pay period that included the 12th day of the month. For the first quarter of 2026, the last-month measure is March employment.
The dataset contains disclosed values for 3,142 U.S. counties and county-equivalent areas. The median is 8,352 jobs and the mean is 47,176. The first quartile is 3,080 and the third quartile is 25,434. The largest observation is Los Angeles County, California with 4,548,021 covered jobs.
This is an absolute employment count, not an employment rate, employment-to-population ratio, or growth rate. Large metropolitan counties naturally rank near the top because they contain many establishments and jobs. A high value therefore describes local labor-market size rather than stronger labor-market performance.
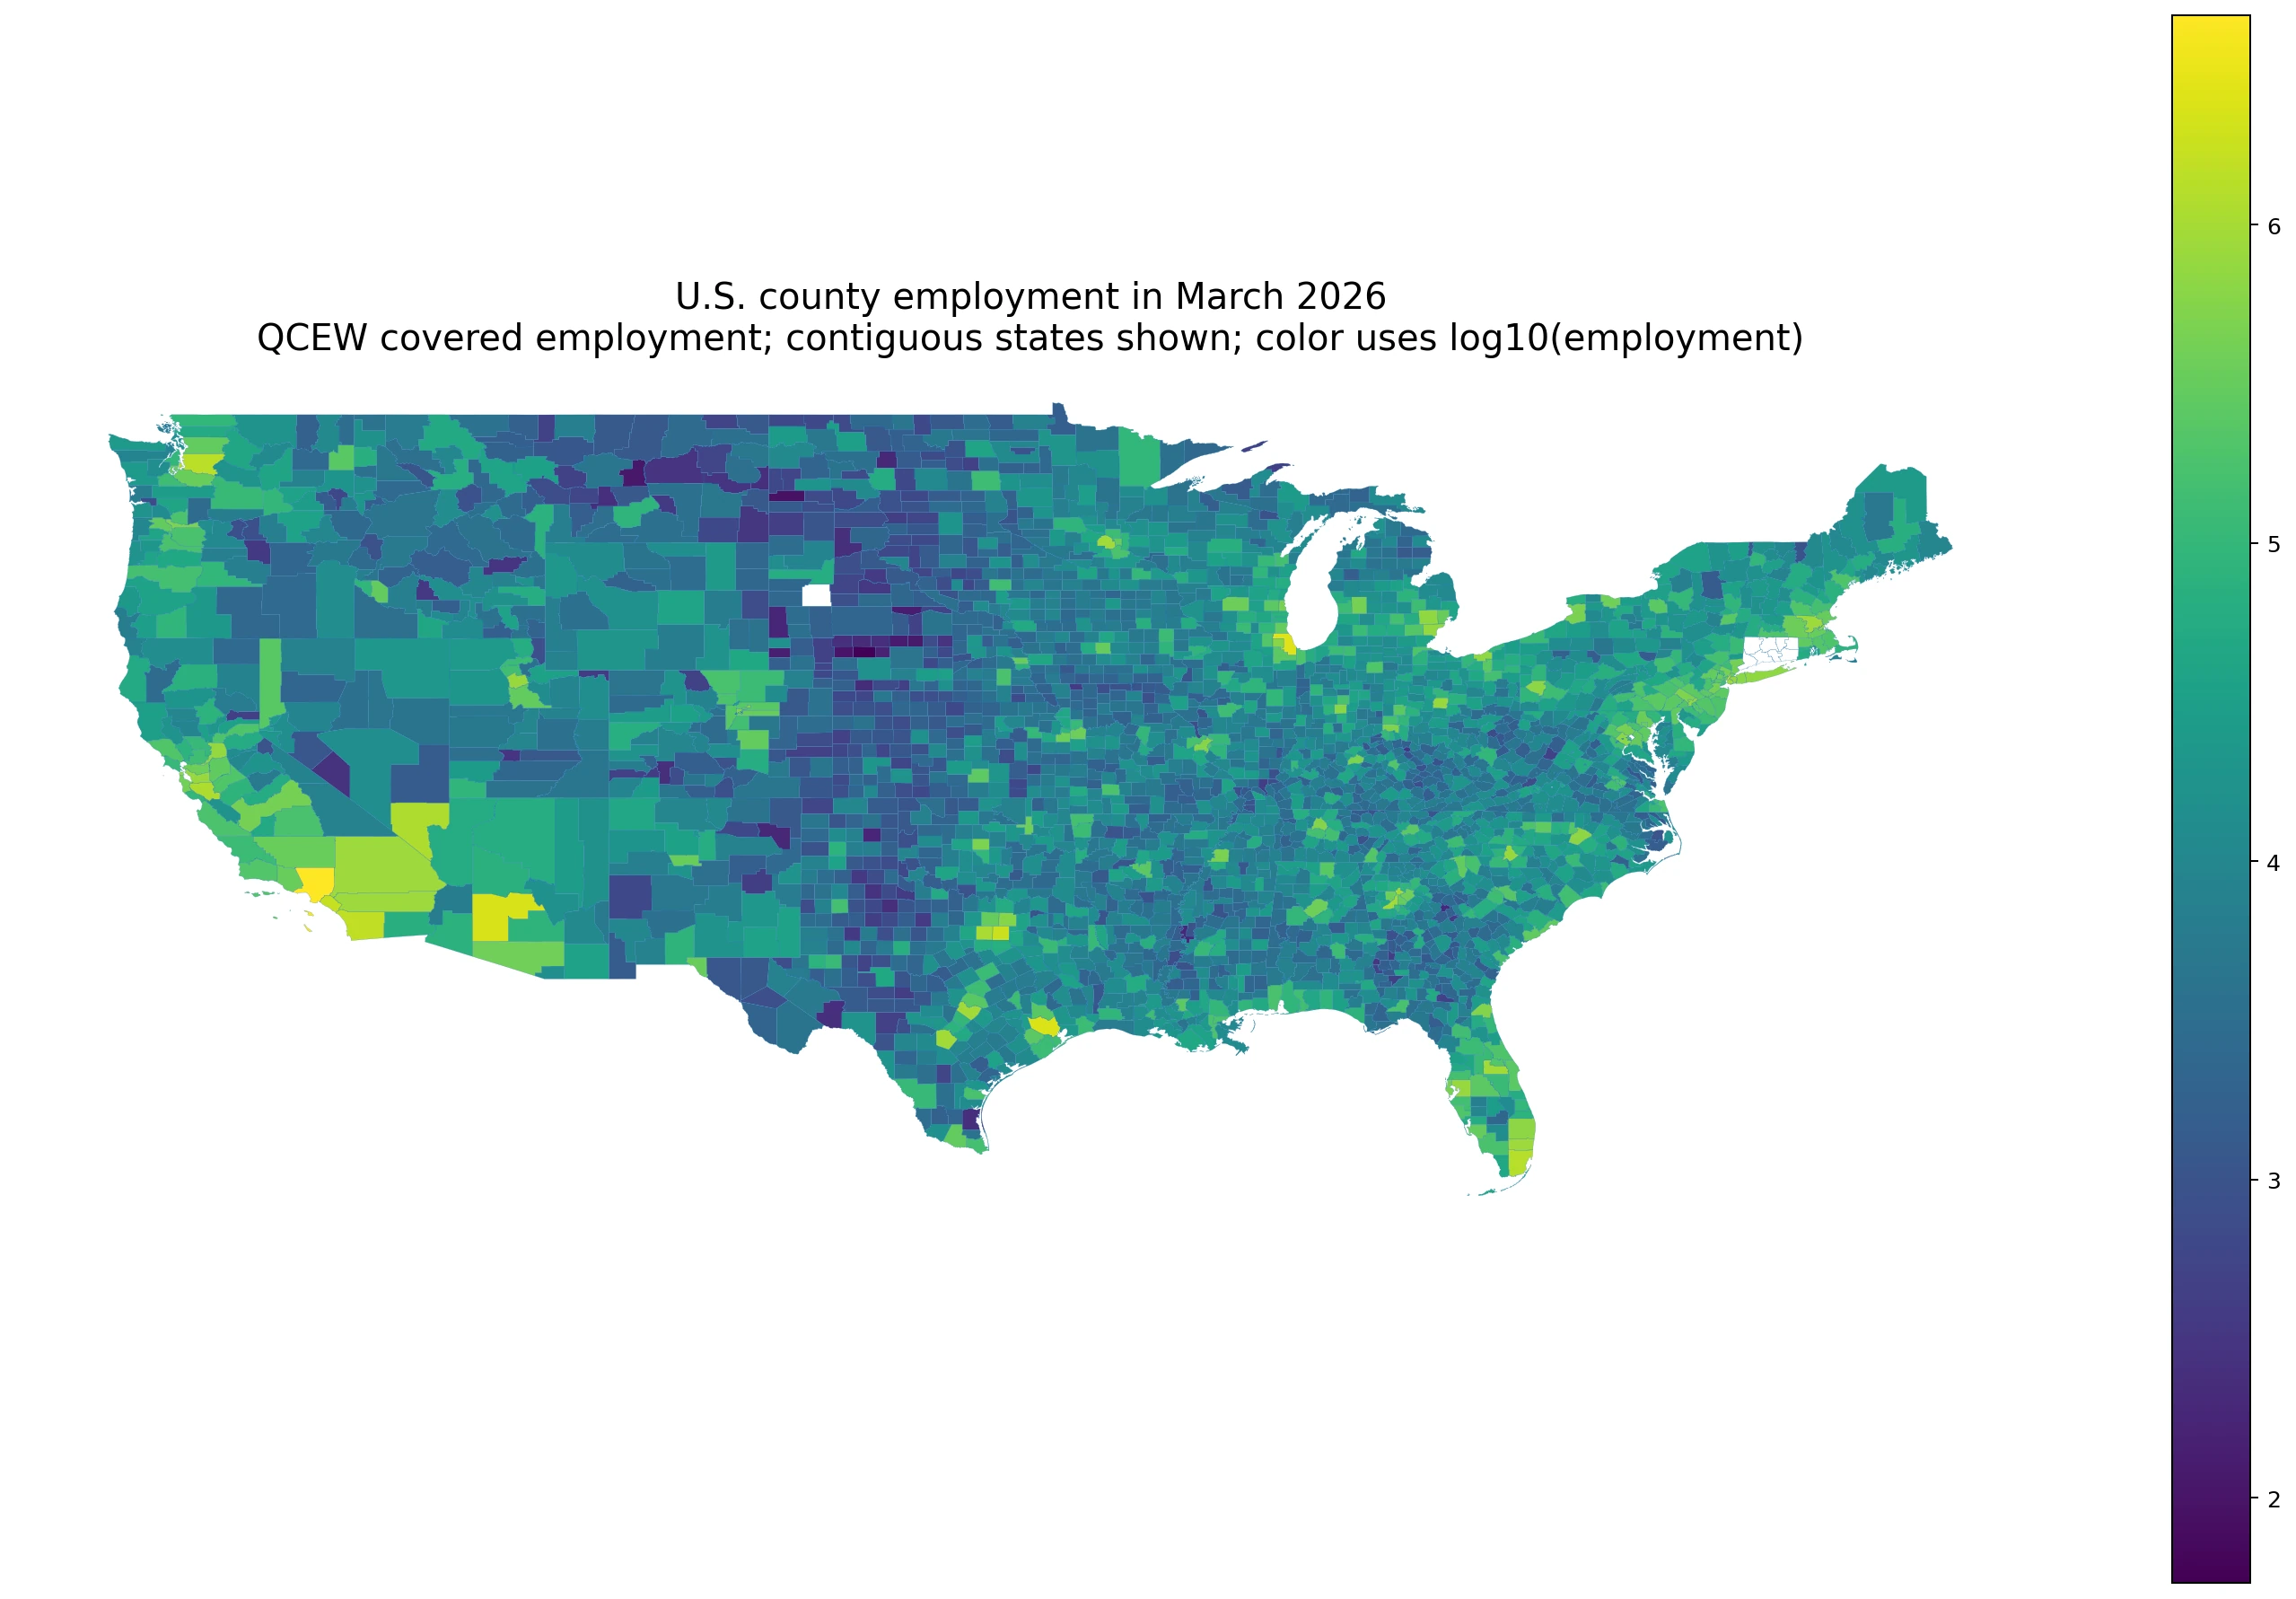
Table of Contents
Large metropolitan counties dominate the absolute employment totals
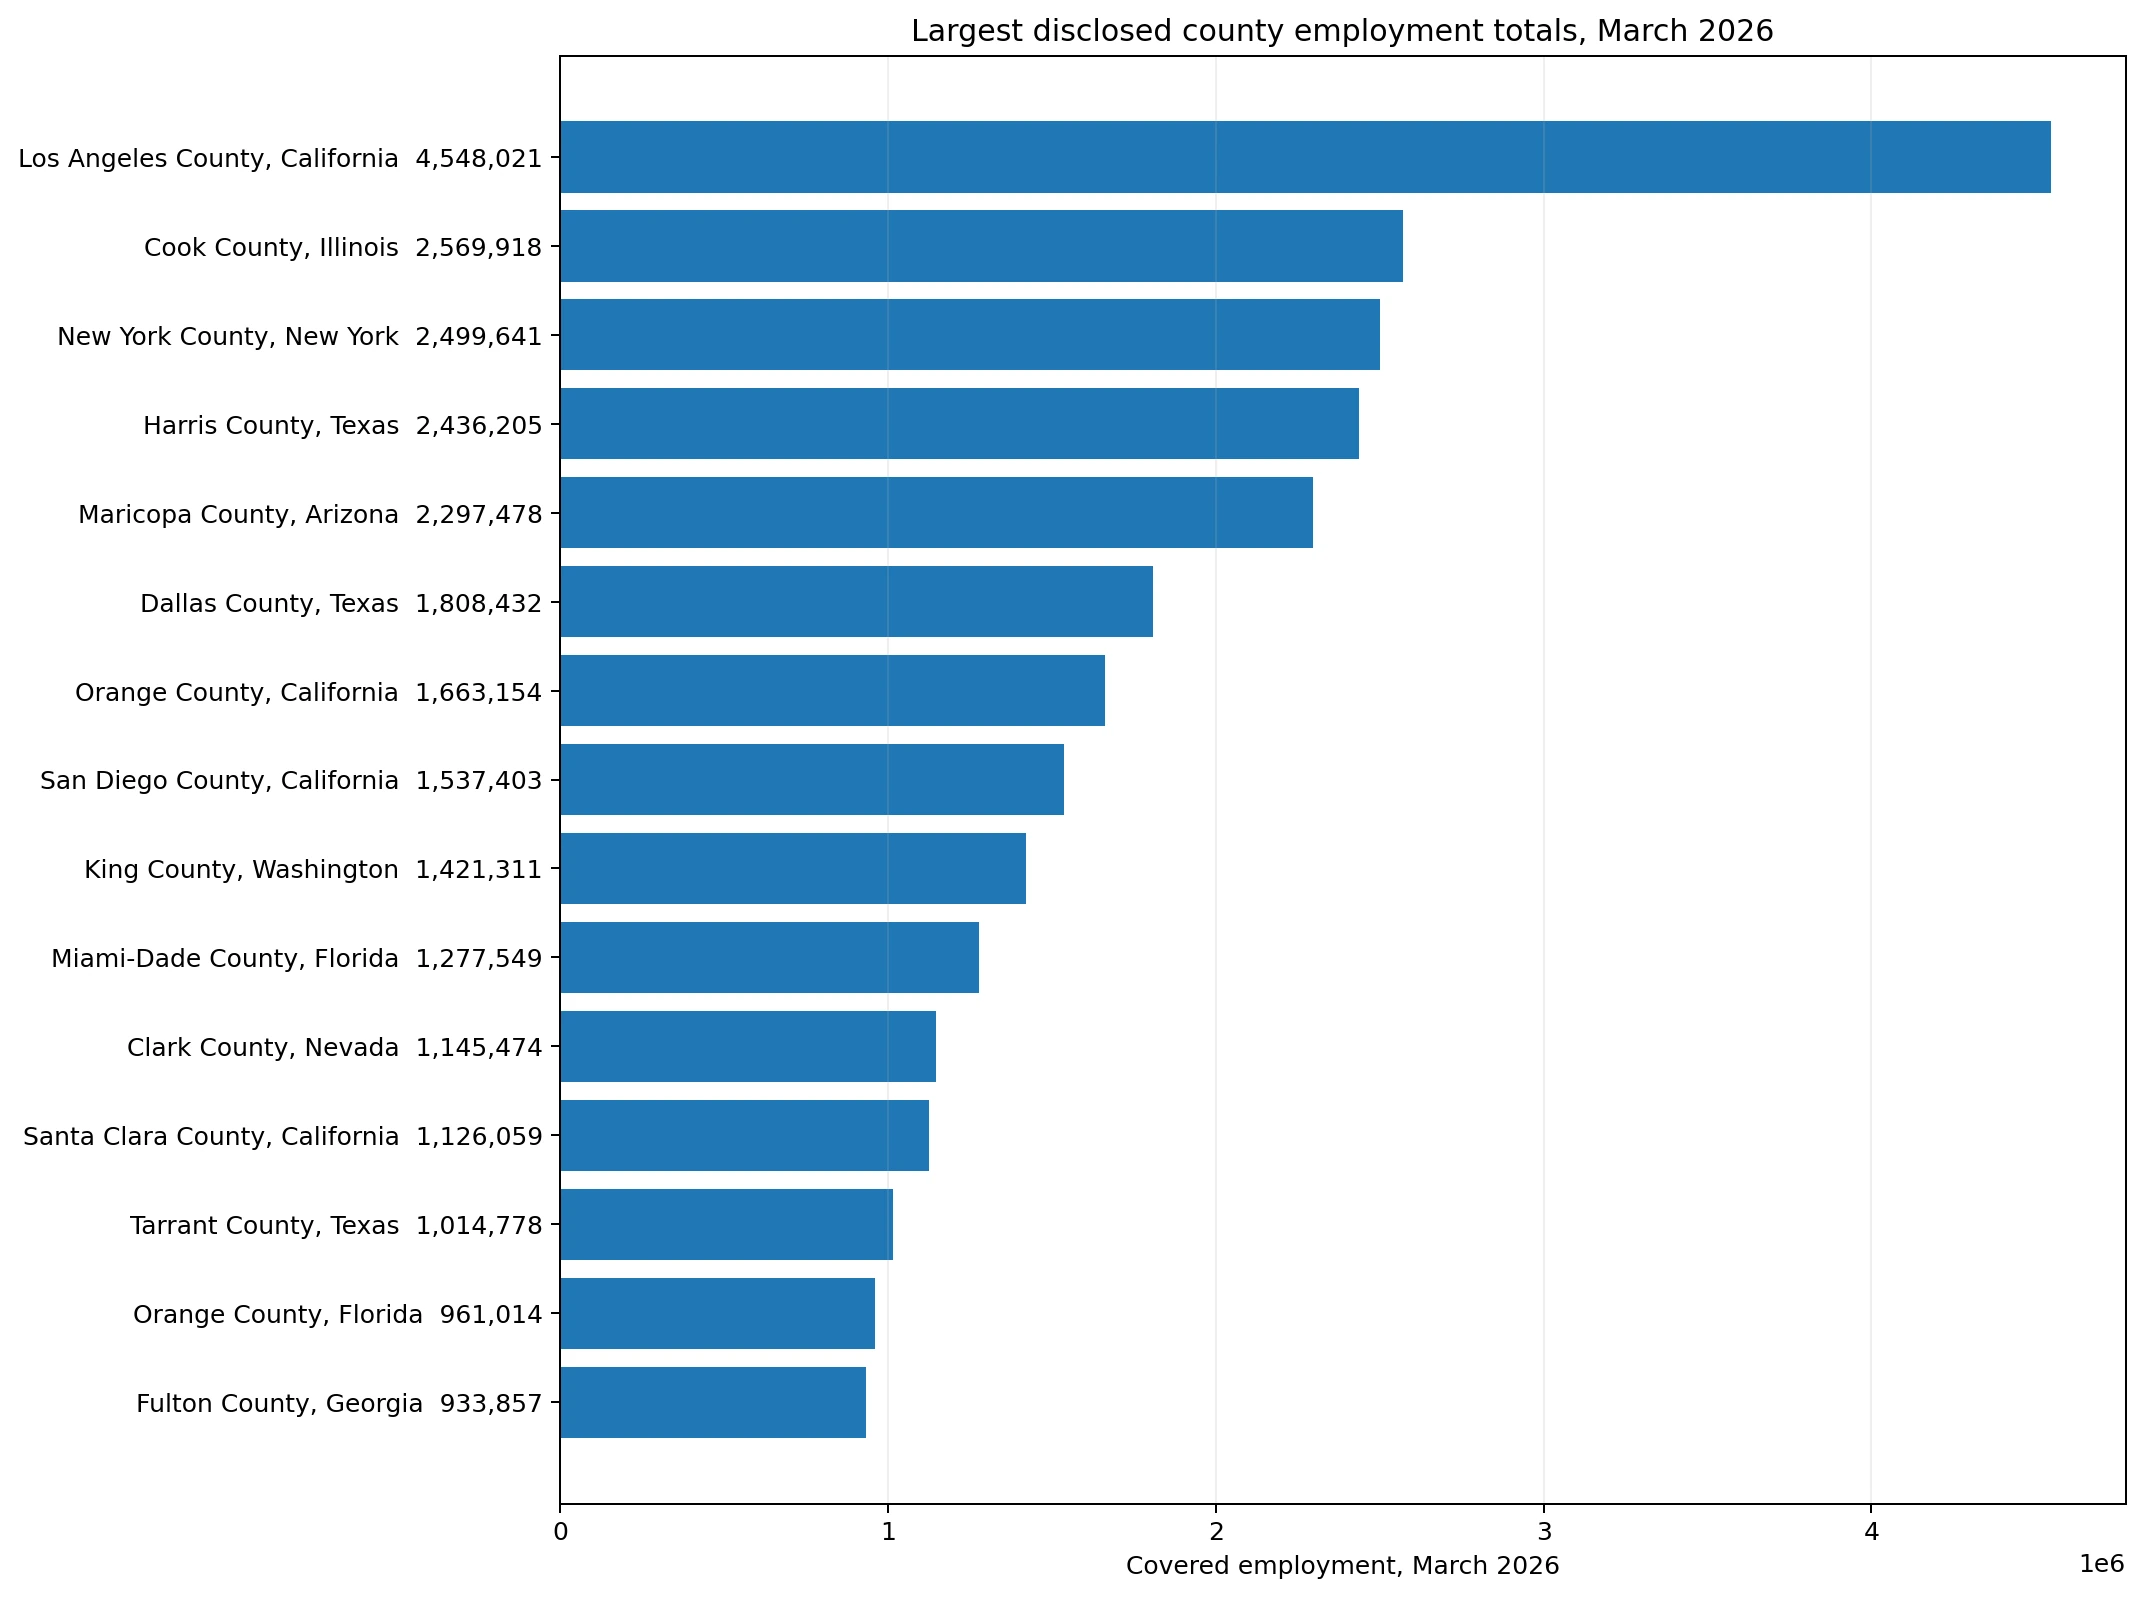
The largest observation is Los Angeles County, California with 4,548,021 jobs. The upper end of the ranking is dominated by counties and county-equivalent areas that contain major metropolitan employment centers. Concentrations of firms, hospitals, schools, logistics facilities, factories, and government workplaces all contribute to large establishment-based job totals.
The ranking is not a labor-market quality score. A county can have a very large job count and weak recent growth, while a smaller county can have fewer jobs but faster growth or a higher employment rate. Performance comparisons require a denominator or a time comparison.
| County or equivalent | March employment |
|---|---|
| Los Angeles County, California | 4,548,021 |
| Cook County, Illinois | 2,569,918 |
| New York County, New York | 2,499,641 |
| Harris County, Texas | 2,436,205 |
| Maricopa County, Arizona | 2,297,478 |
| Dallas County, Texas | 1,808,432 |
| Orange County, California | 1,663,154 |
| San Diego County, California | 1,537,403 |
| King County, Washington | 1,421,311 |
| Miami-Dade County, Florida | 1,277,549 |
The typical county is far smaller than the metropolitan leaders
The median is 8,352 jobs, while the 90th percentile is 92,563 and the 95th percentile is 199,048. Employment totals rise rapidly near the upper end, creating a long-tailed distribution in which a relatively small number of metropolitan counties account for very large job bases.
There are 640 observations below 2,500 jobs, 1,076 from 2,500 to under 10,000, 925 from 10,000 to under 50,000, 344 from 50,000 to under 200,000, and 157 at 200,000 or more. A logarithmic map scale prevents the largest counties from visually compressing most other places into one narrow color range.
| March employment range | Counties / equivalents |
|---|---|
| Below 2,500 | 640 |
| 2,500 to under 10,000 | 1,076 |
| 10,000 to under 50,000 | 925 |
| 50,000 to under 200,000 | 344 |
| 200,000 or more | 157 |
A small employment count does not automatically indicate a weak labor market
The smallest disclosed observations are generally very small rural counties or county-equivalent areas. A count in the hundreds or low thousands can simply reflect a small population and establishment base. It does not tell us that unemployment is high or that jobs are declining.
QCEW employment is also establishment-based rather than resident-based. A county with many commuters entering for work can record a large job count relative to its resident population, while a residential county can have many employed residents whose jobs are recorded elsewhere.
| Small disclosed observations | March employment |
|---|---|
| McPherson County, Nebraska | 54 |
| Slope County, North Dakota | 91 |
| Arthur County, Nebraska | 100 |
| Petroleum County, Montana | 113 |
| Loup County, Nebraska | 116 |
| Blaine County, Nebraska | 127 |
| Keya Paha County, Nebraska | 131 |
| Banner County, Nebraska | 142 |
| Logan County, Nebraska | 162 |
| Roberts County, Texas | 177 |
State sums provide a broader view of employment concentration
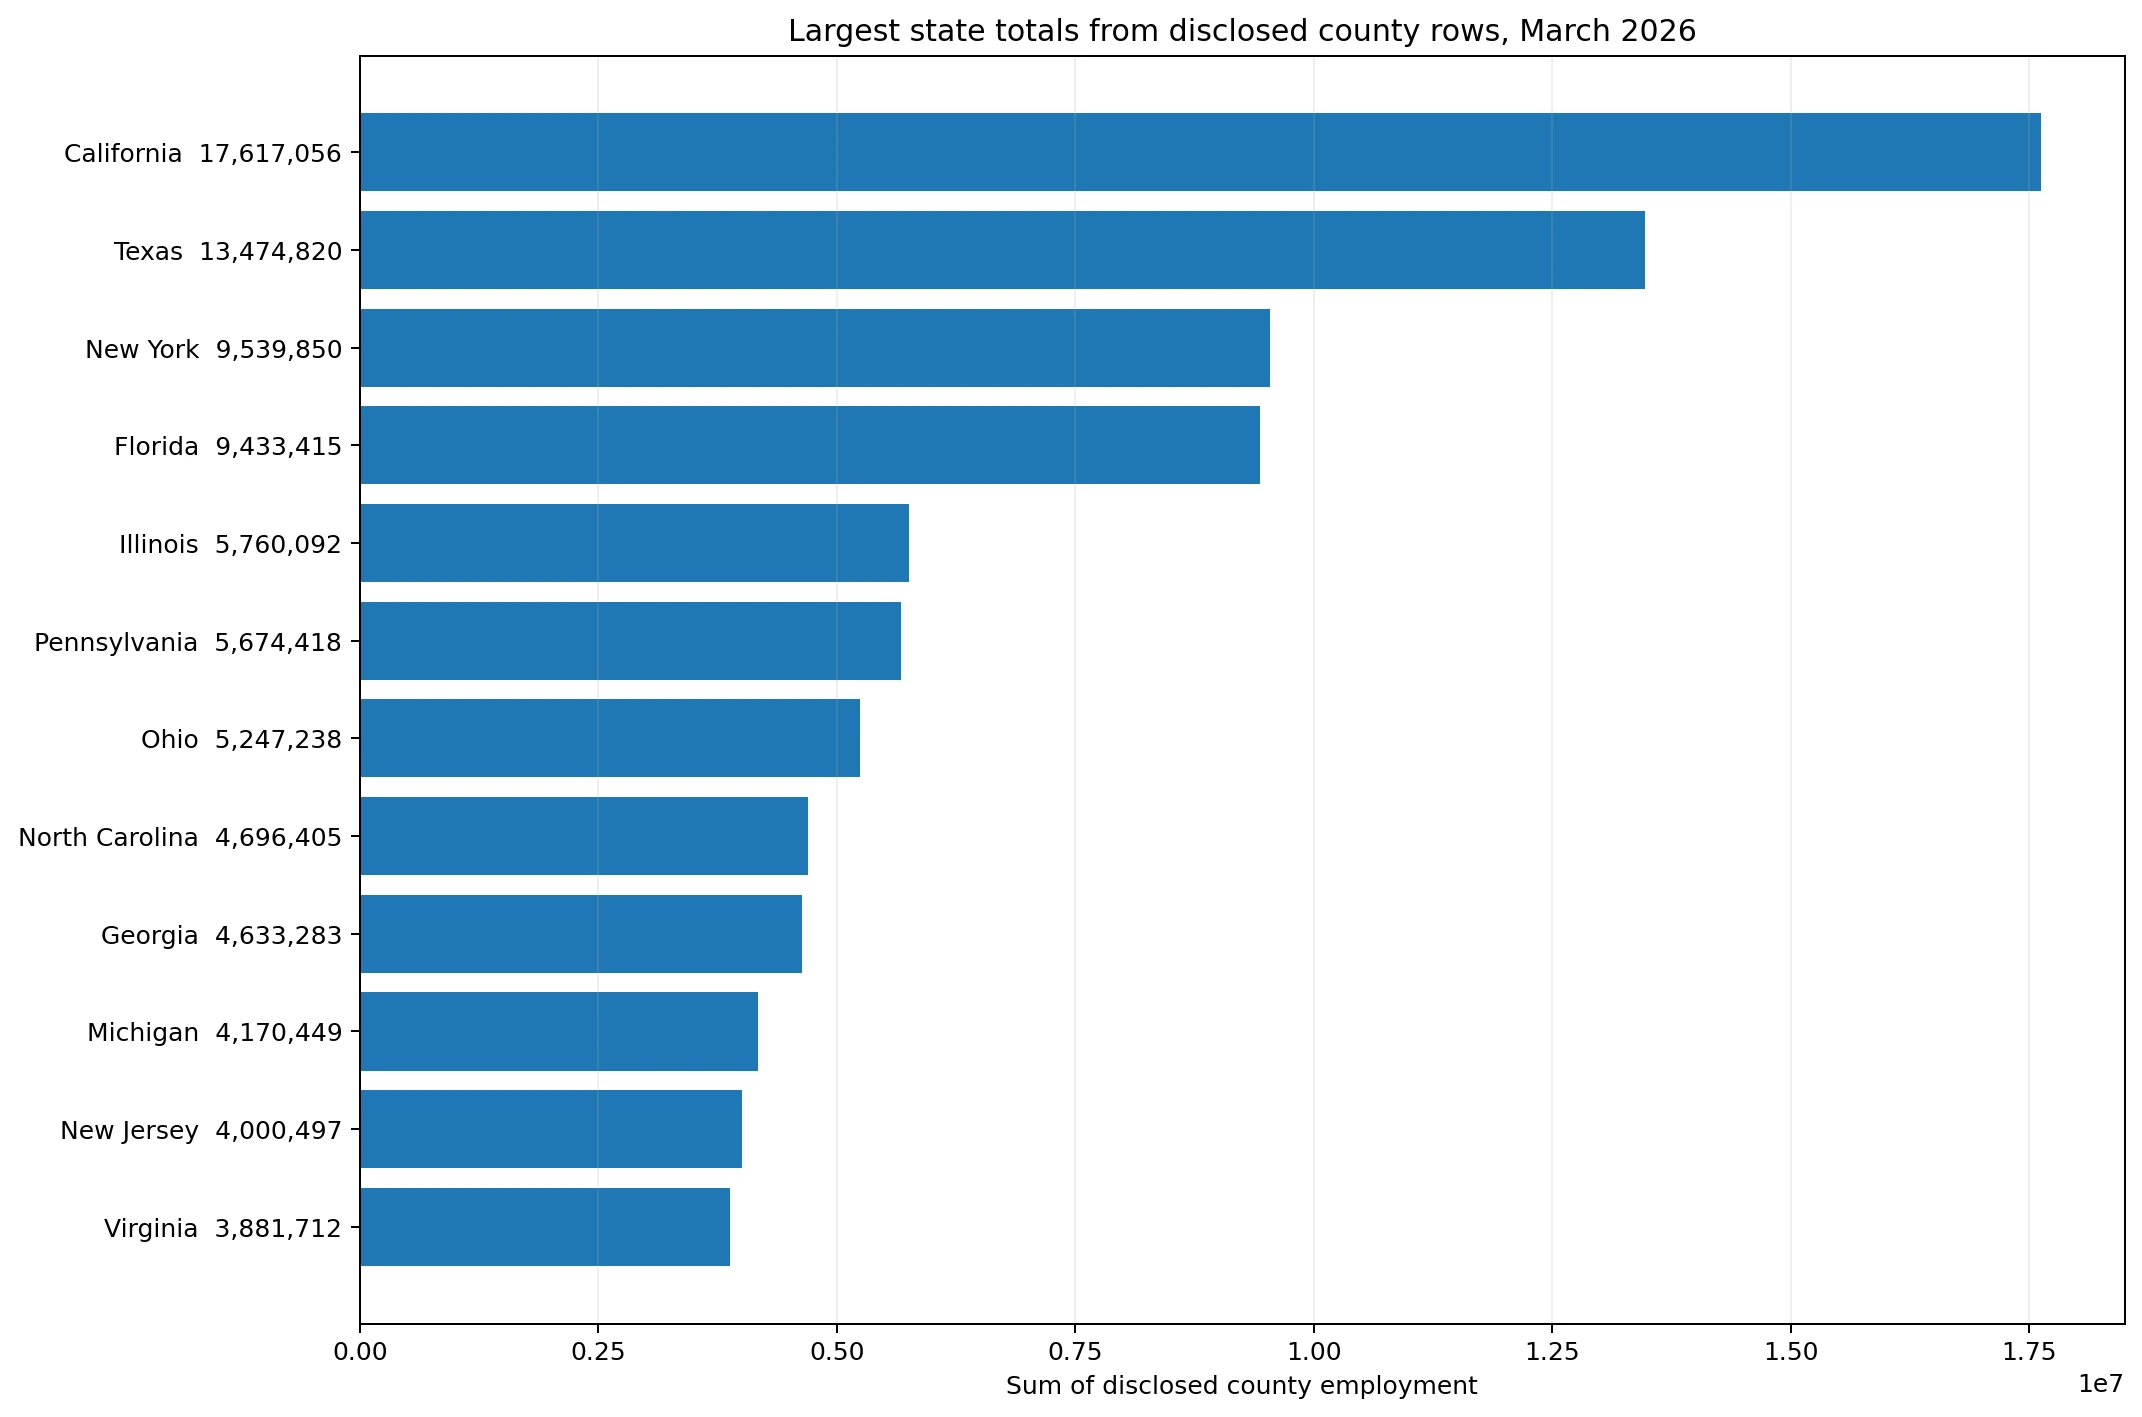
Summing disclosed county observations by state provides context for the county map and shows where large job bases are concentrated at a broader scale. Because the calculation uses the supplied disclosed county rows, it should not be assumed to equal the separately published official state series in every detail.
| State | Sum of disclosed county employment |
|---|---|
| California | 17,617,056 |
| Texas | 13,474,820 |
| New York | 9,539,850 |
| Florida | 9,433,415 |
| Illinois | 5,760,092 |
| Pennsylvania | 5,674,418 |
| Ohio | 5,247,238 |
| North Carolina | 4,696,405 |
| Georgia | 4,633,283 |
| Michigan | 4,170,449 |
| New Jersey | 4,000,497 |
| Virginia | 3,881,712 |
QCEW employment is reported by establishment location
QCEW is based largely on unemployment-insurance administrative records and reports jobs where establishments are located. Monthly employment includes covered workers who worked during, or received pay for, the pay period containing the 12th day of the month. That makes the measure different from household statistics that classify employed people by residence.
The distinction is especially important in metropolitan areas. A central county can employ many commuters who live in neighboring counties, producing a large establishment-based job count. A residential suburban county can have many employed residents while recording fewer jobs within its own borders.
March is the last month of the first quarter, not a quarterly average
The measure refers to March 2026, the last month of the first quarter. It is not the average of January, February, and March. QCEW quarterly and annual employment measures use different period definitions, so comparisons should keep the reference period consistent.
Seasonality can matter in tourism, agriculture, construction, education, and other industries. March should therefore be treated as one monthly snapshot rather than a county’s permanent or annual employment level.
The 3,142 disclosed rows are not a county performance scorecard
The supplied dataset contains 3,142 county and county-equivalent areas with disclosed employment values. QCEW can suppress detailed data where publication could reveal information about individual employers, so an undisclosed value is not equivalent to zero. This file has no missing rows within its disclosed-data scope.
The boundary join matches 3,129 of the 3,142 FIPS codes. The remaining 13 are largely areas affected by more recent county-equivalent changes, including Alaska census-area and Connecticut planning-region changes. Their values remain in every statistical calculation even though the older local boundary file cannot draw them directly.
Other labor indicators are needed to evaluate conditions
Absolute employment is useful for measuring local market size. Evaluating conditions requires unemployment, labor-force participation, population, and employment change over time. Wages and average weekly pay are more relevant for compensation, while NAICS industry detail is needed to compare economic structure.
Metropolitan analysis can also benefit from combining neighboring counties into commuting regions. County boundaries are administrative units and do not always match the true footprint of a local labor market.
Key takeaways
The March 2026 QCEW file contains 3,142 disclosed county employment observations, with a median of 8,352 jobs. The largest observation is Los Angeles County, California at 4,548,021 jobs, and the distribution is strongly concentrated in a relatively small number of large metropolitan counties.
The main interpretation rule is that this is an absolute establishment-based job count. It does not measure the employment rate, recent job growth, or resident employment. The March reference month, establishment-location basis, disclosure scope, and boundary-vintage differences should remain visible when comparing counties.
Frequently Asked Questions
Is the March 2026 county employment value an employment rate?
No. It is an absolute count of covered workers reported in QCEW for the March reference pay period.
Is last-month-of-quarter employment the first-quarter average?
No. It refers to March, the last month of the first quarter, rather than the average of January through March.
Is QCEW employment based on where workers live?
QCEW is primarily establishment-based, so jobs are reported where the establishment is located rather than by the worker's residence.
Does a larger county employment total mean a stronger labor market?
Not necessarily. The count measures market size. Performance comparisons require rates or changes over time, such as unemployment or employment growth.
Related Articles
Green Map creates custom-edited map images using open geographic data sources such as geoBoundaries, Natural Earth, OpenStreetMap, and government open data.
These maps are edited visual materials, not raw data files, and are provided for education, documents, presentations, and graphic reference.