Spain’s 2024 crude birth rate does not form one uniform national pattern. In the INE table covering all 50 provinces plus the autonomous cities of Ceuta and Melilla, the 52 local values range from 4.15 to 9.19 births per 1,000 inhabitants. Melilla is the highest observation, while Ourense is the lowest. The gap is 5.04 births per 1,000, and the maximum is a little more than 2.2 times the minimum. Because every observation uses the same reference year, the ranking is a direct geographic comparison rather than a mixture of different dates.
The indicator needs a precise reading. A crude birth rate measures births relative to the whole population, expressed here per 1,000 inhabitants. It is not the total fertility rate, which summarizes age-specific fertility into an expected number of children per woman. It is also not a count of births. A province with a lower rate can still record more babies than a small territory with a higher rate if its population is much larger. This distinction matters when moving from a demographic comparison to questions about maternity services, childcare, schools or the number of families.
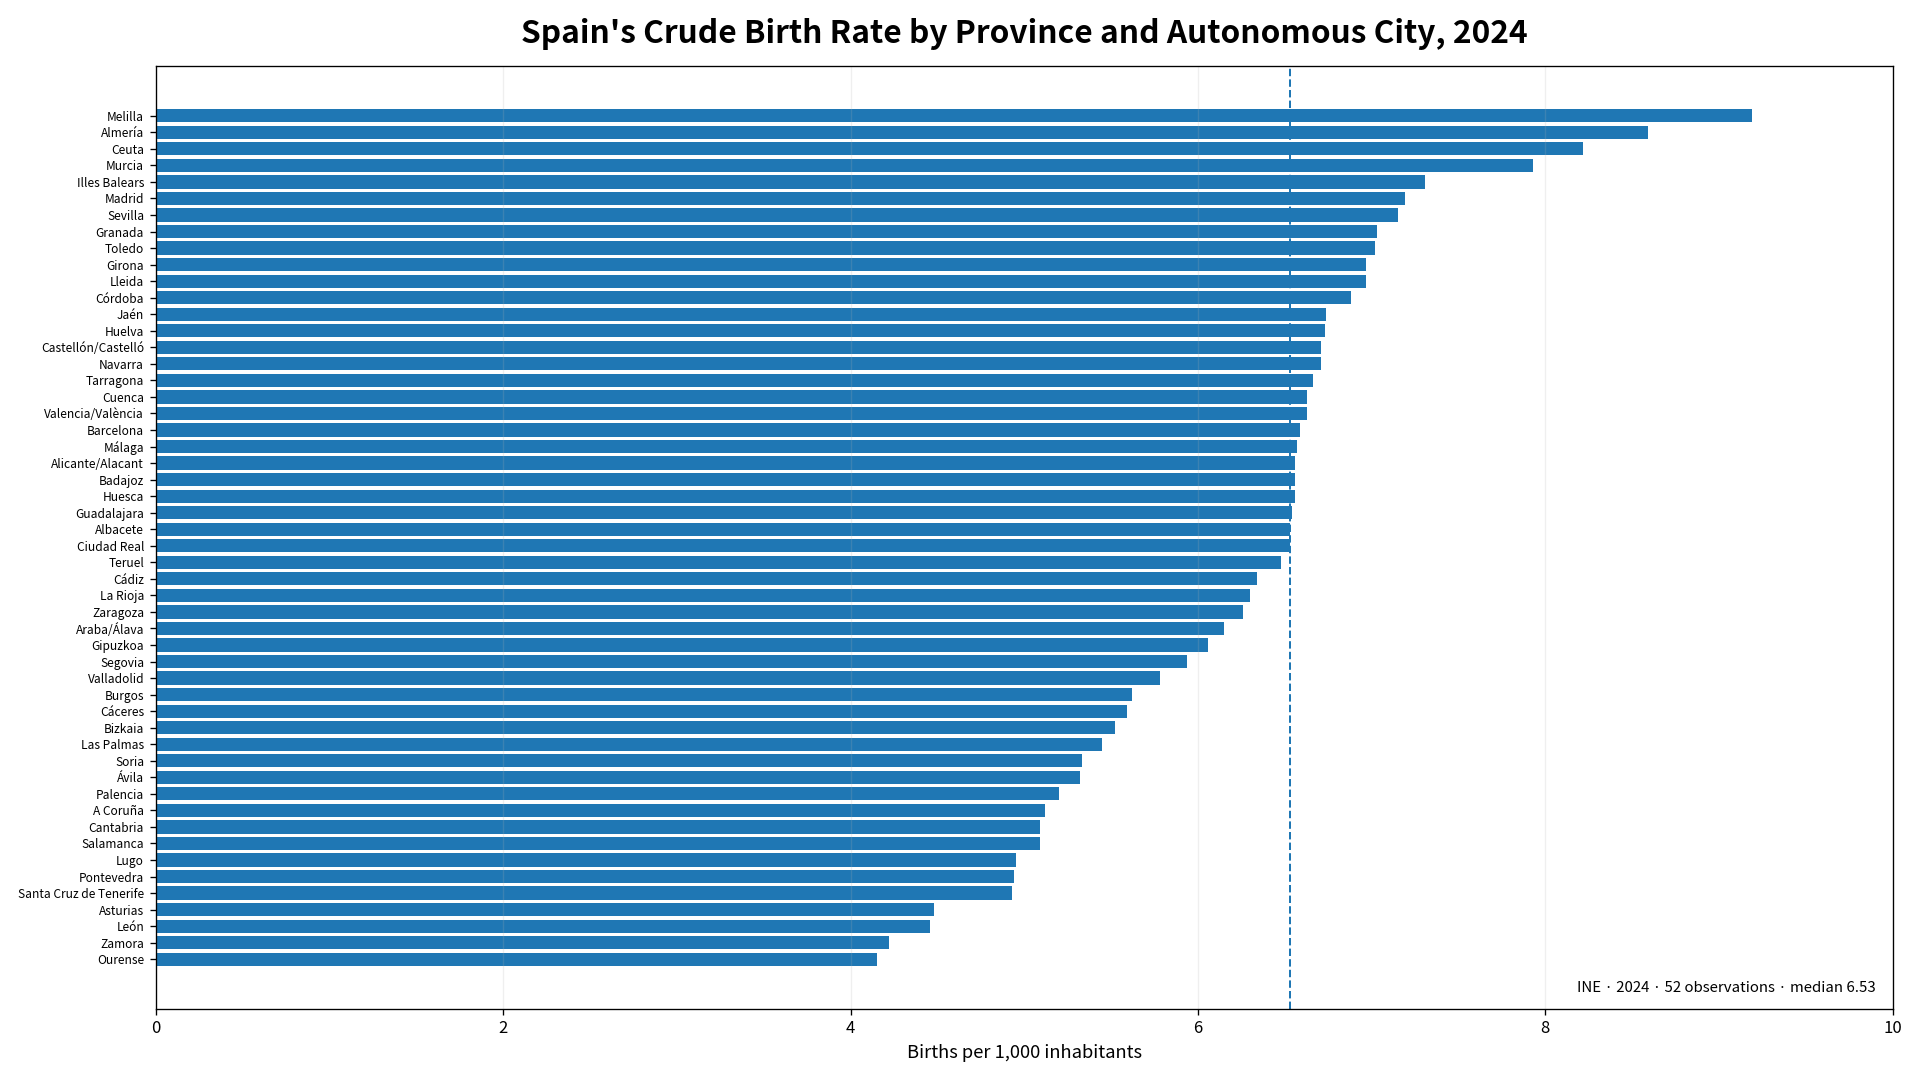
Table of Contents
Most observations sit in a relatively narrow middle band
Across the 52 regional observations, the unweighted mean is 6.24 births per 1,000 inhabitants and the median is 6.53. The first quartile is 5.42 and the third quartile is 6.73, which means the middle half of the provinces and autonomous cities fall between roughly 5.42 and 6.73. That center is much narrower than the full 4.15-to-9.19 range. The simple average treats Soria and Madrid as one observation each, regardless of population size, so it must not be presented as Spain’s national crude birth rate.
A band count makes the distribution easier to see. 7 observations are below 5, 12 are from 5 to under 6, and 24 are from 6 to under 7. Another 6 are from 7 to under 8, while only 3 reach 8 or more. Nearly half of the table is therefore concentrated in the 6s. Small differences around 6.5 may move a province several places in the ranking without representing a large demographic separation, so the numerical distance is usually more informative than rank alone.
Melilla, Almería and Ceuta form the top of the 2024 table
Melilla records 9.19 births per 1,000 inhabitants, followed by Almería at 8.59 and Ceuta at 8.22. Murcia is next at 7.93. Illes Balears reaches 7.31, Madrid 7.19, Sevilla 7.15, Granada 7.03 and Toledo 7.02. These are the nine observations at or above 7. The top group includes both autonomous cities, Mediterranean provinces, a major metropolitan province and inland territory. The mix is a reminder that one broad label cannot fully explain the upper end of the table.
The high rate in Melilla should not be rewritten as ‘Melilla had the most births.’ Rates standardize by population; counts do not. Madrid, Barcelona and other large provinces can have many more births in absolute terms while posting a lower number per 1,000 residents. The same issue appears whenever percentages or rates are compared across places with very different population sizes. If the research question concerns service volume or the number of newborns, the birth count is the necessary companion statistic.
Several northwestern observations are near the bottom, but the pattern has exceptions
Ourense has the lowest 2024 crude birth rate at 4.15. Zamora follows at 4.22, León at 4.46 and Asturias at 4.48. Santa Cruz de Tenerife is 4.93, Pontevedra 4.94 and Lugo 4.95. Cantabria and Salamanca are both 5.09, while A Coruña is 5.12. A cluster of low values is visible across Galicia and neighboring northwestern or western areas, but Santa Cruz de Tenerife shows that the bottom of the ranking is not confined to one continuous mainland zone.
The lower observations should also be interpreted as levels, not as grades. A rate of 4.15 means approximately 4.15 births for every 1,000 inhabitants in the reference period. It does not indicate that a province is performing well or poorly, nor does it identify the reasons behind the outcome. Differences may be connected to age structure, the share of residents in childbearing ages, migration and other demographic or social conditions, but the crude rate alone cannot separate those channels.
The geographic contrast is useful for finding questions, not proving causes
The ranking suggests a broad contrast between several higher observations in the southeast and south and several lower observations in the northwest. Almería and Murcia stand out in the southeast, while Sevilla and Granada are also above 7. In the northwest, Ourense, Lugo, Pontevedra and A Coruña are lower, with nearby León and Zamora also close to the bottom. That spatial pattern is descriptive evidence from 2024. It should be treated as a starting point for further demographic work rather than as proof that location itself causes a higher or lower birth rate.
A causal explanation would require more variables and preferably more years. Useful companions include age-specific fertility rates, total fertility rate, the number of women in reproductive ages, births by mother’s age, net migration, population by age and repeated annual observations. Two provinces can have the same crude birth rate for different reasons. One may have a large share of young adults but lower age-specific fertility, while another may have fewer young adults but higher fertility within those ages. The crude rate compresses those components into one population-wide ratio.
Crude birth rate and total fertility rate answer different questions
The distinction between these two indicators is central. The crude birth rate asks how many births occurred per 1,000 people in the entire population. The total fertility rate uses age-specific birth rates to estimate how many children a woman would have over her reproductive lifetime if those rates remained constant. A crude birth rate of 6.5 is not 6.5 children per woman, and a total fertility rate of 1.3 is not 1.3 births per 1,000 residents. The units, denominators and demographic meanings are different.
Because the crude rate uses everyone in the denominator, local age structure can affect it even when reproductive behavior is similar. An older population may contain a smaller share of people in the ages when most births occur. A place receiving many young adults may have a different denominator composition. That is why the 2024 table is best for comparing the observed intensity of births relative to total population, while fertility behavior itself is better studied with age-specific rates and the total fertility rate.
All 52 regional observations, ranked
The complete table below retains all 50 provinces and the two autonomous cities. Ceuta and Melilla are not provinces, but they appear alongside the provincial observations in the INE comparison. Values are shown to two decimal places and ordered from highest to lowest. Ties and near-ties should not be overread: several provinces differ by only a few hundredths of a birth per 1,000 inhabitants.
| Rank | Province or autonomous city | Births per 1,000 inhabitants |
|---|---|---|
| 1 | Melilla | 9.19 |
| 2 | Almería | 8.59 |
| 3 | Ceuta | 8.22 |
| 4 | Murcia | 7.93 |
| 5 | Illes Balears | 7.31 |
| 6 | Madrid | 7.19 |
| 7 | Sevilla | 7.15 |
| 8 | Granada | 7.03 |
| 9 | Toledo | 7.02 |
| 10 | Girona | 6.97 |
| 11 | Lleida | 6.97 |
| 12 | Córdoba | 6.88 |
| 13 | Jaén | 6.74 |
| 14 | Huelva | 6.73 |
| 15 | Castellón/Castelló | 6.71 |
| 16 | Navarra | 6.71 |
| 17 | Tarragona | 6.66 |
| 18 | Cuenca | 6.63 |
| 19 | Valencia/València | 6.63 |
| 20 | Barcelona | 6.59 |
| 21 | Málaga | 6.57 |
| 22 | Alicante/Alacant | 6.56 |
| 23 | Badajoz | 6.56 |
| 24 | Huesca | 6.56 |
| 25 | Guadalajara | 6.54 |
| 26 | Albacete | 6.53 |
| 27 | Ciudad Real | 6.53 |
| 28 | Teruel | 6.48 |
| 29 | Cádiz | 6.34 |
| 30 | La Rioja | 6.30 |
| 31 | Zaragoza | 6.26 |
| 32 | Araba/Álava | 6.15 |
| 33 | Gipuzkoa | 6.06 |
| 34 | Segovia | 5.94 |
| 35 | Valladolid | 5.78 |
| 36 | Burgos | 5.62 |
| 37 | Cáceres | 5.59 |
| 38 | Bizkaia | 5.52 |
| 39 | Las Palmas | 5.45 |
| 40 | Soria | 5.33 |
| 41 | Ávila | 5.32 |
| 42 | Palencia | 5.20 |
| 43 | A Coruña | 5.12 |
| 44 | Cantabria | 5.09 |
| 45 | Salamanca | 5.09 |
| 46 | Lugo | 4.95 |
| 47 | Pontevedra | 4.94 |
| 48 | Santa Cruz de Tenerife | 4.93 |
| 49 | Asturias | 4.48 |
| 50 | León | 4.46 |
| 51 | Zamora | 4.22 |
| 52 | Ourense | 4.15 |
Source, coverage and limits of the comparison
The source is Spain’s Instituto Nacional de Estadística (INE), INEbase table family 67223, for reference year 2024. The extracted regional series contains 52 numeric observations: the 50 provinces plus Ceuta and Melilla. The national Spain total is excluded from this local ranking. No observation is missing or suppressed in the 52-row comparison, so no zero filling, interpolation or substitution from another year is needed.
This clean same-year coverage is a strength, but it does not turn a one-year cross-section into a trend. The 2024 ranking cannot tell whether a province’s crude birth rate rose or fell from 2023, or whether its position is persistent. Answering those questions requires comparable observations over several years. It is also important to keep the unweighted regional mean separate from a national rate. A population-weighted aggregate or INE’s official national series is needed for a national figure.
Frequently Asked Questions
Which area had Spain’s highest crude birth rate in 2024?
Melilla was highest at 9.19 births per 1,000 inhabitants, followed by Almería at 8.59 and Ceuta at 8.22.
Is the crude birth rate the same as the total fertility rate?
No. The crude birth rate counts births per 1,000 people in the total population, while the total fertility rate summarizes age-specific fertility as expected children per woman.
Is the 6.24 regional mean the national crude birth rate for Spain?
No. It is an unweighted average of 52 territorial rates. A national rate requires the official national aggregate or appropriate population weighting.
Related Articles
Green Map creates custom-edited map images using open geographic data sources such as geoBoundaries, Natural Earth, OpenStreetMap, and government open data. These maps are edited visual materials, not raw data files, and are provided for education, documents, presentations, and graphic reference.