Tariff binding coverage for manufactured products measures the share of manufactured-product tariff lines that are covered by an agreed WTO bound rate. It is not an average tariff rate and it does not show how much importers actually pay. A value of 100% therefore means broad coverage of legal tariff commitments, not a 100% tariff. A value of 0% is also not the same thing as duty-free trade.
The World Bank TM.TAX.MANF.BC.ZS extract used here contains the latest non-missing observation for 161 economies. Its distribution is unusually polarized: 100 economies are recorded at exactly 0%, 33 at exactly 100%, and only 28 fall between those endpoints. The arithmetic mean is 31.37%, while the median is 0%. Those summary statistics should not be read as a “world tariff binding rate,” because every economy is weighted equally and the observation years are not uniform.
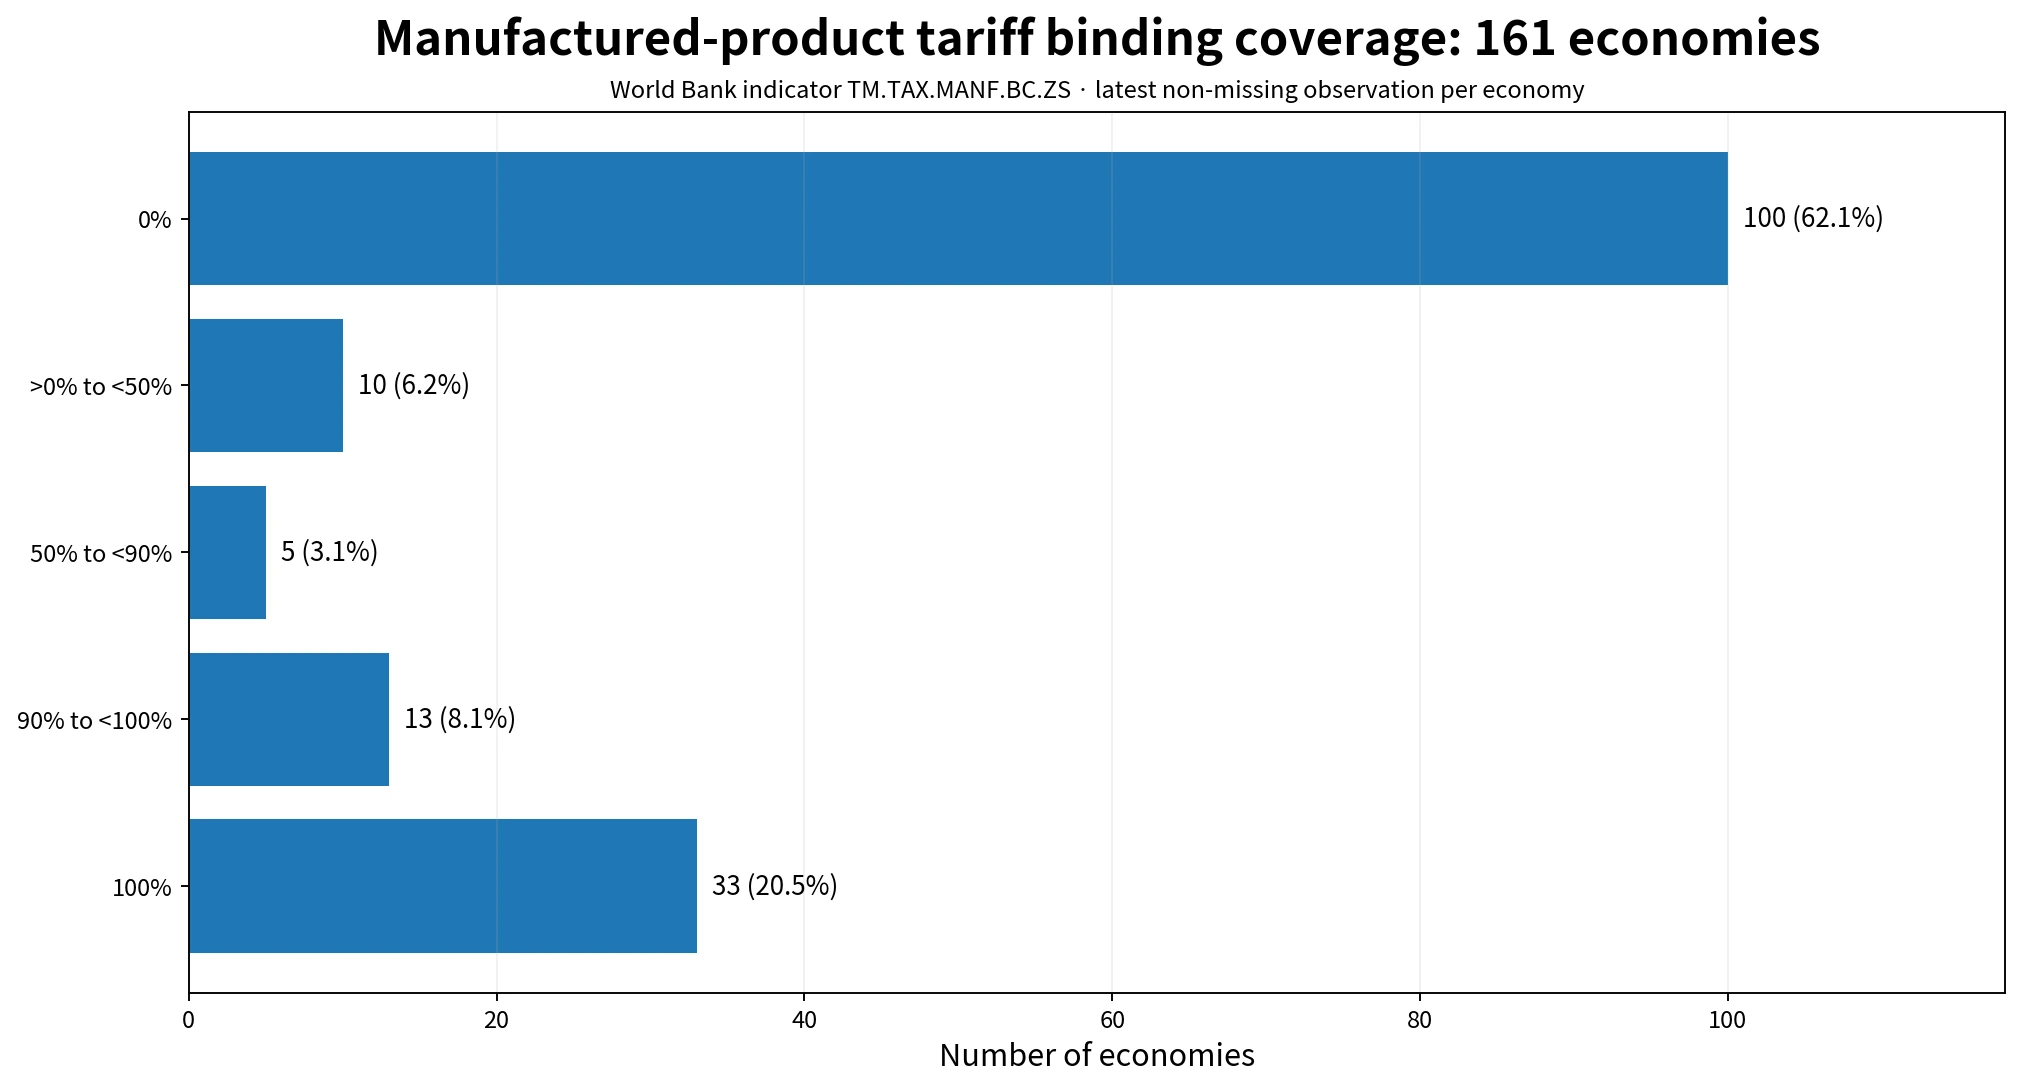
Table of Contents
What manufactured-product tariff binding coverage measures
A tariff binding is a commitment not to raise a customs duty above an agreed ceiling without following WTO procedures and, where required, compensating affected members. The World Bank metadata defines binding coverage as the percentage of product lines with an agreed bound rate. For this indicator, manufactured products are commodities in SITC Revision 3 sections 5 through 8, excluding division 68. The metric is therefore about the coverage of commitments across product lines.
This distinction separates binding coverage from two other tariff concepts. The bound rate is the ceiling written into the commitment, while the applied rate is the tariff actually charged. An economy can bind nearly all manufactured-product lines and still apply tariffs well below those ceilings. Conversely, a partial binding coverage figure does not tell us whether the tariffs actually applied to imports are high or low. The indicator answers one narrow question: how much of the manufactured tariff schedule is covered by binding commitments.
The 161-economy snapshot is concentrated at the two endpoints
Of the 161 latest observations, 100 are exactly 0%, representing 62.1% of the sample. Another 33 are exactly 100%, or 20.5%. Ten economies lie above 0% but below 50%, five are between 50% and 90%, and 13 are at least 90% but below 100%. Taken together, 133 of 161 observations—82.6%—sit at one of the two exact endpoints.
| Reported binding-coverage band | Economies | Share of 161 |
|---|---|---|
| 0% | 100 | 62.1% |
| >0% to <50% | 10 | 6.2% |
| 50% to <90% | 5 | 3.1% |
| 90% to <100% | 13 | 8.1% |
| 100% | 33 | 20.5% |
That endpoint concentration explains why a single average can be misleading. The mean of 31.37% is pulled upward by the group at or near full coverage, while the median is 0% because more than half of the observations are recorded as zero. The dataset is not shaped like a smooth continuum in which most economies cluster around 30%. It is much closer to a two-ended distribution with a relatively small middle group.
A 100% value is about coverage, not tariff height
When the indicator reports 100%, the useful interpretation is that manufactured-product tariff lines are fully or effectively fully covered by bound commitments under the indicator’s methodology. It does not mean that a 100% duty is charged. The actual tariff on an imported manufactured good may be zero, a few percent, or another amount below the legally committed ceiling. Binding coverage and tariff level answer different questions.
Nor does full binding coverage, by itself, establish whether a trade regime is “open” or “closed.” A broad commitment can improve predictability because tariff lines are subject to agreed ceilings, but the economic effect also depends on the height of those ceilings, the applied MFN rates, preferential agreements, product composition, exemptions, and non-tariff measures. Binding coverage is one structural feature of a tariff schedule, not a complete score of trade policy.
A 0% value is not a synonym for zero tariffs
The zero observations require even more care. Zero in this series is a reported binding-coverage value; it is not a statement that the economy levies no tariffs. In this extract, a large number of the 2022 records are zero. Because the dataset is built by taking the latest non-missing World Bank observation for each economy, those zeroes describe the published indicator snapshot, but they should not automatically be converted into a claim about the economy’s entire current legal tariff schedule.
For legal or operational decisions, the safer workflow is to use the World Bank series as a comparative indicator and then verify the relevant economy in the WTO Consolidated Tariff Schedules or the current WTO Tariff & Trade Data profile. This is especially important when a latest observation appears to differ sharply from an economy’s longer historical pattern. A statistical snapshot is useful for analysis, but it is not a substitute for the underlying schedule of commitments.
The 28 intermediate observations show several levels of partial coverage
Only 28 economies fall strictly between 0% and 100% in this snapshot. Viet Nam is reported at 98.68% in 2022 and Ecuador at 94.87%. Israel is at 71.45%, Singapore at 67.43%, and the Philippines at 61.38%. Farther down the middle range, Mauritania is at 34.31%, Sri Lanka at 29.13%, Bangladesh at 4.52%, and Mozambique at 1.53%. These figures measure the share of manufactured tariff lines covered by bindings, not the level of the duties themselves.
| Economy | Observation year | Manufactured binding coverage |
|---|---|---|
| Viet Nam | 2022 | 98.68% |
| Ecuador | 2022 | 94.87% |
| Israel | 2022 | 71.45% |
| Singapore | 2022 | 67.43% |
| Philippines | 2022 | 61.38% |
| Mauritania | 2022 | 34.31% |
| Sri Lanka | 2021 | 29.13% |
| Bangladesh | 2022 | 4.52% |
| Mozambique | 2021 | 1.53% |
The intermediate values are useful because they make the metric’s structure easier to see. A move from 60% to 90% means that a larger share of the manufactured tariff schedule is covered by commitments. It does not reveal whether the bound ceilings are 5%, 20%, or much higher, and it does not show the applied tariff actually collected. To compare tariff restrictiveness, binding coverage needs to be paired with bound-rate and applied-rate indicators.
The observations do not all refer to 2022
A second major limitation is the mix of reference years. Of the 161 rows, 136 are from 2022, equal to 84.5% of the sample. Fourteen are from 2021 and six from 2020. Five additional observations come from 2014, 2016, 2017, 2018, and 2019, one economy in each year. Calling the table “161 economies in 2022” would therefore be inaccurate. A better description is “the latest non-missing observation for 161 economies, with 2022 as the maximum reference year.”
| Observation year | Economies | Share |
|---|---|---|
| 2022 | 136 | 84.5% |
| 2021 | 14 | 8.7% |
| 2020 | 6 | 3.7% |
| 2014, 2016, 2017, 2018, 2019 | 1 each; 5 total | 3.1% |
Mixed-year snapshots are convenient when the goal is broad coverage, but they are not a synchronized cross-section. Institutional indicators such as tariff commitments can change over time, and even where legal commitments are stable, the reporting and compilation of an indicator can change. When two economies have different observation years, their values should be treated as latest available records rather than perfectly simultaneous measurements.
Why a country ranking would add little information
A conventional top-10 ranking is not very informative here because 33 economies share the maximum value of 100%. Any ordering within that group would be arbitrary. The same problem exists at the bottom, where 100 economies share the exact value of 0%. The more informative questions are how much of the sample sits at each endpoint, how many observations are partial, and how old each economy’s latest observation is.
Economy counts also do not represent the share of world trade. A small island economy and a very large trading economy each count as one observation. Saying that 62.1% of the 161 economies are recorded at zero is not the same as saying that 62.1% of manufactured trade is unbound. No trade weights, import values, or product-value weights are used in that percentage.
Binding coverage should be read alongside bound and applied tariff rates
A practical tariff analysis separates at least three dimensions. Binding coverage asks what share of tariff lines is covered by WTO commitments. The bound tariff rate asks how high the committed ceiling is on the lines that are bound. The applied or MFN applied rate asks what tariff is actually charged under the relevant schedule. These measures are related, but none can replace the others.
For example, an economy can have 100% coverage and still have relatively high or low bound ceilings. It can also apply rates well below those ceilings. Another economy can have partial coverage but low applied rates on many imports. Using the three dimensions together avoids the common mistake of treating “binding coverage” as if it were a measure of tariff burden.
Official sources and how to reproduce the snapshot
The World Bank indicator code is TM.TAX.MANF.BC.ZS. The World Bank metadata glossary defines the indicator and its manufactured-product scope. The WTO Tariff Profile technical notes explain binding coverage and distinguish bound commitments from applied tariffs.
To reproduce this 161-economy view, keep one latest non-missing observation per economy and preserve the original year attached to each row. Do not replace missing values with zero, and do not relabel older observations as 2022. For current legal status or a country-specific decision, use the latest WTO schedule and member profile in addition to the World Bank indicator.
What the snapshot is most useful for
The central finding is not a single leader. It is the structure of the data: 82.6% of the observations are exactly 0% or 100%, only 17.4% are intermediate, and 15.5% of the rows predate 2022. The 31.37% mean therefore has little value as a stand-alone description of a “typical” economy, and the many ties make ranking weak.
The indicator is best used as a starting point for understanding the breadth of manufactured-product tariff commitments. A 100% observation describes coverage of bindings, not a 100% tariff, and a 0% observation is not duty-free status. Analysts interested in actual protection, import costs, or current legal commitments should combine binding coverage with bound rates, applied MFN rates, trade weights, and the most recent WTO tariff schedules.
Frequently Asked Questions
Does 100% manufactured tariff binding coverage mean a 100% tariff?
No. It means the manufactured tariff schedule is fully or nearly fully covered by bound commitments under the indicator methodology. The applied tariff rate is a separate measure.
Does a 0% observation mean the economy has no tariffs?
No. Zero is the reported binding-coverage value, not an applied tariff rate. For current legal status, check the latest WTO tariff schedule and member profile.
Are all 161 observations from 2022?
No. 136 are from 2022, while 25 use the latest non-missing observation from 2014 through 2021. The dataset is a latest-available snapshot rather than a synchronized 2022 cross-section.
Related Articles
Green Map creates custom-edited map images using open geographic data sources such as geoBoundaries, Natural Earth, OpenStreetMap, and government open data. These maps are edited visual materials, not raw data files, and are provided for education, documents, presentations, and graphic reference.