Petroleum-liquid energy use in the non-CHP U.S. electric power sector was highly concentrated in 2024. Across the 50 states, the Energy Information Administration observations sum to 108.70078 million MMBtu. Hawaii alone recorded 60.05122 million MMBtu, or 55.24% of the 50-state total. Alaska ranked a distant second at 8.43029 million MMBtu. The gap is large enough that a simple average gives a poor picture of what a typical state looked like, so the distribution is more useful when the total, median, shares, and range are read together.
The measure is EIA total-consumption-btu for petroleum liquids in the Electric Power Sector Non-CHP category. It covers fuel energy consumed for electricity generation and useful thermal output within that defined sector. It is not electricity generation, capacity, retail sales, a fuel-price series, or a percentage of a state’s power mix. Keeping that definition intact matters because neighboring EIA series can describe only electricity generation, only useful thermal output, another fuel, or a different sector and therefore answer a different question.
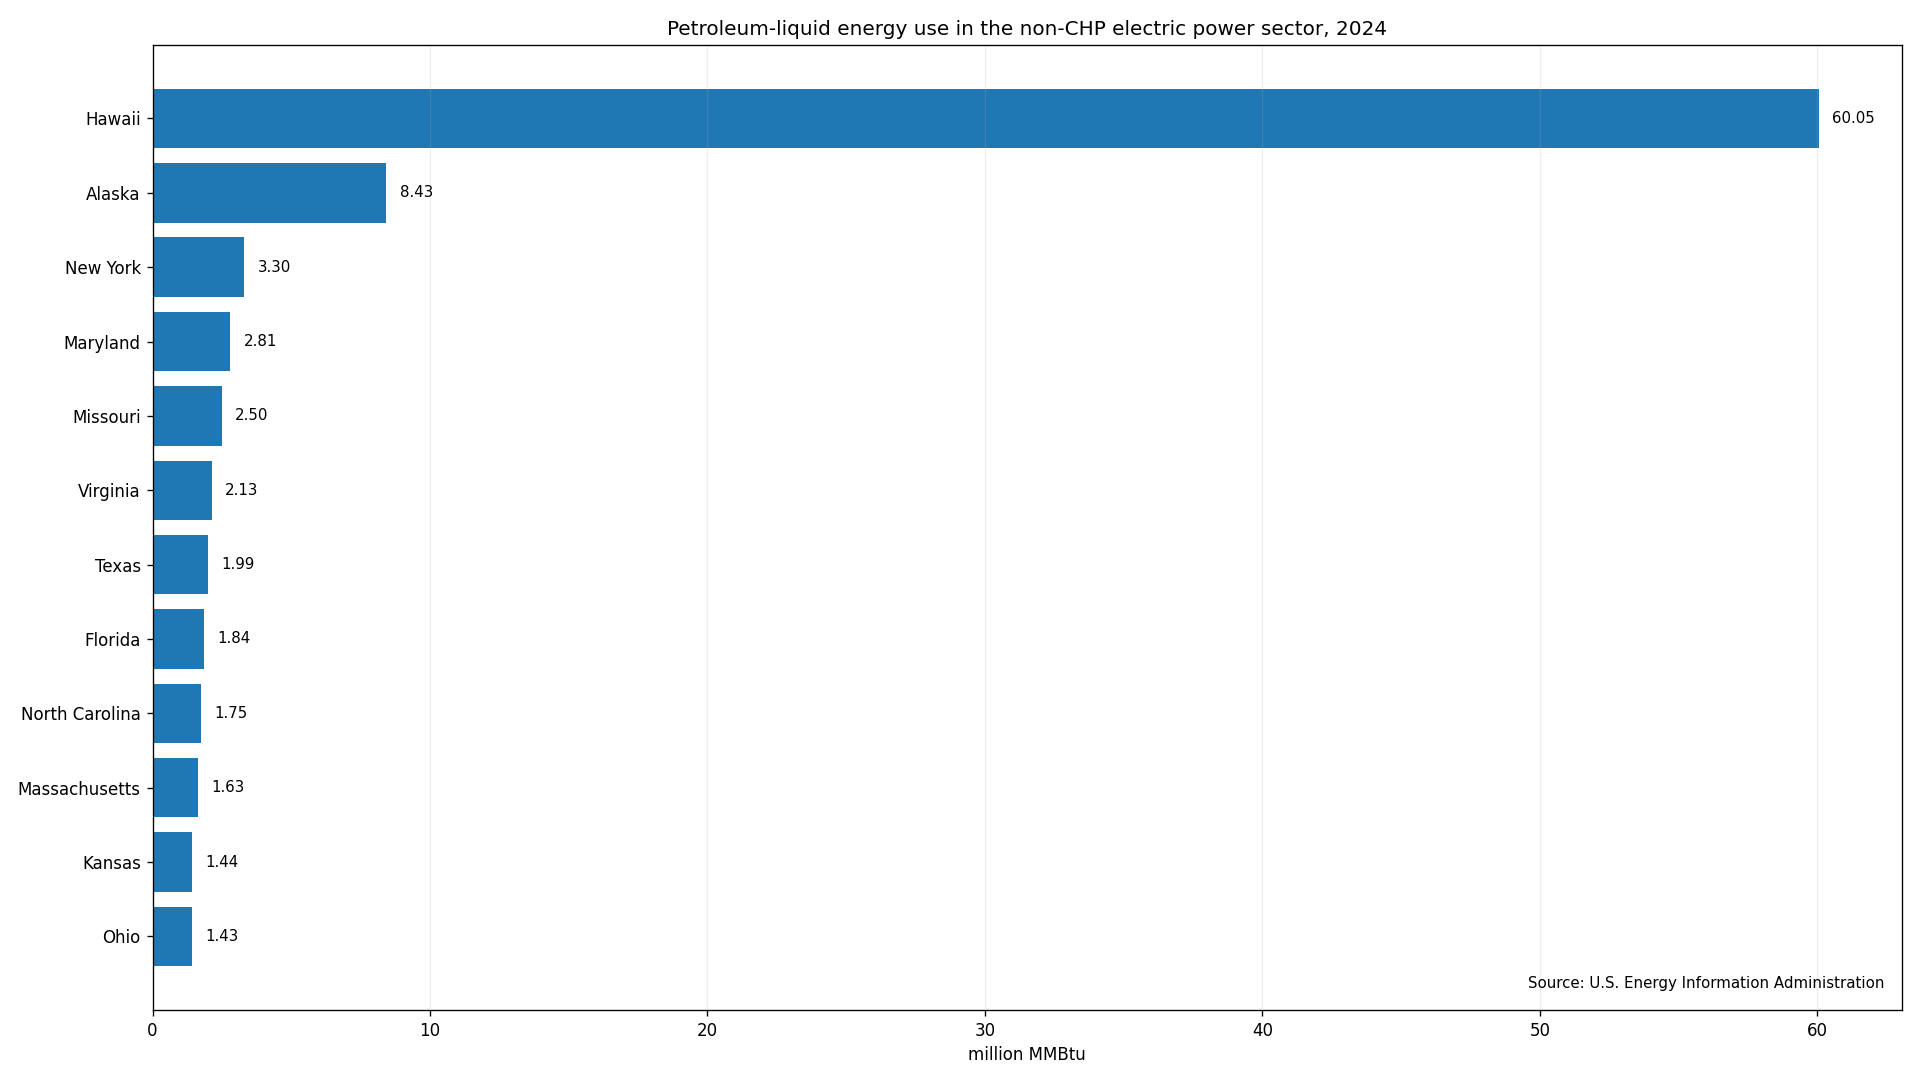
Table of Contents
Hawaii accounted for more than half of the 50-state total
Hawaii is the defining observation in the 2024 distribution. Its 60.05122 million MMBtu represented 55.24% of the total, meaning the state by itself exceeded the combined value of the other 49 states. Alaska contributed another 7.76% at 8.43029 million MMBtu. New York followed at 3.30020 million MMBtu, Maryland at 2.80820, and Missouri at 2.49833. Together, the top five states represented about 70.92% of the national 50-state sum.
That concentration changes how the summary statistics should be read. The arithmetic mean was 2.17402 million MMBtu, but the median was only 0.566505. If Hawaii is removed, the mean for the remaining 49 states falls to about 0.99285 million MMBtu. The difference does not make the mean wrong; it shows that the mean is strongly affected by one very large observation. For a reader trying to understand the typical state, the median is therefore a more informative companion statistic.
| State | 2024 value (million MMBtu) | Share of 50-state total |
|---|---|---|
| Hawaii | 60.05122 | 55.24% |
| Alaska | 8.43029 | 7.76% |
| New York | 3.30020 | 3.04% |
| Maryland | 2.80820 | 2.58% |
| Missouri | 2.49833 | 2.30% |
| Virginia | 2.13218 | 1.96% |
| Texas | 1.99210 | 1.83% |
| Florida | 1.84300 | 1.70% |
| North Carolina | 1.75284 | 1.61% |
| Massachusetts | 1.62621 | 1.50% |
Values fall sharply after the two leading states
After Hawaii and Alaska, the ranking compresses quickly. New York’s 3.30020 million MMBtu equaled 3.04% of the total. Maryland accounted for 2.58%, Missouri 2.30%, Virginia 1.96%, and Texas 1.83%. Florida, North Carolina, and Massachusetts were also above 1.6 million MMBtu. In all, 19 states recorded at least 1 million MMBtu, while 31 were below that level. The pattern is therefore not a smooth progression from the largest to the smallest states; it has two unusually high values followed by a much denser middle.
These rankings should not be treated as a ranking of total electricity generation or dependence on petroleum. The dataset fixes the fuel to petroleum liquids and the sector to non-CHP electric power, and it measures input energy in million MMBtu. A state could have high total electricity generation and still rank low on this particular measure if other fuels dominate its non-CHP generation. Conversely, a high value here does not tell us what percentage of a state’s electricity came from petroleum liquids. A percentage-based mix measure would require a different denominator.
Very small values are observations, not missing data
At the other end of the distribution, Idaho recorded 0.00049 million MMBtu, the lowest value among the 50 states. New Mexico was next at 0.01135, followed by Mississippi at 0.05589, Rhode Island at 0.05803, Vermont at 0.06735, and Nevada at 0.07323 million MMBtu. Six states were below 0.1 million MMBtu. These are positive reported observations, not blanks, so they should not be converted to zero or labeled as no data.
The ratio between the largest and smallest observations is enormous, which creates a visualization challenge. On a linear bar chart, Hawaii naturally dominates the horizontal scale and middle-ranked states appear compressed. That visual effect is accurate as far as magnitude goes, but it can hide meaningful variation among the many states clustered between roughly 0.3 and 2 million MMBtu. Reading the chart with the table and median avoids the mistaken conclusion that those states are all effectively the same.
The median describes the center better than the mean
The 25th percentile was approximately 0.29439 million MMBtu and the 75th percentile about 1.36864 million MMBtu. Half of the states therefore fell within that broad interval, while the mean sat above the 75th percentile because of the long upper tail. This is a textbook example of why a skewed distribution benefits from multiple summary measures rather than a single average. The median answers where the center state lies, while the total and state shares answer where the aggregate fuel energy was concentrated.
Those are different analytical questions. If the goal is to describe a typical state, 0.566505 million MMBtu is the relevant midpoint. If the goal is to identify which states accounted for the largest portion of the 108.70078 million MMBtu total, the state shares are more useful. Hawaii’s 55.24% and Alaska’s 7.76% immediately show that the national total was not evenly spread. Keeping “typical level” and “contribution to the total” separate prevents a common statistical misreading.
What the 2024 data can and cannot establish
The dataset is well suited to a same-year state comparison because every observation uses the same fuel category, sector definition, annual frequency, and unit. It can establish which states had higher or lower recorded petroleum-liquid input energy within the specified non-CHP electric power sector, how concentrated the 50-state total was, and how far the distribution extended from the minimum to the maximum. It also supports transparent calculations such as state shares, median, quartiles, and counts above or below chosen numeric thresholds.
The data do not, by themselves, explain why the states differ. Plant fleets, fuel logistics, operating practices, system conditions, costs, reserve needs, and other factors could matter, but none of those causal variables are present in this one-series state slice. The series also does not report conversion efficiency or the amount of electricity produced from each unit of fuel energy. Explaining causes would require additional EIA series or other primary evidence, and any causal claim should be tested against those data rather than inferred from the rank order alone.
A practical way to read the state distribution
A useful reading sequence is to start with concentration, then move to the center, and finally inspect the tails. First, note that Hawaii alone accounts for more than half of the total. Second, compare the 2.17402 mean with the 0.566505 median to see how strongly the upper tail shifts the average. Third, look at the 19 states at or above 1 million MMBtu and the six states below 0.1 million MMBtu. This sequence keeps the extreme value from obscuring the broader state pattern.
- 50-state total: 108.70078 million MMBtu
- Mean: 2.17402 million MMBtu; median: 0.566505 million MMBtu
- Hawaii: 60.05122 million MMBtu, 55.24% of the total
- Alaska: 8.43029 million MMBtu, 7.76% of the total
- States at or above 1 million MMBtu: 19; states below 0.1 million MMBtu: 6
Source and measurement basis
The observations come from the U.S. Energy Information Administration Open Data electricity/electric-power-operational-data dataset for 2024. The selected fuel type is petroleum liquids, the selected sector is Electric Power Sector Non-CHP, and the field is total-consumption-btu. The supplied dataset contains one observation for each of the 50 states and no missing values. Totals, rankings, shares, averages, medians, and percentile summaries in this article are calculated from those state observations.
Frequently Asked Questions
Which state had the highest value in 2024?
Hawaii ranked first at 60.05122 million MMBtu, equal to 55.24% of the 50-state total.
Does this measure electricity generation?
No. It measures petroleum-liquid fuel energy consumed for electricity generation and useful thermal output in the non-CHP electric power sector, in million MMBtu.
Why is the mean much higher than the median?
The distribution is strongly skewed by Hawaii and, to a lesser extent, Alaska. The mean was 2.17402 million MMBtu while the median was 0.566505.
Related Articles
Green Map creates custom-edited map images using open geographic data sources such as geoBoundaries, Natural Earth, OpenStreetMap, and government open data. These maps are edited visual materials, not raw data files, and are provided for education, documents, presentations, and graphic reference.