UNESCO Institute for Statistics (UIS) reported 2023 adjusted gender parity index (GPIA) values for outbound student mobility to Latin America for 114 countries and territories. The series is not a ranking of the number of students going abroad. It compares the female outbound mobility ratio with the male ratio within each origin country, after applying the adjusted parity scale. A value of 1 marks equality between the two ratios; values below 1 indicate a lower female ratio, while values above 1 indicate a higher female ratio.
The 2023 observations were widely dispersed. 71 values were below 0.97, 4 were between 0.97 and 1.03, and 39 were above 1.03. The mean was 0.897 and the median was 0.835. Those summary statistics place the centre of the observed distribution below 1, but they should not be interpreted as a general score of gender equality in education. The indicator is specific to outbound tertiary mobility toward Latin America.
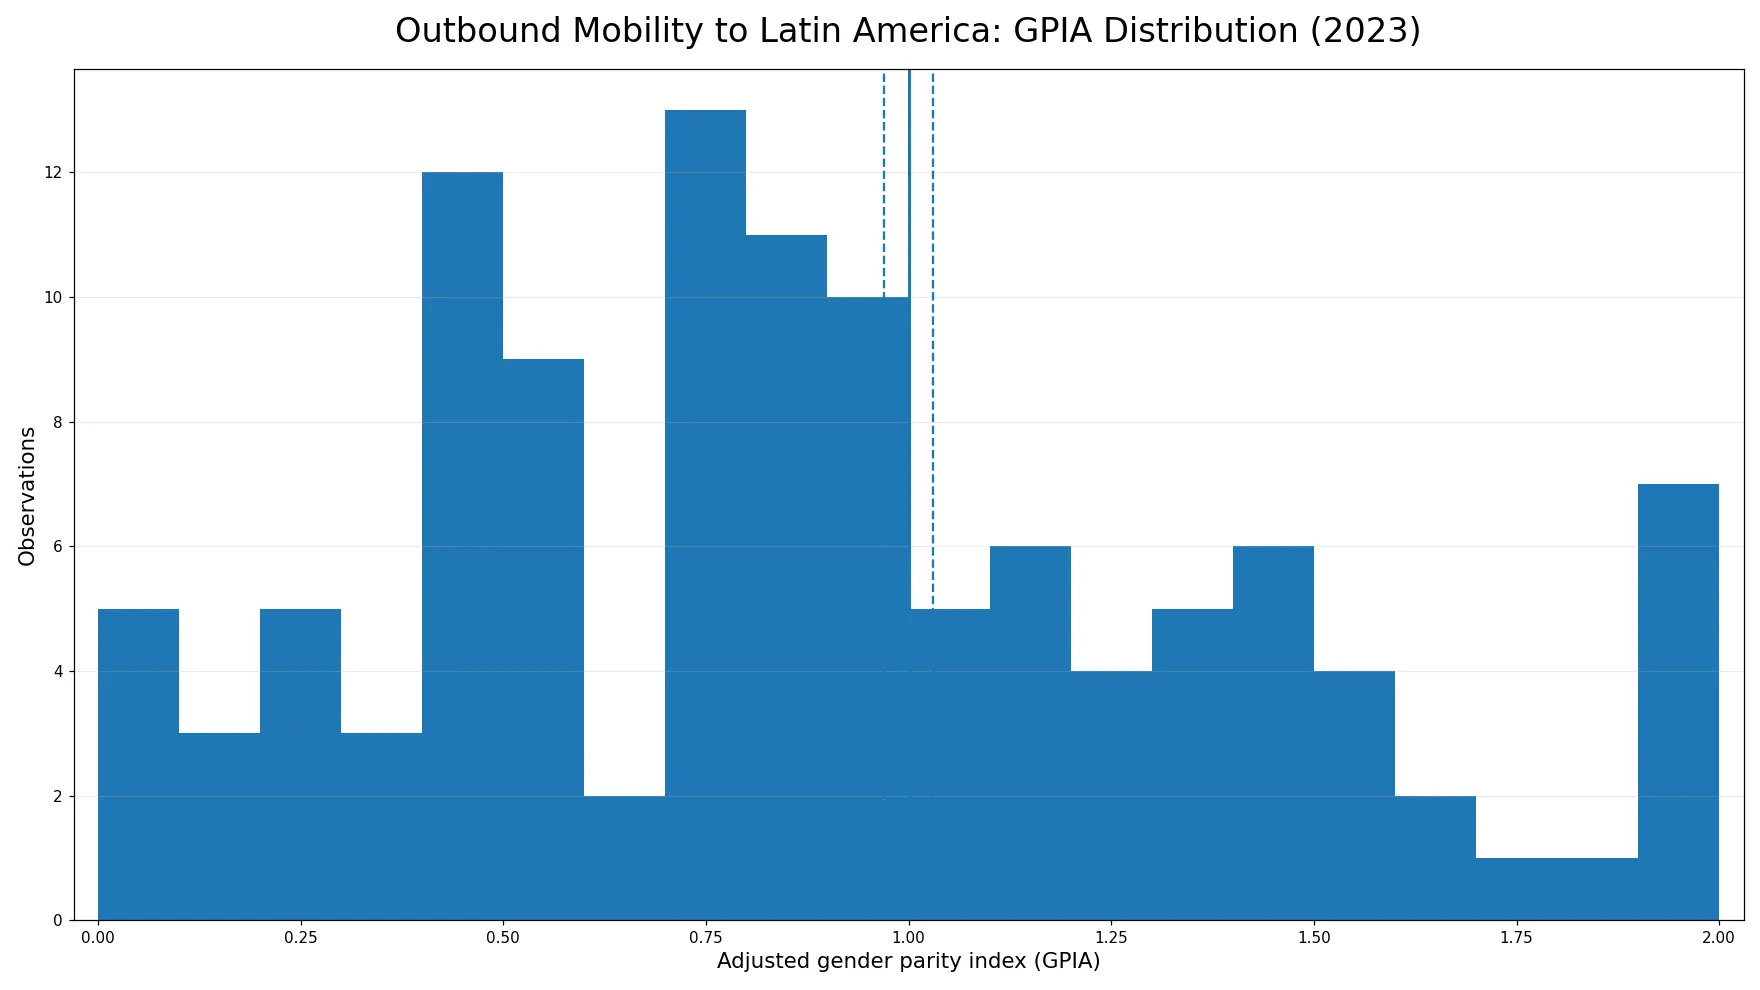
Table of Contents
The index compares female and male mobility ratios, not student totals
An outbound mobility ratio relates students from an origin country who study abroad to the size of tertiary enrolment in that origin country. This particular UIS series narrows the destination to Latin America and then compares the female and male versions of that ratio. As a result, the GPIA answers a compositional question: are the two sex-specific mobility ratios similar, or is one higher than the other? It does not answer how many students travel to Latin America, how important Latin America is among all destinations, or how large the origin country’s tertiary system is.
The adjusted parity scale is centred on 1 and bounded between 0 and 2. Its purpose is to make departures from parity easier to compare in opposite directions. The sign of the departure matters: below 1 points to a lower female mobility ratio, while above 1 points to a higher female mobility ratio. Distance from 1 describes the size of the imbalance on this adjusted scale. Because the measure is a relative index, it should not be read as a percentage or converted directly into a difference in student counts.
Only four observations fell inside the 0.97–1.03 parity band
Using the 0.97–1.03 interval around 1, only 4 of the 114 reported observations were in the parity band. Spain was closest to 1 at 1.01888. Saint Lucia followed at 0.98074, Bosnia and Herzegovina at 0.97509, and Algeria at 1.02602. Each sits on a slightly different side of parity, but the important common feature is the small absolute distance from 1.
| Country or territory | 2023 GPIA | Distance from 1 |
|---|---|---|
| Spain | 1.019 | 0.019 |
| Saint Lucia | 0.981 | 0.019 |
| Bosnia and Herzegovina | 0.975 | 0.025 |
| Algeria | 1.026 | 0.026 |
| China | 0.958 | 0.042 |
| Chile | 1.044 | 0.044 |
| Germany | 0.955 | 0.045 |
| Philippines | 0.948 | 0.052 |
The balance of the remaining observations was asymmetric. There were 71 values below 0.97 compared with 39 above 1.03. In this dataset, lower-than-parity female mobility ratios toward Latin America were therefore more common than higher-than-parity female ratios. That is a statement about the direction of the ratio, not the number of women or men studying abroad. A country with a small total flow can still have a GPIA far from 1.
The median was 0.835 and the middle half stretched from about 0.505 to 1.231
Ordering all 114 observations from low to high gives a median of 0.835. The first quartile is 0.505 and the third quartile is 1.231. In other words, the middle 50 percent of reported values covered a broad interval of roughly 0.505 to 1.231. That span crosses 1 but is far wider than the narrow parity band, showing why a single average cannot describe the country-level pattern well.
The mean, 0.897, was higher than the median because several observations were well above 1 and some reached the upper boundary of the adjusted scale. The lower tail also contains values near zero. When a distribution has both boundary values and a wide central spread, it is more informative to read the median, the parity-band count, and distance from 1 together rather than treating the mean as a typical national value.
Boundary values at 0 and 2 require careful interpretation
There were 4 official observations recorded at exactly 0 and 7 recorded at exactly 2. The zero values were Cambodia, Monaco, Malaysia, and Samoa. Values of 2 appeared for Iceland, North Macedonia, Malta, Oman, Qatar, Slovenia, and Thailand. These are legitimate reported values in the supplied UIS extract, not placeholders inserted for missing data.
| Lowest observations | 2023 GPIA |
|---|---|
| Cambodia | 0.000 |
| Malaysia | 0.000 |
| Monaco | 0.000 |
| Samoa | 0.000 |
| South Africa | 0.064 |
| Palestine | 0.102 |
| Serbia | 0.176 |
| Cook Islands | 0.179 |
| Highest observations | 2023 GPIA |
|---|---|
| Iceland | 2.000 |
| Malta | 2.000 |
| North Macedonia | 2.000 |
| Oman | 2.000 |
| Qatar | 2.000 |
| Slovenia | 2.000 |
| Thailand | 2.000 |
| Bahrain | 1.842 |
A boundary value indicates a very strong imbalance in the sex-specific mobility ratios on the adjusted scale, but it does not by itself reveal the size of the underlying flow. When one of the original sex-specific ratios is extremely small, a relative index can move toward a boundary even if the absolute number of mobile students is modest. The next analytical step for an extreme observation would therefore be to inspect the underlying female and male mobility ratios, and preferably student counts as well.
Countries without a reported observation are not zeros
The UIS extract contains 114 observed national or territorial rows for this indicator. Geographic units that do not appear in the extract should be treated as not reported for this series, not as having a value of zero. This distinction matters because four observed units really do have an official value of zero. Replacing missing countries with zero would blur the difference between a reported boundary value and the absence of a reported observation, and it would distort averages and rankings.
The series used here is also a single-year cross-section for 2023. It cannot establish whether gender balance improved or deteriorated over time in any origin country. A trend analysis would require comparable observations from multiple years and a clear rule for handling countries that enter or leave the reported set. Without that longitudinal evidence, the safest reading is descriptive: this is the pattern observed for the reported 2023 values.
Latin America is the destination filter, not the origin group
The wording of the indicator is easy to misread. The 114 rows are origin countries and territories from different parts of the world; Latin America is the destination region used to define the mobility ratio. That means the index describes the gender balance among students from each origin who move toward Latin America for tertiary study. It should not be interpreted as a measure limited to Latin American origin countries.
Destination-specific mobility can differ from overall outbound mobility. Language, institutional links, scholarship arrangements, fields of study, geography, and migration networks could all be relevant to destination choice, but the GPIA series alone does not test any of those explanations. The data support a comparison of the observed gender ratio pattern; causal explanations require additional variables and evidence.
What this dataset supports—and what it does not
The dataset supports three direct comparisons. It shows the direction of the female-to-male mobility balance in 2023, it allows distance from parity to be compared across reported origins, and it shows the overall shape of the 114-observation distribution. It does not provide total outbound student numbers, the share of all outbound students choosing Latin America, destination-country detail within Latin America, or evidence about why the gender balance differs.
For practical use, start with the relationship to 1. Values near 1 indicate similar female and male mobility ratios; values far from 1 identify origin countries where the sex-specific ratios are more uneven. Then, if the research question concerns participation levels or policy, pair the GPIA with the underlying female and male mobility ratios and actual student counts. This sequence prevents a relative parity index from being mistaken for a measure of scale.
Frequently Asked Questions
What does a GPIA of 1 mean?
It means the female and male outbound mobility ratios to Latin America are equal within the same origin country. Below 1 the female ratio is lower; above 1 it is higher.
How many 2023 observations were in the 0.97–1.03 parity band?
4 of 114 observations. Spain was closest to 1 at 1.01888.
Does a higher GPIA mean more students study in Latin America?
No. GPIA is a relative parity index between female and male mobility ratios. It does not directly measure student counts or the total level of outbound mobility.
Related Articles
Green Map creates custom-edited map images using open geographic data sources such as geoBoundaries, Natural Earth, OpenStreetMap, and government open data. These maps are edited visual materials, not raw data files, and are provided for education, documents, presentations, and graphic reference.