UNESCO Institute for Statistics (UIS) observations for 2023 show a wide spread in the adjusted gender parity index (GPIA) for outbound mobility to South and West Asia. The series contains 97 country and territory observations. GPIA is not a ranking of how many students each country sends abroad. It compares the female and male outbound mobility ratios for the same origin country after transforming the gender parity index onto a symmetric 0-to-2 scale. A value of 1 means the female and male mobility ratios are equal, a value below 1 means the female ratio is lower, and a value above 1 means the female ratio is higher.
Using the UIS parity band of 0.97 to 1.03, only 1 of the 97 observations fell inside the parity range in 2023. Mexico was closest to 1 at 1.00499. There were 68 observations below 0.97 and 28 above 1.03. This distribution points to substantial variation in the gender composition of mobility toward this destination region. It does not, however, measure overall gender equality in higher education or the total level of international student mobility.
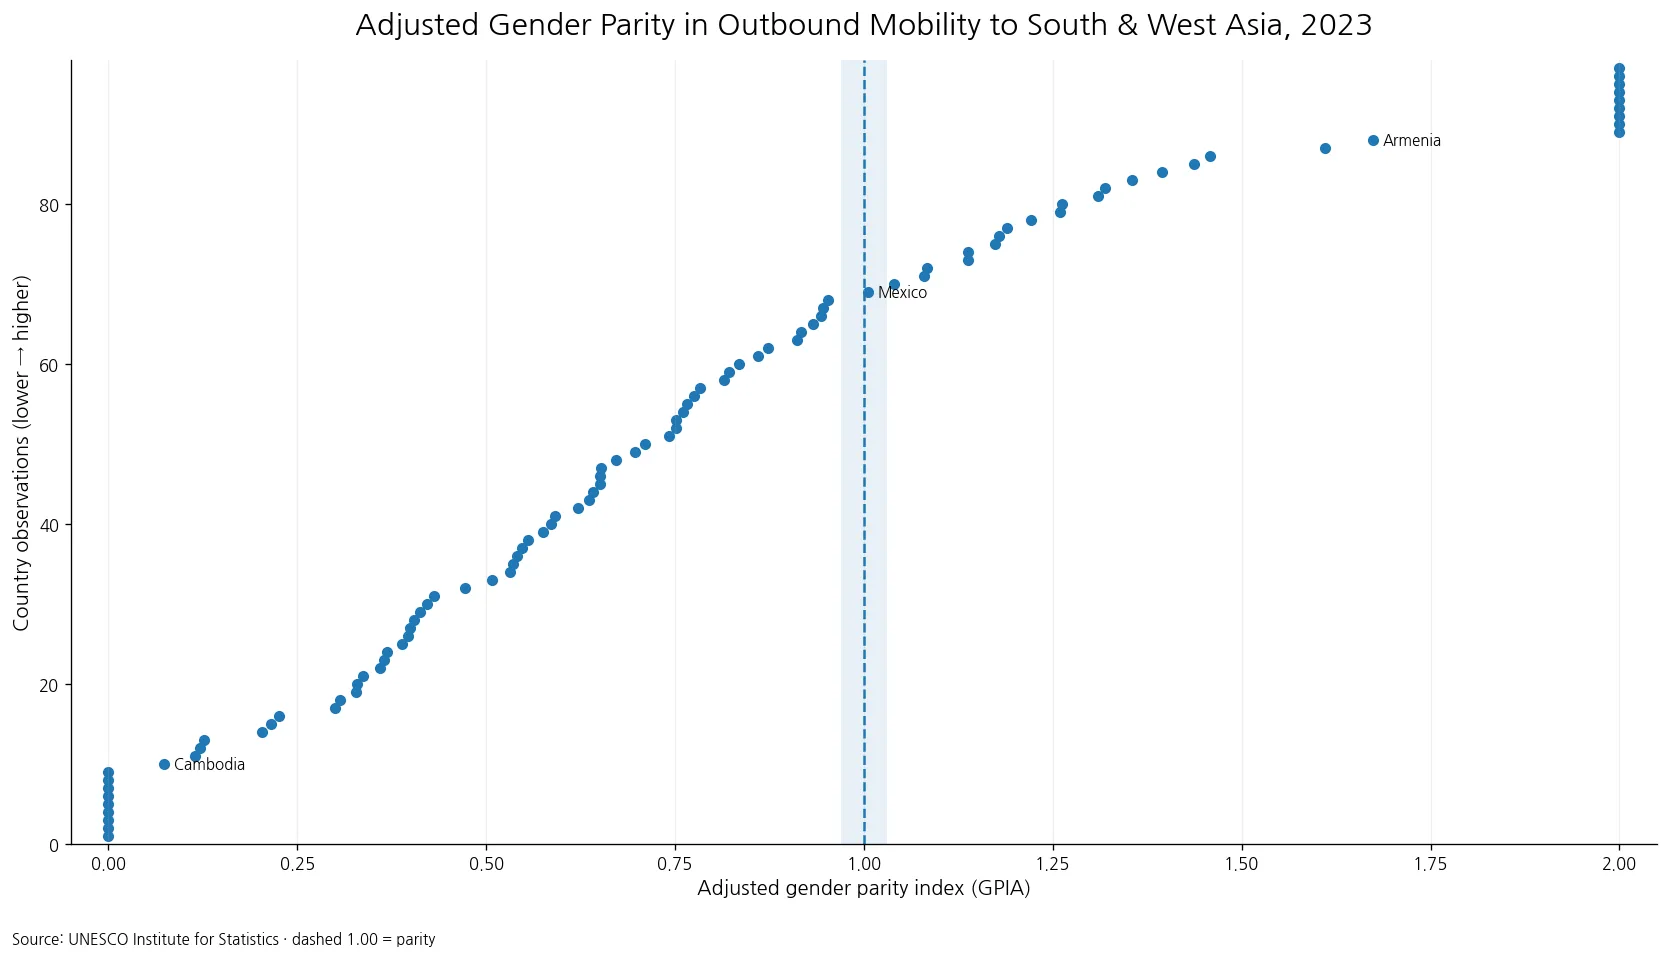
Table of Contents
A GPIA of 1 means equal female and male outbound mobility ratios
UIS defines the outbound mobility ratio as the number of students from a country who study abroad expressed relative to total tertiary enrolment in that origin country. The measure can be disaggregated by sex, level of education, and destination region or continent. The series examined here is a further comparison: it takes the female and male outbound mobility ratios specifically for South and West Asia as the destination and summarizes their relationship with the adjusted gender parity index.
The adjustment matters because the ordinary female-to-male ratio is not symmetric around 1. A ratio of 0.5 and a ratio of 2.0 do not sit at comparable distances in an unbounded scale even though they describe opposite two-to-one relationships. UIS therefore transforms ratios above 1 so that the adjusted index ranges from 0 to 2 and is symmetric around parity. That makes distance from 1 easier to compare, but it also means the GPIA should not be read as a percentage or as a student count.
Mexico was closest to parity, while the parity band contained only one observation
Mexico recorded 1.00499, only 0.00499 away from 1. Under the 0.97–1.03 parity convention, it was the only observation in the band. Brazil was just above the upper boundary at 1.04009, while Lao PDR was just below the lower boundary at 0.95196. Norway and the United States were also comparatively close to 1 but remained below 0.97.
| Country | 2023 GPIA | Distance from 1 |
|---|---|---|
| Mexico | 1.005 | 0.005 |
| Brazil | 1.040 | 0.040 |
| Lao People's Democratic Republic | 0.952 | 0.048 |
| Republic of Korea | 0.946 | 0.054 |
| Norway | 0.943 | 0.057 |
| United States of America | 0.932 | 0.068 |
| Denmark | 1.080 | 0.080 |
| United Arab Emirates | 0.917 | 0.083 |
| United Republic of Tanzania | 1.084 | 0.084 |
| Bhutan | 0.911 | 0.089 |
Distance from 1 is the most direct way to compare closeness to gender parity on this adjusted scale. Small differences among near-parity countries should not be exaggerated, however. A GPIA of 0.95 and one of 0.94 point in the same direction, but the underlying numbers of mobile students and the size of the tertiary system can be completely different. Two countries can also have the same GPIA while having very different female and male mobility rates in absolute terms.
Most observations were on the below-1 side of the distribution
The median GPIA across the 97 observations was 0.697, while the mean was 0.788. Both are below 1, and the count distribution is even clearer: 68 observations, about 70.1%, were below 0.97, whereas 28, about 28.9%, were above 1.03. The first quartile was 0.388 and the third quartile was 1.138, so the middle half of observed values stretched across a broad range rather than clustering tightly around parity.
For this indicator, a value below 1 means the female outbound mobility ratio to South and West Asia was lower than the male ratio; above 1 means the female ratio was higher. It is safer to describe the direction in those terms rather than labeling one side “better.” International mobility is not an outcome where a higher rate is automatically desirable for every individual or country, and the dataset does not establish why men and women chose different destinations.
Values of 0 and 2 are official endpoints, not missing data
The UIS series contains 9 observations reported exactly as 0 and 9 reported exactly as 2. Those are the endpoints of the adjusted 0-to-2 GPIA scale. They were published as values in the source series and are not gaps that were filled with zero. Treating them as missing would distort the observed distribution. At the same time, the endpoint alone is not enough to reconstruct the original female and male mobility ratios or student counts, so it should not be reverse-engineered into unsupported quantities.
| Lowest observed GPIA | Value |
|---|---|
| Chile | 0.000 |
| Cyprus | 0.000 |
| Iceland | 0.000 |
| Israel | 0.000 |
| Lithuania | 0.000 |
| Saint Lucia | 0.000 |
| Samoa | 0.000 |
| Slovakia | 0.000 |
| Tonga | 0.000 |
| Cambodia | 0.073 |
| Palestine | 0.115 |
| Jordan | 0.121 |
| Highest observed GPIA | Value |
|---|---|
| Belarus | 2.000 |
| Cuba | 2.000 |
| Czechia | 2.000 |
| Ecuador | 2.000 |
| El Salvador | 2.000 |
| Estonia | 2.000 |
| Latvia | 2.000 |
| Poland | 2.000 |
| Slovenia | 2.000 |
| Armenia | 1.674 |
| Belgium | 1.611 |
| Georgia | 1.458 |
The two ends point in opposite directions but can be compared through their distance from 1. A value near 0 is an extreme on the side where the female mobility ratio is lower; a value near 2 is an extreme on the side where it is higher. Because the adjusted transformation compresses the original female-to-male ratio into a bounded scale, differences such as 0.2 versus 0.4 should not be interpreted as simple differences in student numbers.
This destination-specific measure is not the same as overall outbound mobility
The geographic qualifier is essential. These values refer to outbound mobility toward South and West Asia. A country with a GPIA of 0.7 for this destination region can have a very different gender balance among students going to Europe, North America, East Asia, or other destinations. Language, geographic proximity, scholarship networks, subject specialization, migration pathways, and institutional partnerships can all shape destination choice.
The underlying outbound mobility ratio also uses total tertiary enrolment in the origin country as its denominator. That means two countries sending the same number of students abroad can have different mobility ratios if the size of their tertiary systems differs. GPIA adds another layer by comparing those sex-specific ratios. It is therefore a relative balance measure built on top of a rate, not a direct count of internationally mobile students.
The index cannot explain why a country is above or below parity
Explaining the observed gaps would require additional evidence: female and male outbound student counts, sex-specific tertiary enrolment, scholarship participation, study fields, costs, visa routes, destination-country policies, and possibly socioeconomic background. The same GPIA can emerge from different combinations of numerator and denominator. A cross-sectional index by itself cannot identify a causal mechanism.
The reverse is also important. A value close to 1 does not prove that the broader system is gender-equal. Female and male mobility rates could both be very low and still be equal, or both could be high and equal. GPIA answers a narrow question about balance between two rates. To understand scale and parity together, the original sex-specific mobility ratios should be examined alongside the adjusted index.
A single 2023 snapshot cannot establish a trend
Every observation in this comparison is from 2023. Without the same indicator for earlier years, it is not possible to say which countries are moving toward parity, which are moving away, or whether the number of countries in the parity band is rising. Being closest to 1 in a single year is not the same as making the largest improvement over time.
A multi-year extension could calculate the absolute distance |GPIA−1| for each country and track whether it narrows. It could also count how many observations fall in the 0.97–1.03 band each year and whether endpoint values of 0 or 2 become less common. Such a trend analysis would need to preserve missing values and account for changes in country coverage instead of assuming that an absent observation equals zero.
Three rules make this indicator easier to interpret correctly
First, 1 represents gender balance, not a large amount of mobility. Second, the destination is specifically South and West Asia, so the index does not describe all study-abroad destinations. Third, GPIA is a transformed relative index and does not directly report the number of students or the size of the mobility ratio. Keeping those boundaries visible prevents a precise indicator from being turned into a much broader claim than the data support.
In 2023, 1 of 97 observations fell inside the 0.97–1.03 parity band, 68 were below it, and 28 were above it. Mexico was closest to 1, and the median across observed countries and territories was 0.697. The results show wide country-level variation in the gender balance of outbound mobility toward South and West Asia. The next analytical step is to connect the same UIS indicator across multiple years and pair it with the underlying female and male mobility rates.
Frequently Asked Questions
What does a GPIA value of 1 mean?
It means the female and male outbound mobility ratios to South and West Asia are equal for the same origin country. Values below 1 indicate a lower female ratio; values above 1 indicate a higher female ratio.
How many observations were in the parity band in 2023?
Using the UIS 0.97–1.03 convention, 1 of 97 observations fell inside the band. Mexico was closest to 1 at 1.00499.
Does a higher GPIA mean more students study abroad?
No. GPIA is a relative gender-balance index. It does not directly report the number of mobile students or the overall level of outbound mobility.
Related Articles
Green Map creates custom-edited map images using open geographic data sources such as geoBoundaries, Natural Earth, OpenStreetMap, and government open data. These maps are edited visual materials, not raw data files, and are provided for education, documents, presentations, and graphic reference.