Fuel energy consumed by the U.S. Electric Power sector for electricity generation and useful thermal output differed substantially by state in 2025. In the annual U.S. Energy Information Administration data, Texas recorded 3,979.824 million MMBtu, the highest value among the 50 states and the District of Columbia. Pennsylvania followed at 2,069.515, and Florida at 2,007.672 million MMBtu. At the opposite end, the District of Columbia recorded 0.173 and Vermont 12.490 million MMBtu. The range immediately shows that the amount of fuel energy entering Electric Power operations was far from uniform across jurisdictions.
The definition is essential. This EIA series measures the energy content of all fuels consumed in the Electric Power sector for both electricity generation and useful thermal output, expressed in million MMBtu. It is not electricity generation, retail electricity sales, capacity, fuel cost, emissions, or a fuel-share percentage. It also should not be treated as identical to a series limited to fuel consumed only for electricity generation. The useful-thermal-output component makes the scope broader, so similar-looking EIA titles can represent different measurements.
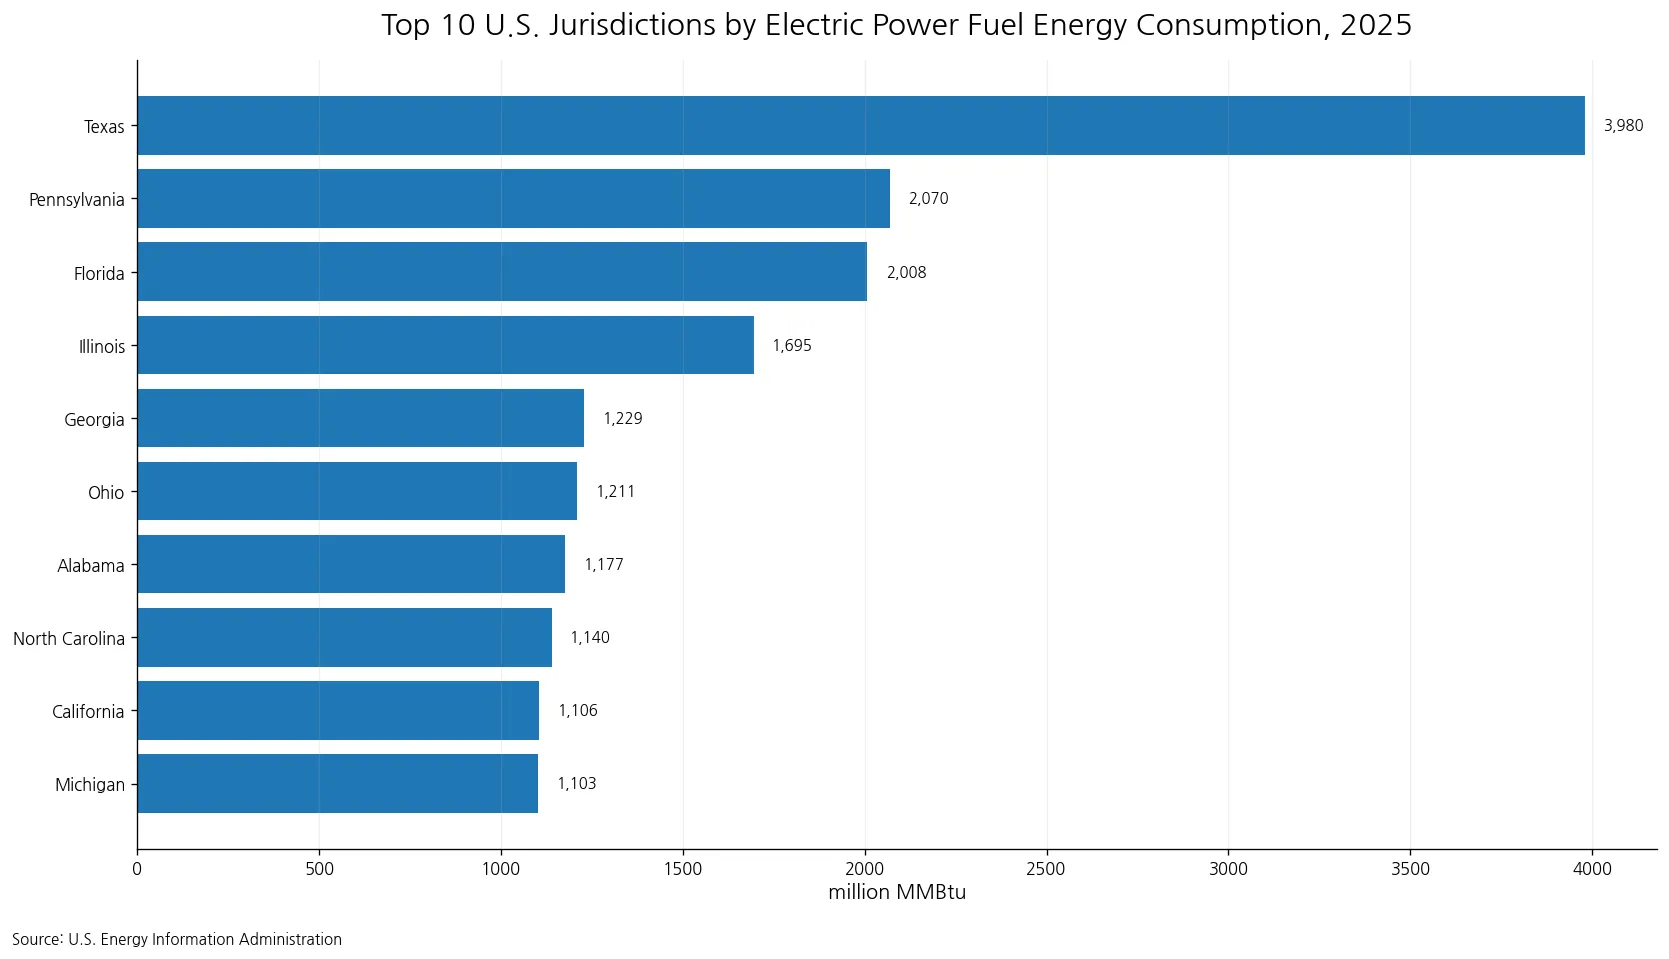
Table of Contents
Texas led the distribution, but the national total was not dominated by one state
Adding the 51 reported values gives 33,647.319 million MMBtu. Texas accounts for about 11.8% of that total. Pennsylvania contributes about 6.2%, while Florida contributes roughly 6.0%. The top five jurisdictions together represent 32.6%, and the top ten represent 49.7%. That is meaningful concentration: ten jurisdictions account for almost half of the observed total. At the same time, Texas alone does not approach one-third or one-half of the national sum, so the upper end is shared by several large states rather than being a single-state phenomenon.
The gap between Texas and Pennsylvania is 1,910.309 million MMBtu. By contrast, the gap between Pennsylvania and Florida is only 61.843. Illinois, in fourth place, records 1,694.736, and Georgia, in fifth, records 1,229.289 million MMBtu. Looking at the spacing between values is more informative than rank alone: first place is clearly separated, second and third are close, and the rest of the upper tier declines in a more gradual sequence.
The ten largest state-level values
The top ten jurisdictions are Texas, Pennsylvania, Florida, Illinois, Georgia, Ohio, Alabama, North Carolina, California, and Michigan. Each exceeds 1,100 million MMBtu. In fact, these are the only ten jurisdictions above 1,000 million MMBtu in this 2025 dataset. That numerical threshold is not an official EIA category; it is simply a convenient description of the observed distribution.
| Jurisdiction | 2025 consumption (million MMBtu) |
|---|---|
| Texas | 3,979.824 |
| Pennsylvania | 2,069.515 |
| Florida | 2,007.672 |
| Illinois | 1,694.736 |
| Georgia | 1,229.289 |
| Ohio | 1,210.535 |
| Alabama | 1,177.059 |
| North Carolina | 1,140.119 |
| California | 1,106.088 |
| Michigan | 1,103.066 |
Michigan, tenth, records 1,103.066 million MMBtu, while South Carolina, eleventh, records 991.636. Their difference is only 111.430 million MMBtu. This illustrates why a top-ten cutoff should not be interpreted as a sharp structural boundary. California, Michigan, South Carolina, New York, and Arizona form a relatively continuous cluster compared with the much larger gap between Texas and Pennsylvania.
The mean sits well above the median
The arithmetic mean across all 51 jurisdictions is 659.751 million MMBtu, while the median is 502.668. The mean exceeds the median by 157.084 million MMBtu. Washington is the median observation at 502.668 million MMBtu, meaning half of the jurisdictions lie above that level and half below it. The higher mean reflects the influence of a relatively small number of large state values, especially Texas and the other states near the top.
The first quartile is about 260.493 million MMBtu and the third quartile is about 914.348. In other words, the middle half of the 51 observations lies roughly between those two levels. Thirteen jurisdictions record at least 900 million MMBtu, while 26 record at least 500 million MMBtu. Those counts are consistent with a median just above 500 million MMBtu and show that the distribution is broad rather than tightly centered around one common state value.
Very small values form a distinct lower tail
At the bottom of the distribution, the District of Columbia records 0.173 million MMBtu. Vermont records 12.490, Delaware 35.440, and Alaska 51.468. The bottom ten jurisdictions together sum to 727.784 million MMBtu, only about 2.2% of the 51-jurisdiction total. That is a sharp contrast with the top ten, which account for nearly half.
| Jurisdiction | 2025 consumption (million MMBtu) |
|---|---|
| Idaho | 102.565 |
| Maine | 97.061 |
| Hawaii | 80.624 |
| Rhode Island | 76.209 |
| Alaska | 51.468 |
| Delaware | 35.440 |
| Vermont | 12.490 |
| District of Columbia | 0.173 |
A small value should not be translated into a broad judgment about the jurisdiction’s electricity system. The series records fuel energy input within a specific EIA sector and activity scope. It does not directly report electricity demand, imports and exports, generation mix, thermal efficiency, plant capacity, or the role of individual fuels. A state can therefore appear low on this measure for multiple reasons that are not identified by the single annual observation.
Why fuel energy consumption is not the same as electricity generation
Electricity generation is an output measure. This series is an energy-input measure for fuels used to produce electricity and useful thermal output. Different technologies and fuels convert energy inputs to electricity and heat in different ways, so equal fuel-energy consumption does not imply equal electricity production. Likewise, higher fuel-energy consumption cannot by itself establish lower efficiency. A meaningful efficiency comparison would require consistent output data and a carefully matched definition of the relevant inputs.
The “all fuels” label is another reason for caution. The state total combines the fuels covered by the EIA series rather than showing coal, natural gas, petroleum, nuclear, renewables, or other categories separately. A high total does not reveal which fuel was responsible. To answer that question, the state-level total has to be paired with fuel-specific consumption series or other detailed EIA tables.
What the state pattern can establish
The dataset can establish the 2025 ordering and distribution with precision. Texas is highest at 3,979.824 million MMBtu. Pennsylvania and Florida are the only other jurisdictions above 2,000 million MMBtu. Ten jurisdictions exceed 1,000 million MMBtu. The top ten account for 49.7% of the total, while the bottom ten account for only 2.2%. The median is 502.668, below the mean of 659.751. These are direct comparisons or arithmetic summaries of the published state values.
What the dataset cannot establish is why those differences exist. Plant fleets, generation technologies, fuel prices, weather, industrial conditions, transmission patterns, combined heat-and-power operations, capacity factors, and policy can all matter in energy systems, but this single table does not test those explanations. Assigning a cause from rank alone would go beyond the evidence. A causal or structural analysis needs additional variables that are aligned by year, sector, geography, and measurement definition.
One year is a snapshot, not a trend
All observations in this comparison are for 2025. That makes the table well suited to a cross-sectional state comparison, but it does not support claims about long-run growth or decline. Texas being the highest in 2025 does not prove it held the same position in earlier years, and a low value in one state does not mean that its fuel use has been falling. Trend statements require the same EIA series for multiple years.
The snapshot is still useful. It establishes a clear baseline for future comparisons: the location of the upper and lower tails, the size of the median state, and the degree of concentration at the top. If earlier and later annual observations are added, the same measures can be recalculated to see whether the top-ten share, the median, or individual state positions changed over time.
How to compare this series with related EIA indicators
A robust comparison starts by matching the metric definition. Similar EIA series may separate electricity generation from useful thermal output, report physical fuel quantities instead of BTU energy content, or isolate one fuel rather than all fuels. Those series can answer complementary questions, but their numbers are not interchangeable. The source field for this article is the annual total-consumption-btu measure for all fuels in sector 98, the Electric Power sector, at the state level.
This distinction is especially important for readers moving among energy charts. A state can rank differently in total fuel energy input, net electricity generation, natural-gas consumption, renewable consumption, or useful thermal output. Each ranking describes a different part of the energy system. Keeping the units and activity scope visible prevents a familiar-looking state list from being interpreted as something the data do not measure.
Bottom line: the distribution matters as much as the leader
Texas had the largest 2025 value for all-fuel energy consumed by the Electric Power sector for electricity generation and useful thermal output, at 3,979.824 million MMBtu. But the broader distribution adds essential context. The top ten jurisdictions account for 49.7% of the total, the mean of 659.751 sits above the median of 502.668, and the bottom ten contribute only 2.2%. Those statistics show a wide, uneven distribution across the 51 jurisdictions.
The most defensible interpretation is therefore about relative scale, not performance. This measure tells us where the Electric Power sector recorded more or less fuel energy input within the defined 2025 activity scope. It does not by itself identify efficiency, electricity output, fuel mix, cost, emissions, or the reasons behind a state’s position. Those questions require separate indicators and additional evidence.
Frequently Asked Questions
Which state had the highest all-fuel energy consumption for electricity generation and useful thermal output in 2025?
Texas had the highest value at 3,979.824 million MMBtu, followed by Pennsylvania at 2,069.515 and Florida at 2,007.672.
Does this series measure electricity generation?
No. It measures the energy content of all fuels consumed by the Electric Power sector for electricity generation and useful thermal output, expressed in million MMBtu.
What was the median state-level value in 2025?
The median across the 50 states and the District of Columbia was 502.668 million MMBtu, compared with a mean of 659.751.
Related Articles
Green Map creates custom-edited map images using open geographic data sources such as geoBoundaries, Natural Earth, OpenStreetMap, and government open data. These maps are edited visual materials, not raw data files, and are provided for education, documents, presentations, and graphic reference.