Freeborn County sits along Minnesota’s southern border, with Albert Lea as the most prominent city and the I-35/I-90 junction providing an easy way to orient the road network. The supplied maps add much more than highways: they show smaller communities, Albert Lea Lake and the Shell Rock River, western lakes and streams, and rolling relief that ranges from roughly 348 to 424 meters. This page explains those county-specific patterns, and the four original high-resolution JPG map files can also be downloaded together in one ZIP archive.
Albert Lea is the natural starting point for reading the county. Alden lies to the west, Clarks Grove and Geneva are north of the city, Glenville is to the south, while Hayward and Myrtle help define the eastern side. The terrain is more varied than the straight county roads initially suggest. Higher, knobby ground appears across the northwest and west-central areas, while the basin around Albert Lea Lake and the south-flowing Shell Rock River forms a noticeably lower corridor.
Table of Contents
Albert Lea at the I-35 and I-90 crossroads
The general county map makes Albert Lea the clearest road-network anchor. I-35 runs north-south through the middle of Freeborn County and continues toward the Iowa line, while I-90 crosses the county from west to east just north of the main Albert Lea built-up area. Their nearby junction gives the city an unusually strong regional orientation role for a county map. Other numbered routes, including 13, 65, 69, 16, and 27, connect the smaller communities to those larger corridors and help divide the county into recognizable travel sectors.
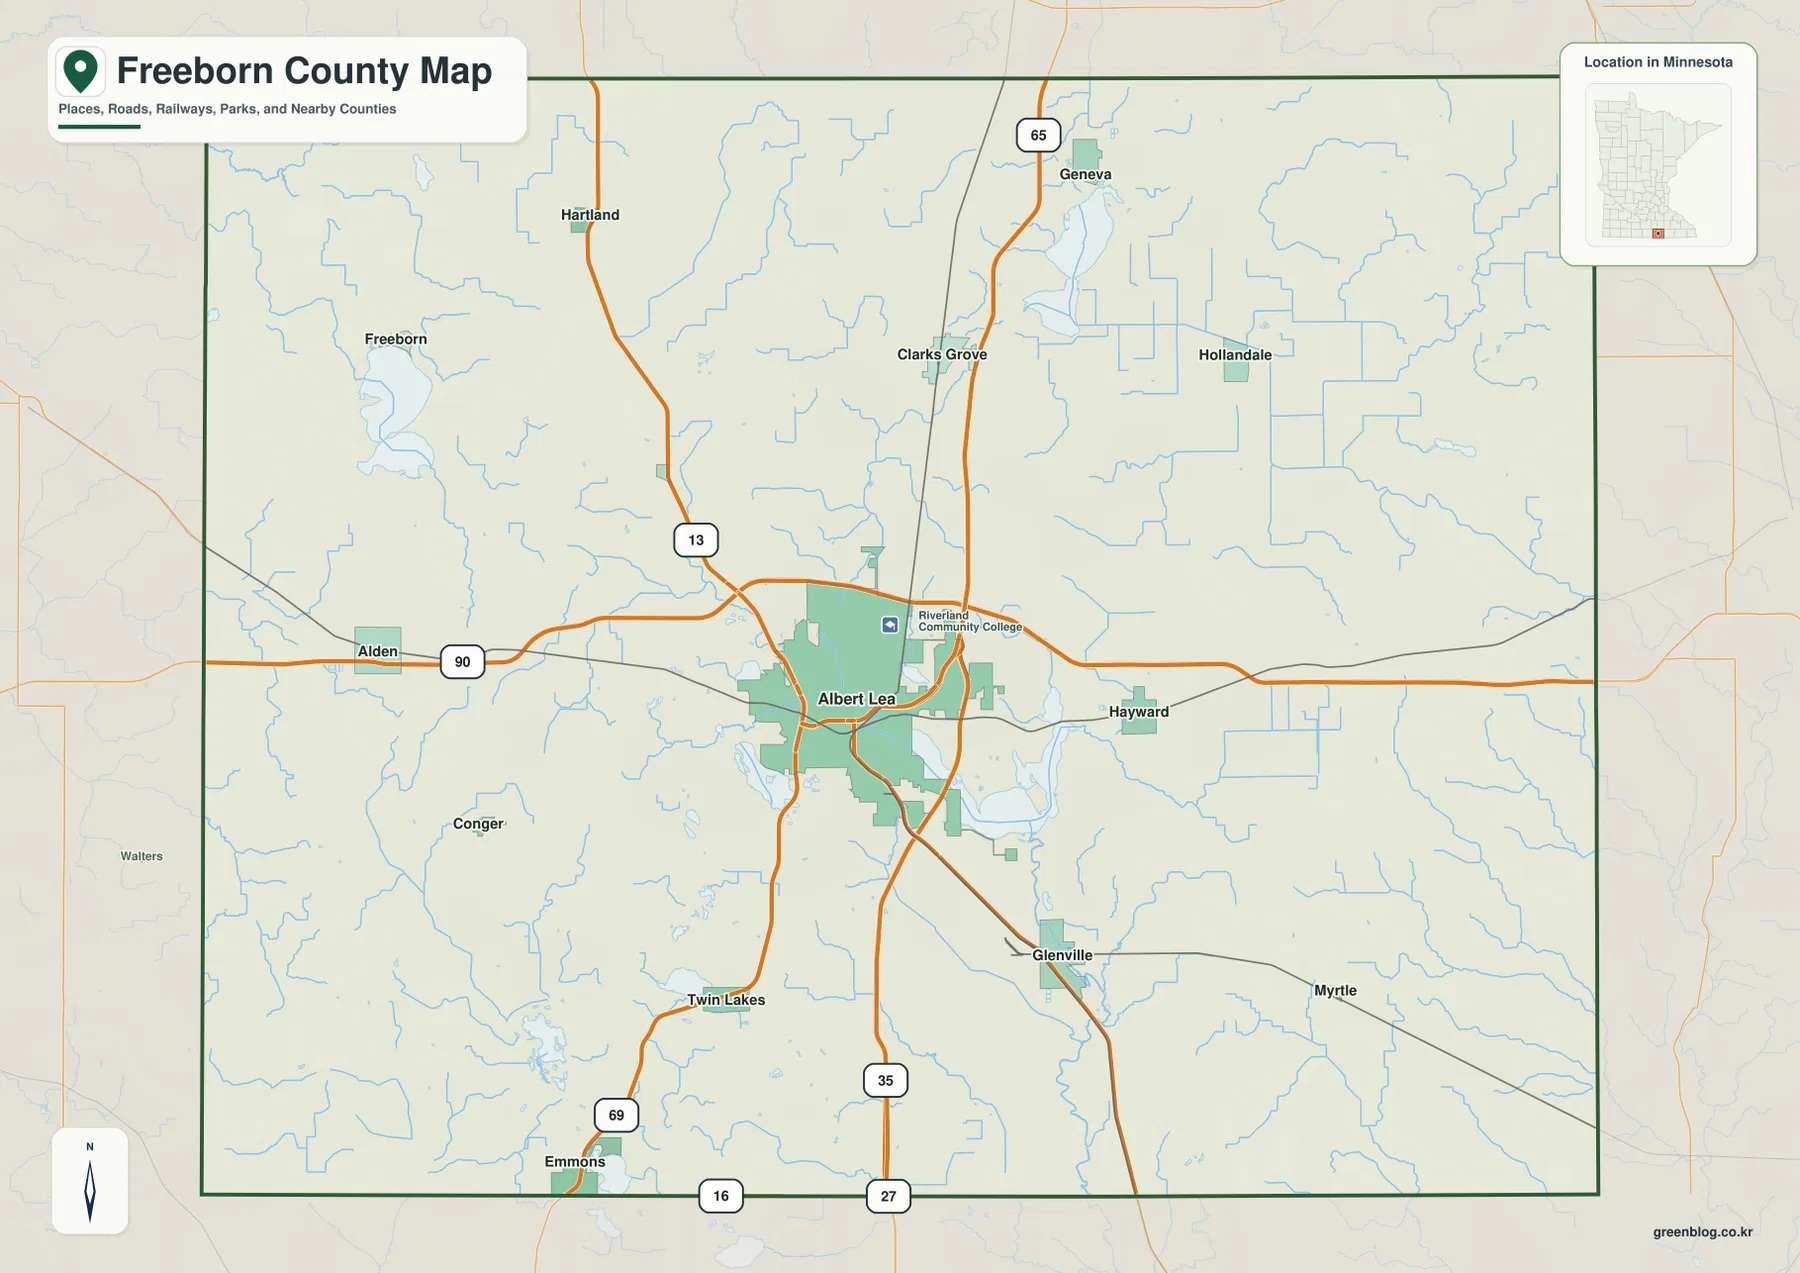
Approaching from the west along I-90, the map passes Alden before reaching the Albert Lea area. North of the city, Clarks Grove and Geneva line up near the Route 65 corridor, while Hartland stands farther northwest. The community named Freeborn appears near the lake and stream network on the western side. South of Albert Lea, Glenville becomes an important reference before the state line, and Twin Lakes and Emmons mark the southwest. Hayward and Myrtle sit to the east, showing that settlement is dispersed along several routes rather than concentrated only around Albert Lea.
This map is best used to understand the overall direction of travel rather than current driving conditions. It does not show live construction, winter closures, lane restrictions, or travel times. For regional orientation, however, the combination of the I-35 north-south axis and the I-90 east-west axis is especially useful. On a classroom or presentation map, marking that crossroads first makes it much easier to place the smaller towns without turning the page into a list of disconnected names.
Six major communities around Albert Lea
The city map removes much of the road detail and emphasizes six communities: Albert Lea, Clarks Grove, Alden, Glenville, Hartland, and Geneva. Albert Lea occupies the south-central position and is clearly the dominant mapped urban center. Clarks Grove is close to the north, Glenville lies below Albert Lea, and Alden is separated to the west. Hartland and Geneva establish two different northern reference points, which makes the simplified map useful when the goal is to explain relative position rather than road-by-road navigation.
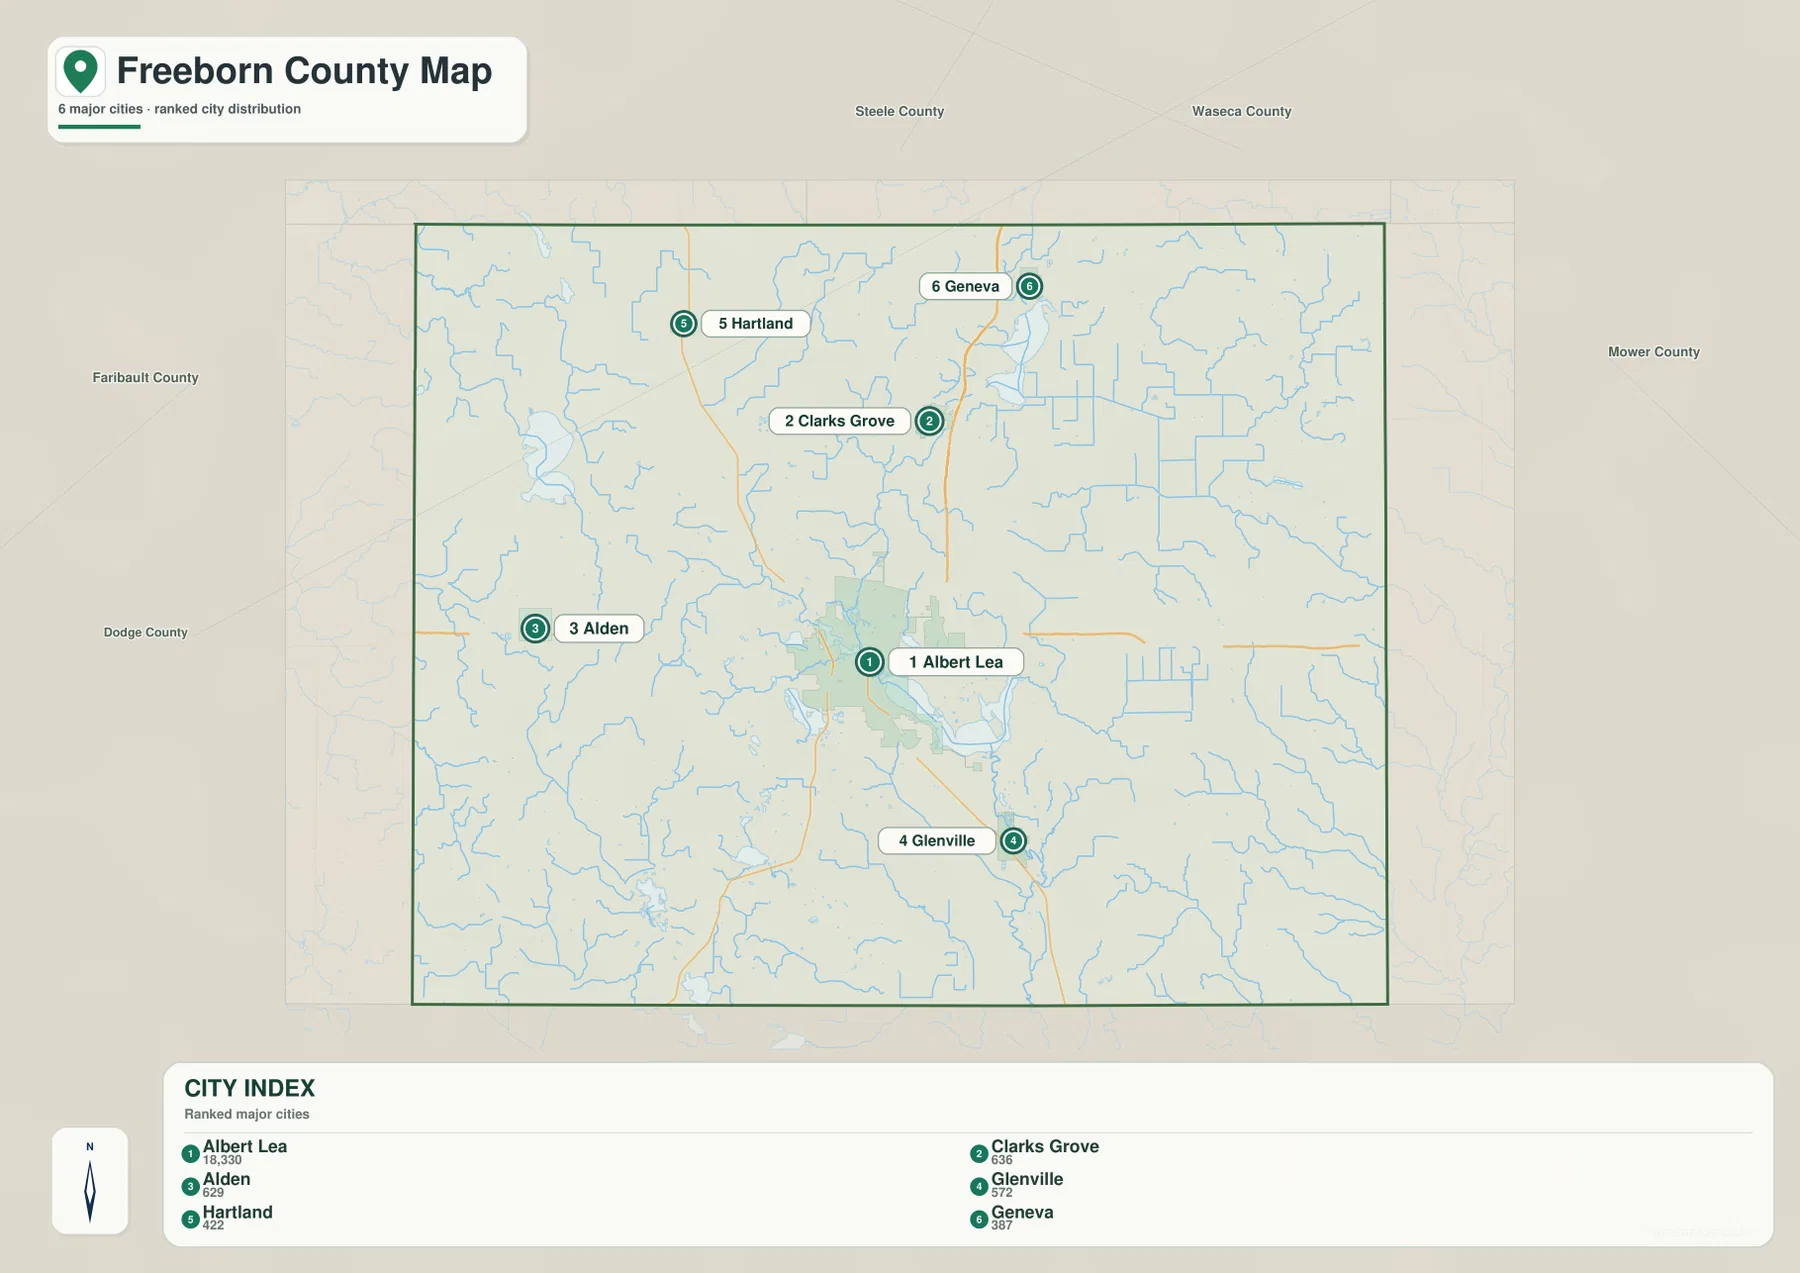
The map index lists Albert Lea at 18,330, Clarks Grove at 636, Alden at 629, Glenville at 572, Hartland at 422, and Geneva at 387. These should be treated as the index values printed on the supplied map rather than assumed to be current population estimates. Their main value here is visual context: Albert Lea is far larger than the other displayed places, yet the smaller towns remain important geographic anchors because they spread across different parts of the county.
No driving distance or travel time is encoded in the city map. The separation between markers is useful for relative geography, but a short-looking gap on the page does not automatically equal a short road trip. For example, Albert Lea and Clarks Grove appear close together, while Alden and Hartland are visibly farther from the main city. When route choice matters, the general county map provides the highway context that the simplified city view intentionally leaves out.
Albert Lea Lake and the south-flowing Shell Rock River
The water map gives the county a very different shape. Albert Lea Lake is the dominant named water body near the center-south, immediately southeast of the city area, and the Shell Rock River continues from the lake toward the Iowa boundary. Pickerel Lake sits just west of Albert Lea Lake, with small connecting waters nearby. This lake-and-river corridor is one of the clearest natural features in the county because it cuts across the otherwise regular road pattern and creates a low, continuous drainage route.
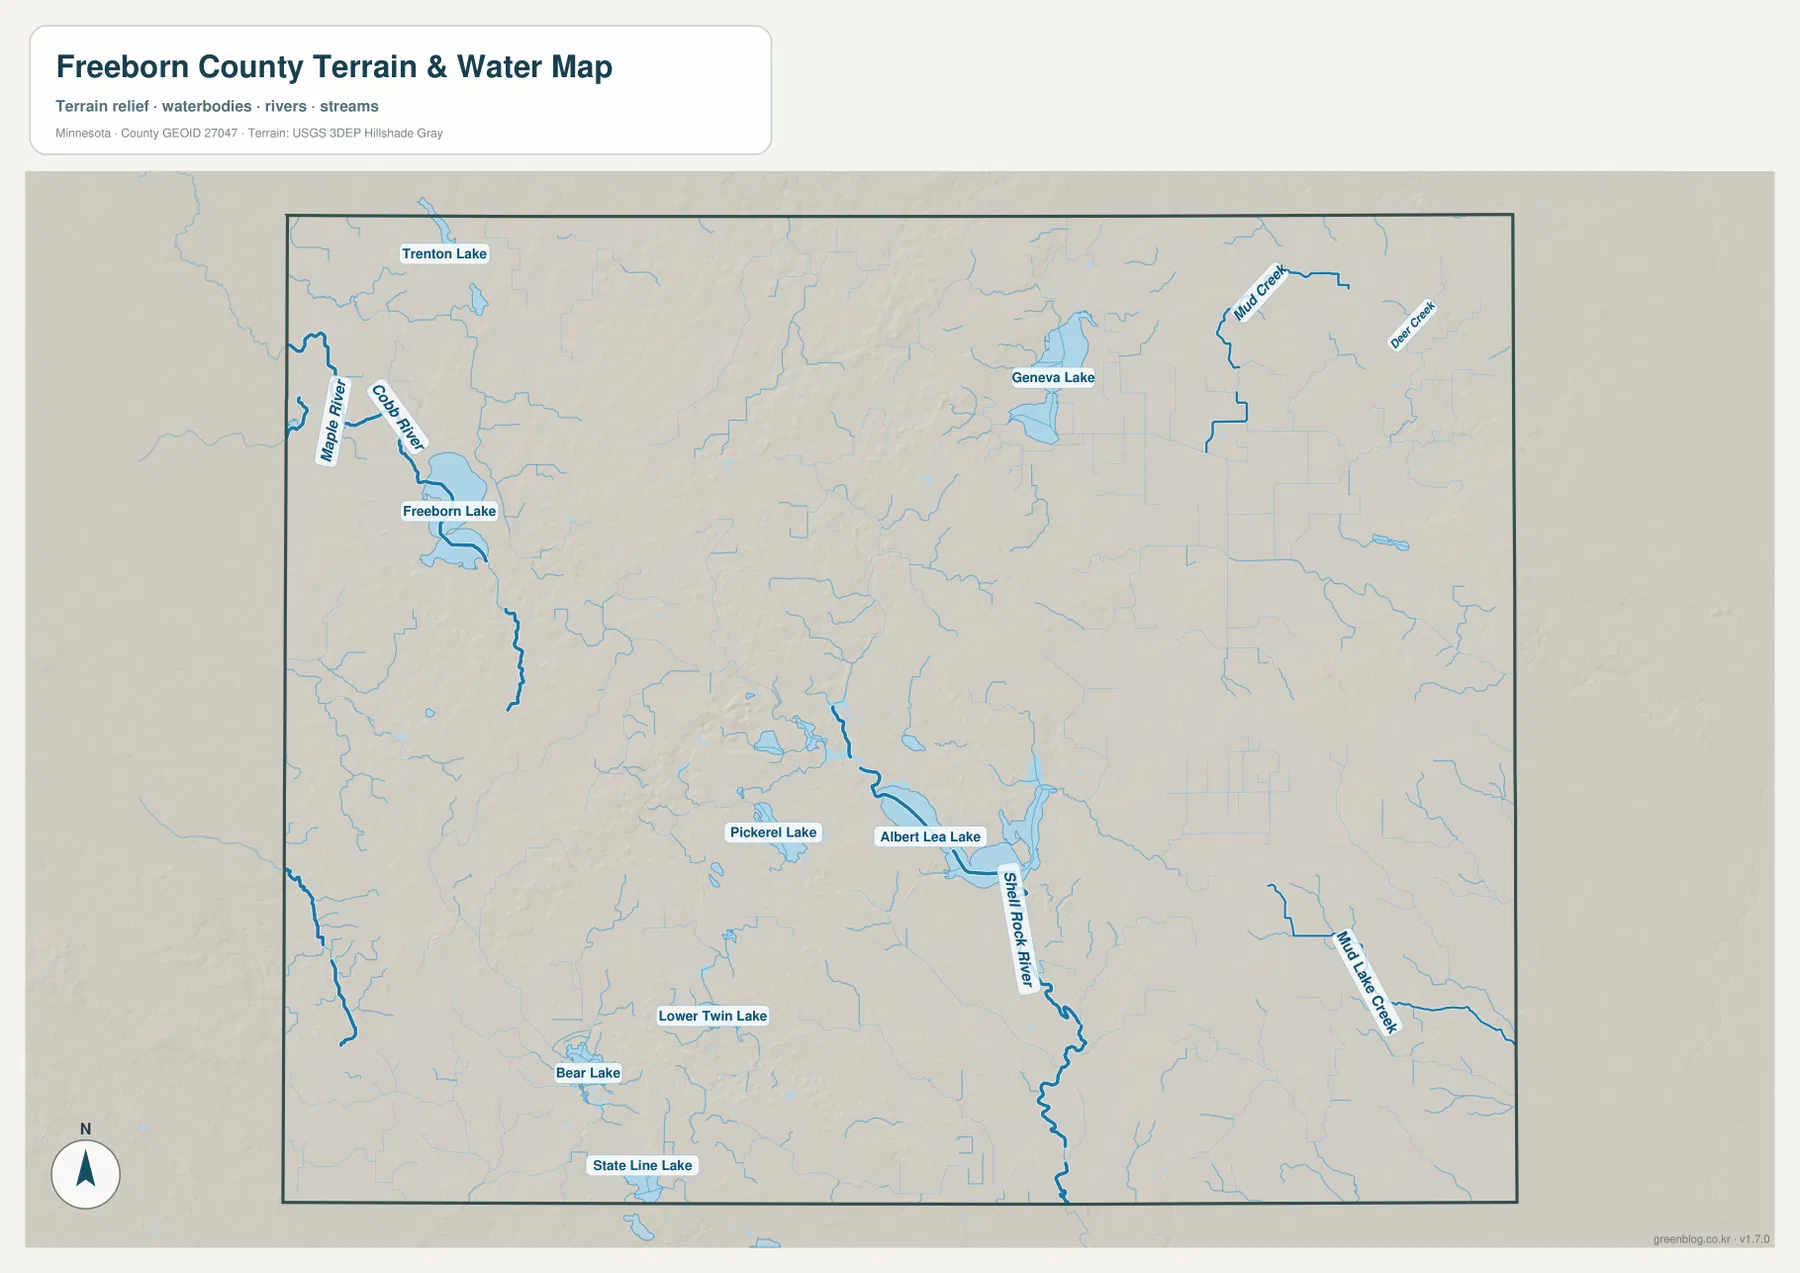
West of Albert Lea, Freeborn Lake provides another strong landmark. The Maple River and Cobb River are labeled farther northwest, and a sinuous watercourse continues south of Freeborn Lake through the rural landscape. Geneva Lake appears north of the county center, while Mill Creek and Deer Creek are labeled in the northeast. Together these features make it clear that Freeborn County is not defined by a single drainage line. The Shell Rock River is prominent, but separate western and northeastern waterways create additional local valleys and wet areas.
The southern part of the map adds Bear Lake, Lower Twin Lake, and State Line Lake toward the southwest, with Mud Lake Creek visible in the southeast. These names are helpful when relating natural features to Glenville, Twin Lakes, Emmons, and other southern communities. The map is intended for geographic reference, not for determining flood risk, water depth, navigability, water quality, or current boating conditions. Those decisions require current county or state information designed for the specific activity.
A 348–424 meter landscape of ridges, knolls, and low drainage corridors
The elevation map reports an actual county range of about 348 to 424 meters, with a mean near 381 meters. That is not a mountain-sized difference, yet the shaded relief reveals a surprisingly textured surface. Brown and tan high ground is widespread in the northwest and west-central parts of Freeborn County, with clusters of rounded hills also appearing north of Albert Lea. Large green areas mark lower terrain around the main lake basin and across parts of the eastern county.
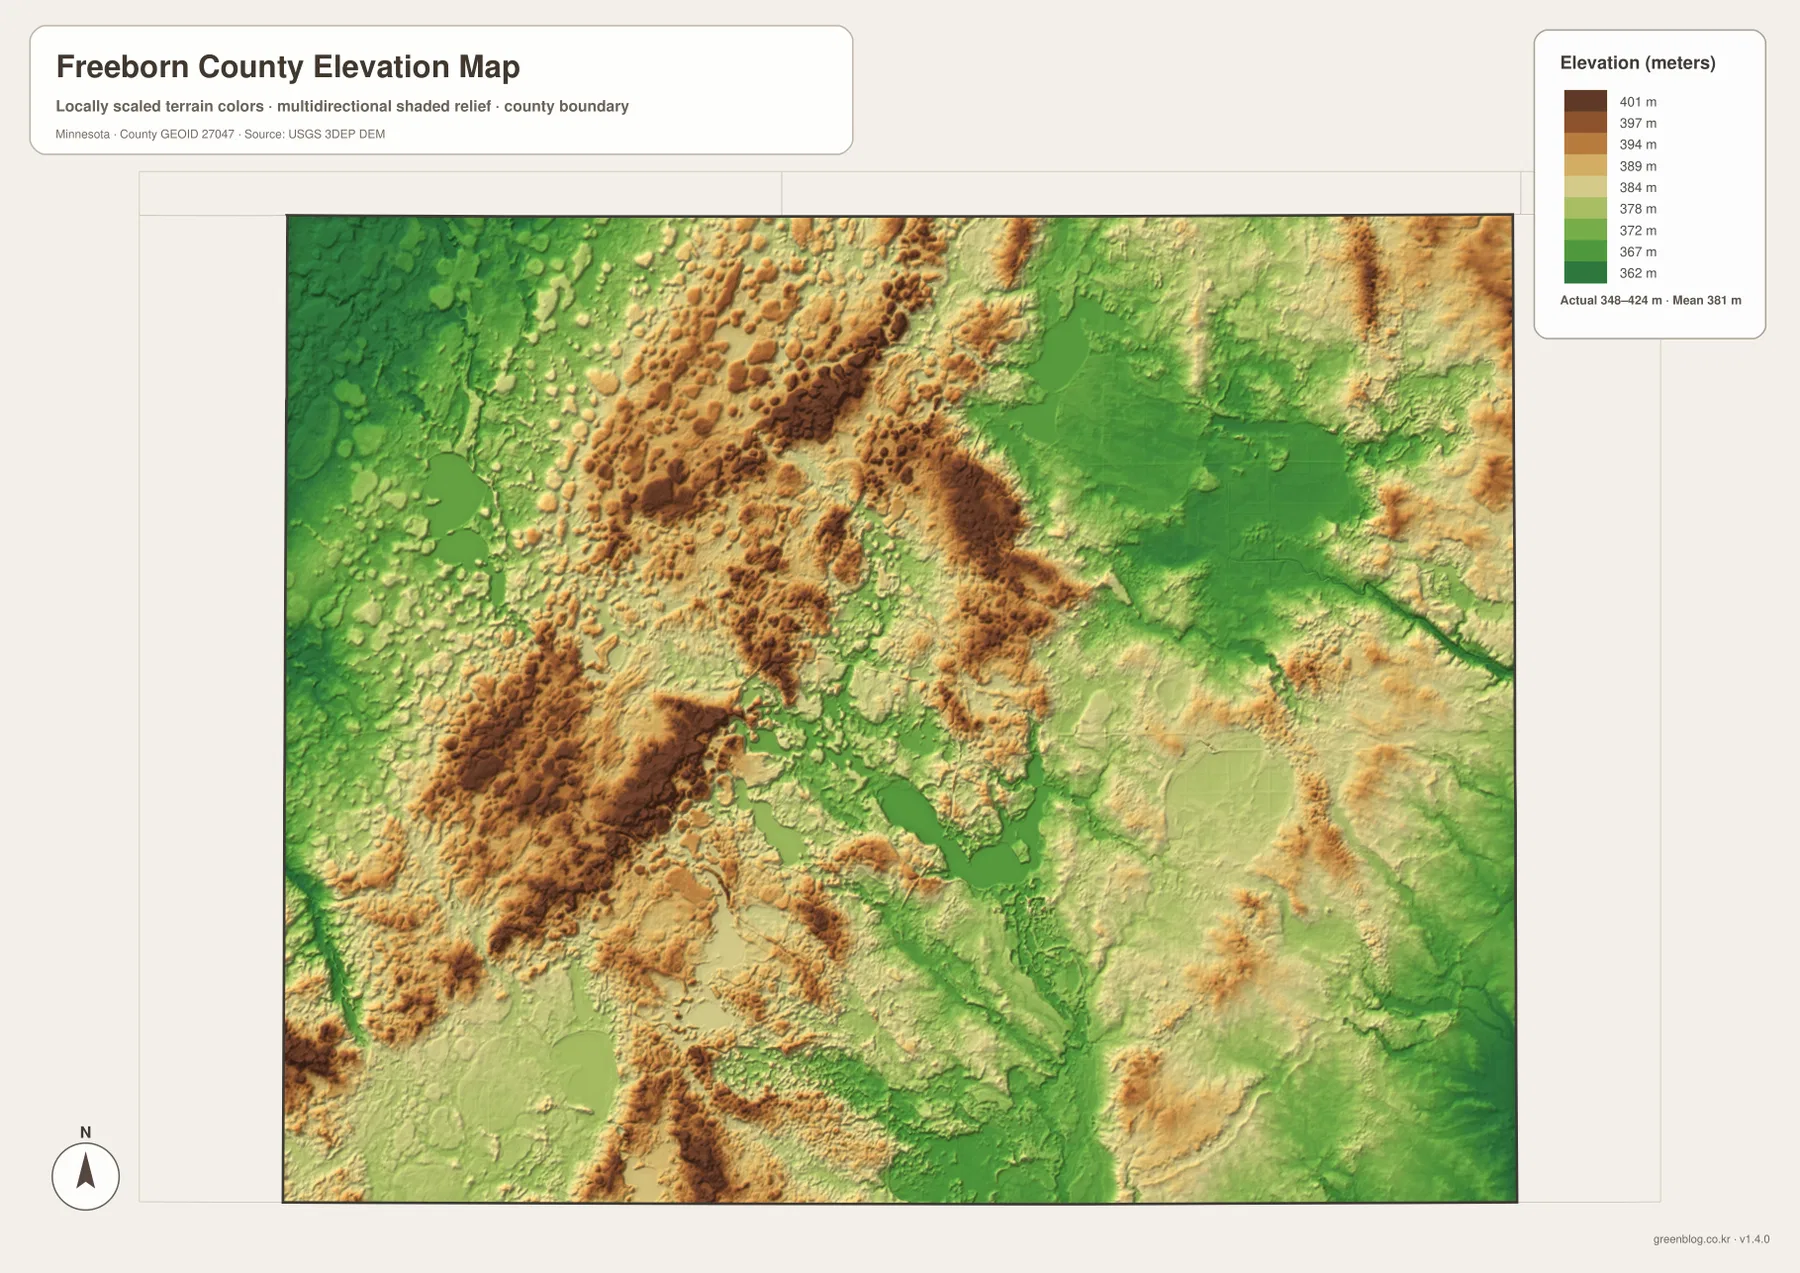
Around Albert Lea Lake, the lower basin stands out against higher ground a short distance to the west and northwest. The southwest also contains several raised areas separated by lower swales, and another elevated band appears near the northeastern edge. The Shell Rock River route toward Iowa generally follows lower terrain. Comparing the water and elevation maps side by side makes a basic physical relationship visible: many of the larger lakes and streams occupy the green, lower portions of the relief surface.
This elevation layer is a generalized countywide surface, not survey-grade measurement. It is useful for comparing broad relief, but it should not be used to determine an exact parcel elevation, design drainage, calculate a road grade, or make construction decisions. For those tasks, higher-resolution source data from the USGS 3D Elevation Program or professional survey measurements are appropriate. For a county overview, the map works well as a visual explanation of why water features and low corridors follow particular parts of the landscape.
From Freeborn Lake to the eastern lowlands
Freeborn County can look deceptively uniform on a road map because the boundary is regular and many rural routes follow straight lines. The natural maps show more contrast. Around Freeborn Lake and across the west-central county, small ridges and knolls interrupt the surface. Moving toward Albert Lea brings the landscape into a broader low basin, while farther east the terrain combines wide green lowlands with isolated higher patches. That west-to-east comparison gives the county more geographic character than a simple grid of roads would suggest.
The settlement pattern becomes more meaningful when viewed against that background. Albert Lea sits beside a major lake system where the two interstate corridors also come together. Clarks Grove and Geneva occupy the road network north of the city, Alden lies closer to the western I-90 approach, and Glenville sits between Albert Lea and the southern state line. On the city map these are just labeled points; on the other layers they can be connected to lakes, drainage corridors, and changes in relief.
Albert Lea is especially useful for comparing all four maps. It appears as the main transportation center on the general map, the largest indexed community on the city map, a settlement next to Albert Lea Lake and Pickerel Lake on the water map, and a place at the edge of a low lake basin on the elevation map. Following one familiar location across the set is often the simplest way to understand what each layer adds without mechanically describing every map feature in isolation.
Choosing the right Freeborn County map for the task
Use the general county map when roads and communities need to appear together. It is the most informative choice for locating Albert Lea, finding the I-35/I-90 junction, and seeing how Alden, Clarks Grove, Glenville, Hayward, Emmons, and other places relate to the major routes. For a slide or worksheet where the only goal is to compare community positions, the city map is cleaner because the six indexed places remain prominent without as much background detail.
The water map is the stronger choice when the subject is Albert Lea Lake, the Shell Rock River, Freeborn Lake, or the county’s smaller streams. Removing much of the transportation emphasis makes the drainage pattern easier to follow. The elevation map complements it by showing where water features occupy lower terrain and where the surrounding uplands rise. The two are particularly useful together when explaining the lower Albert Lea basin against the rougher, higher ground to the northwest.
For printing and editing, the ZIP archive contains the original 3638×2572-pixel JPG versions of all four supplied maps. A simplified city map may work best at small sizes, while the general, water, or elevation map can take advantage of a larger page where labels and terrain detail remain readable. Selecting the layer that matches the question is usually clearer than trying to place every type of information on one crowded image.
The Iowa border, neighboring counties, and local water context
The Iowa state line defines the entire southern edge of Freeborn County, making communities such as Emmons, Glenville, and Myrtle useful southern reference points. Faribault County lies to the west, Steele and Waseca counties are to the north, and Mower County borders the east. Once those surrounding areas are established, the I-35 north-south corridor and I-90 east-west corridor provide a simple frame for describing how Freeborn County connects to the rest of southern Minnesota.
Freeborn County’s official materials identify Albert Lea as the county seat and describe the I-35/I-90 intersection as a defining transportation feature. The county’s boating and water patrol information also notes regular patrol activity on Fountain Lake and responses to Albert Lea Lake and other local waters. Those administrative details are not the purpose of the map set, but they reinforce what the geography already suggests: roads, lakes, and the Albert Lea urban area are closely intertwined in this part of the county.
For a concise regional presentation, one effective approach is to begin with the general map for the road framework, then use the water and elevation maps to explain why the landscape changes around the lakes and river corridors. Add the city map only when the relative positions of the six indexed communities need to stand out. This keeps each visual focused on a specific question while preserving a consistent Freeborn County boundary across the full set.
Frequently Asked Questions
Which map is best for seeing Albert Lea together with I-35 and I-90?
The general county map is the best choice because it shows the Albert Lea built-up area, both interstate corridors, and surrounding communities on the same page. The city map is useful when you only need the relative positions of the six indexed communities and do not need highway detail.
How are Albert Lea Lake and the Shell Rock River connected on the map?
Albert Lea Lake is the large named water body in the south-central part of the county, and the Shell Rock River continues from its southern side toward Iowa. Pickerel Lake lies just to the west, with additional small waterways shown around the lake complex.
Can the 348–424 meter elevation range be used for surveying or construction?
No. The elevation map is intended to compare broad areas of higher and lower terrain across Freeborn County. Parcel surveying, drainage design, road grading, and construction require more precise source data or professional field measurements.
Map File Information
The four original high-resolution JPG maps shown in this article are available together in one ZIP file.
- Included Files: county map, city map, water map, elevation map
- Printable Size: 3638 × 2572 px for each JPG
- File Type: ZIP containing 4 JPG files
Related Maps
Sources and references
- Freeborn County official website – county administration and local information
- Freeborn County Boating/Water Patrol – local lake and waterway context
- U.S. Census Bureau TIGER/Line Shapefiles – administrative boundaries, roads, and place data
- USGS National Hydrography – rivers, streams, and water data
- USGS 3D Elevation Program – elevation data and products
Green Map creates custom-edited map images using open geographic data sources such as geoBoundaries, Natural Earth, OpenStreetMap, and government open data. These maps are edited visual materials, not raw data files, and are provided for education, documents, presentations, and graphic reference.