Fillmore County occupies a distinctive part of southeastern Minnesota where towns, roads, and river valleys fit together in very different ways from west to east. Preston sits near the middle of the county, while Spring Valley and Wykoff anchor the broader western side and Lanesboro, Rushford, and Peterson lie closer to the deeply cut Root River country in the east. The maps on this page show those settlement patterns, the county road network, the Root River and its branches, and a relief range of roughly 217 to 425 meters. High-resolution JPG versions of all four maps are also available together as a ZIP download.
A useful way to read Fillmore County is to start at Preston and then follow the landscape outward. North of Preston, the roads lead toward Fountain and Chatfield. To the west, Wykoff and Spring Valley sit in a more open-looking road pattern. East and northeast, Lanesboro and Rushford occupy narrower valley country where roads bend with the terrain. Harmony, Canton, and Mabel provide southern reference points near the Iowa side of the county. Comparing these directions makes it clear that the county is not a uniform plateau or a single river valley, but a landscape in which high ground and incised drainage alternate repeatedly.
Table of Contents
Preston as the road reference point for the county
The general county map places Preston slightly east of center, making it a practical reference point for reading the rest of the road network. U.S. 52 approaches from the north through the Fountain area and continues south toward Harmony. Route 12 heads toward Lanesboro, while other numbered roads connect Preston with the western part of the county. The pattern around Preston is more open than the winding network farther northeast, so the town works well as a visual transition between the broad uplands and the valley-dissected east.
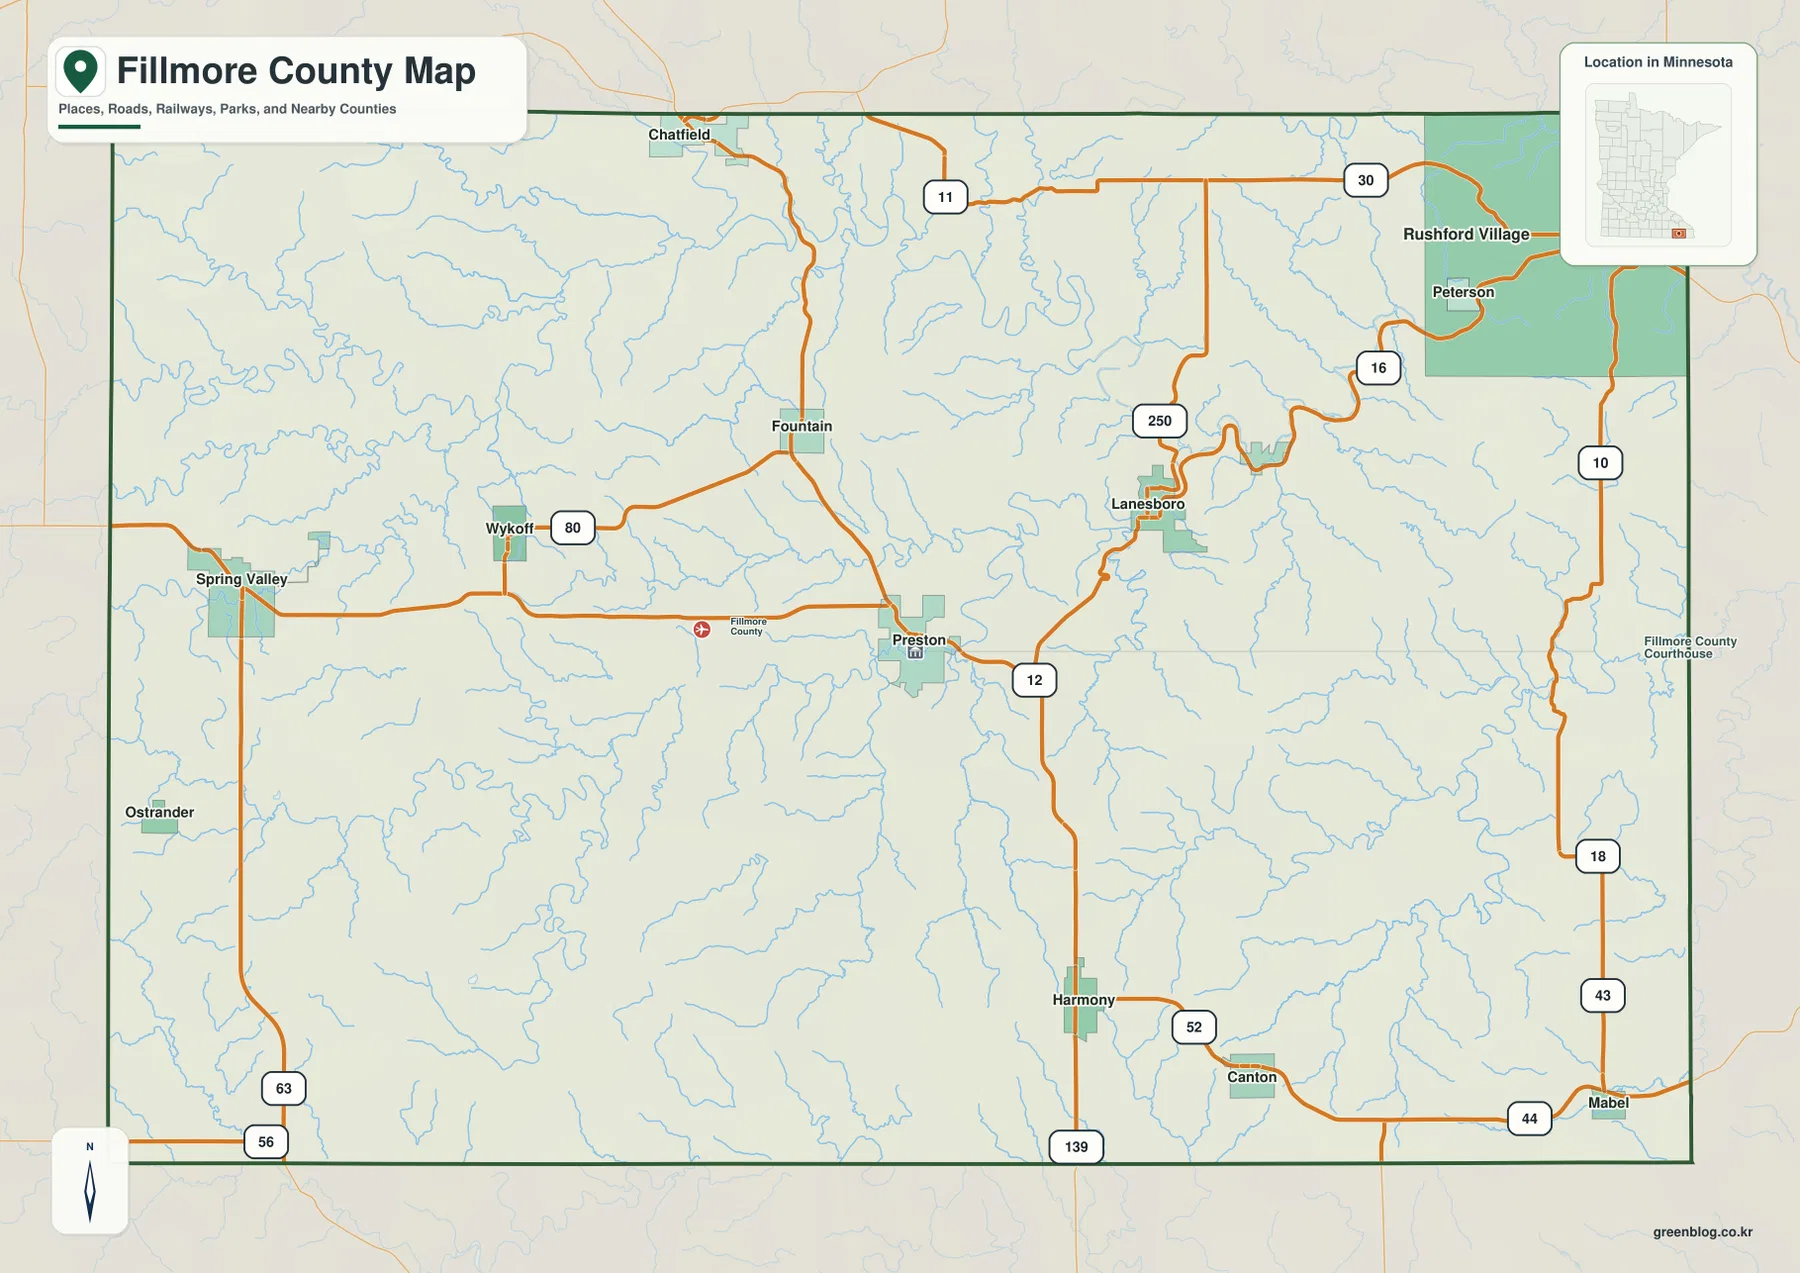
At the northern edge, Chatfield is connected eastward by Route 30 toward the Rushford Village area. Rushford and Peterson sit in the northeastern valley country, where the road pattern becomes noticeably more curved. Lanesboro lies southwest of Rushford and northeast of Preston, with Route 250 and local roads following a terrain that is much less regular than the western grid. The difference is visible even before looking at the elevation map: road geometry itself hints at the contrast between the more open west and the dissected east.
The southern half provides another set of useful anchors. Harmony lies along U.S. 52 south of Preston, Canton is farther east, and Mabel is close to the southeastern corner near Routes 43 and 44. Ostrander sits toward the southwest near Routes 63 and 56. For a classroom map or printed regional overview, locating Preston first and then adding Spring Valley to the west, Rushford to the northeast, and Harmony to the south creates a simple framework for finding the smaller communities around them.
A city pattern stretched from Chatfield to Harmony
The city map removes much of the road detail and emphasizes six selected communities: Chatfield, Spring Valley, Rushford, Preston, Harmony, and Rushford Village. Their distribution covers several parts of the county rather than forming one compact cluster. Chatfield lies near the north boundary, Spring Valley is far to the west, Preston is near the center, and Harmony is in the south. Rushford and Rushford Village are close together in the northeast, reflecting a concentration of settlement in the Root River valley area.
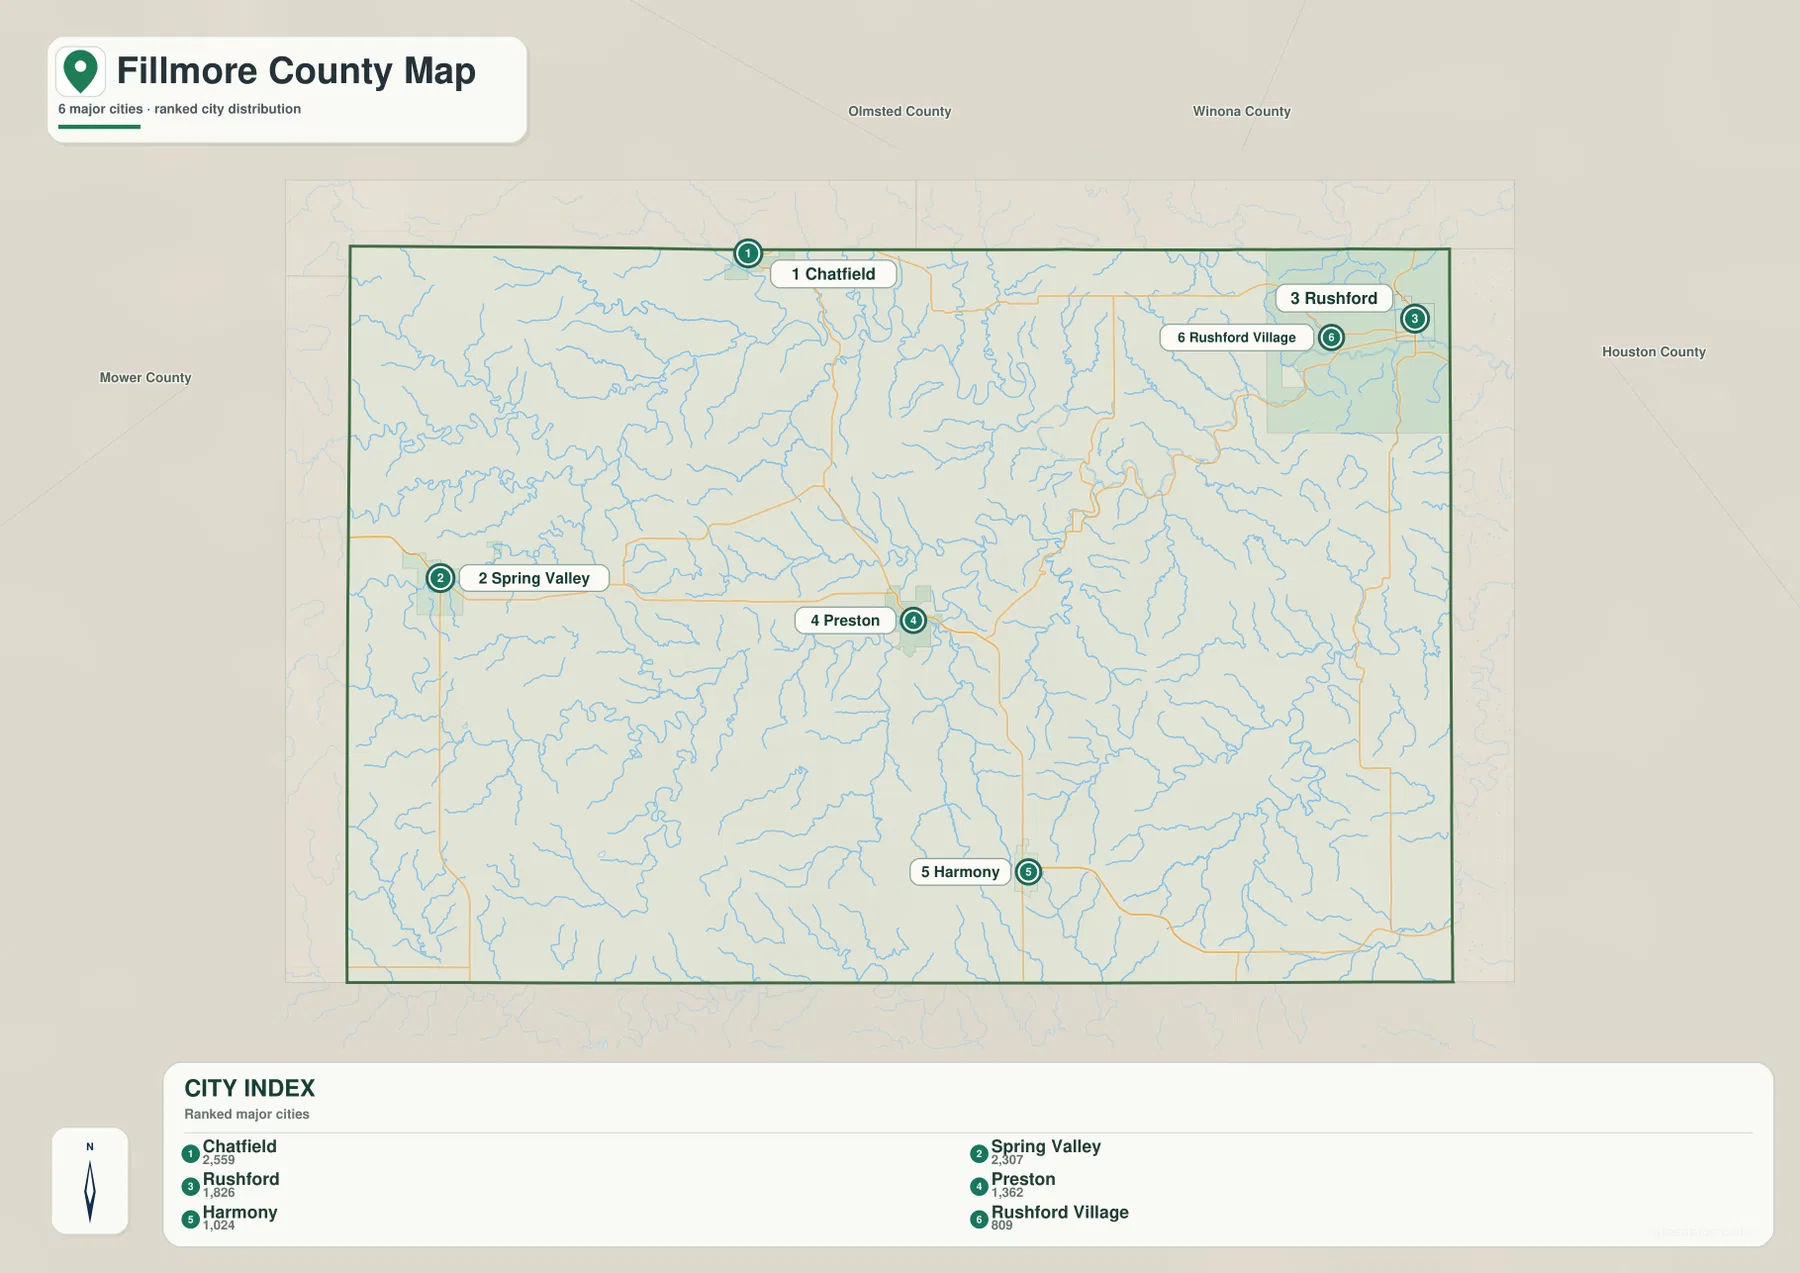
The city index printed on the map lists Chatfield at 2,559, Spring Valley at 2,307, Rushford at 1,826, Preston at 1,622, Harmony at 1,024, and Rushford Village at 809. These are values used in the map’s city index and should be treated as comparative reference figures rather than assumed to be the latest official population counts. Even so, they help explain why the map highlights these places. The two largest listed communities are not in the geographic center, while Preston remains an important central reference because of its location and road connections.
The simplified city map does not show travel distance or travel time. Straight visual separation between the markers should not be read as road mileage, especially in the northeastern valley country where roads bend around ridges and stream corridors. Preston and Harmony have a relatively direct north-south relationship on U.S. 52, while trips around Lanesboro, Rushford, and Peterson can follow much more winding routes. For route planning, the general map and current navigation information should be used with the city map rather than replaced by it.
Root River branches divide the northern and central landscape
The water map is dominated by the Root River system. The main Root River crosses the northern part of the county with a strongly sinuous course. The North Branch Root River joins that northern network, while the Middle Branch Root River approaches from farther west. The South Branch Root River occupies a broad path across the central and western parts of the county before turning eastward. Seeing the branches together reveals that the drainage is not a single east-west line but a branching set of valleys that gather water from several parts of the county.
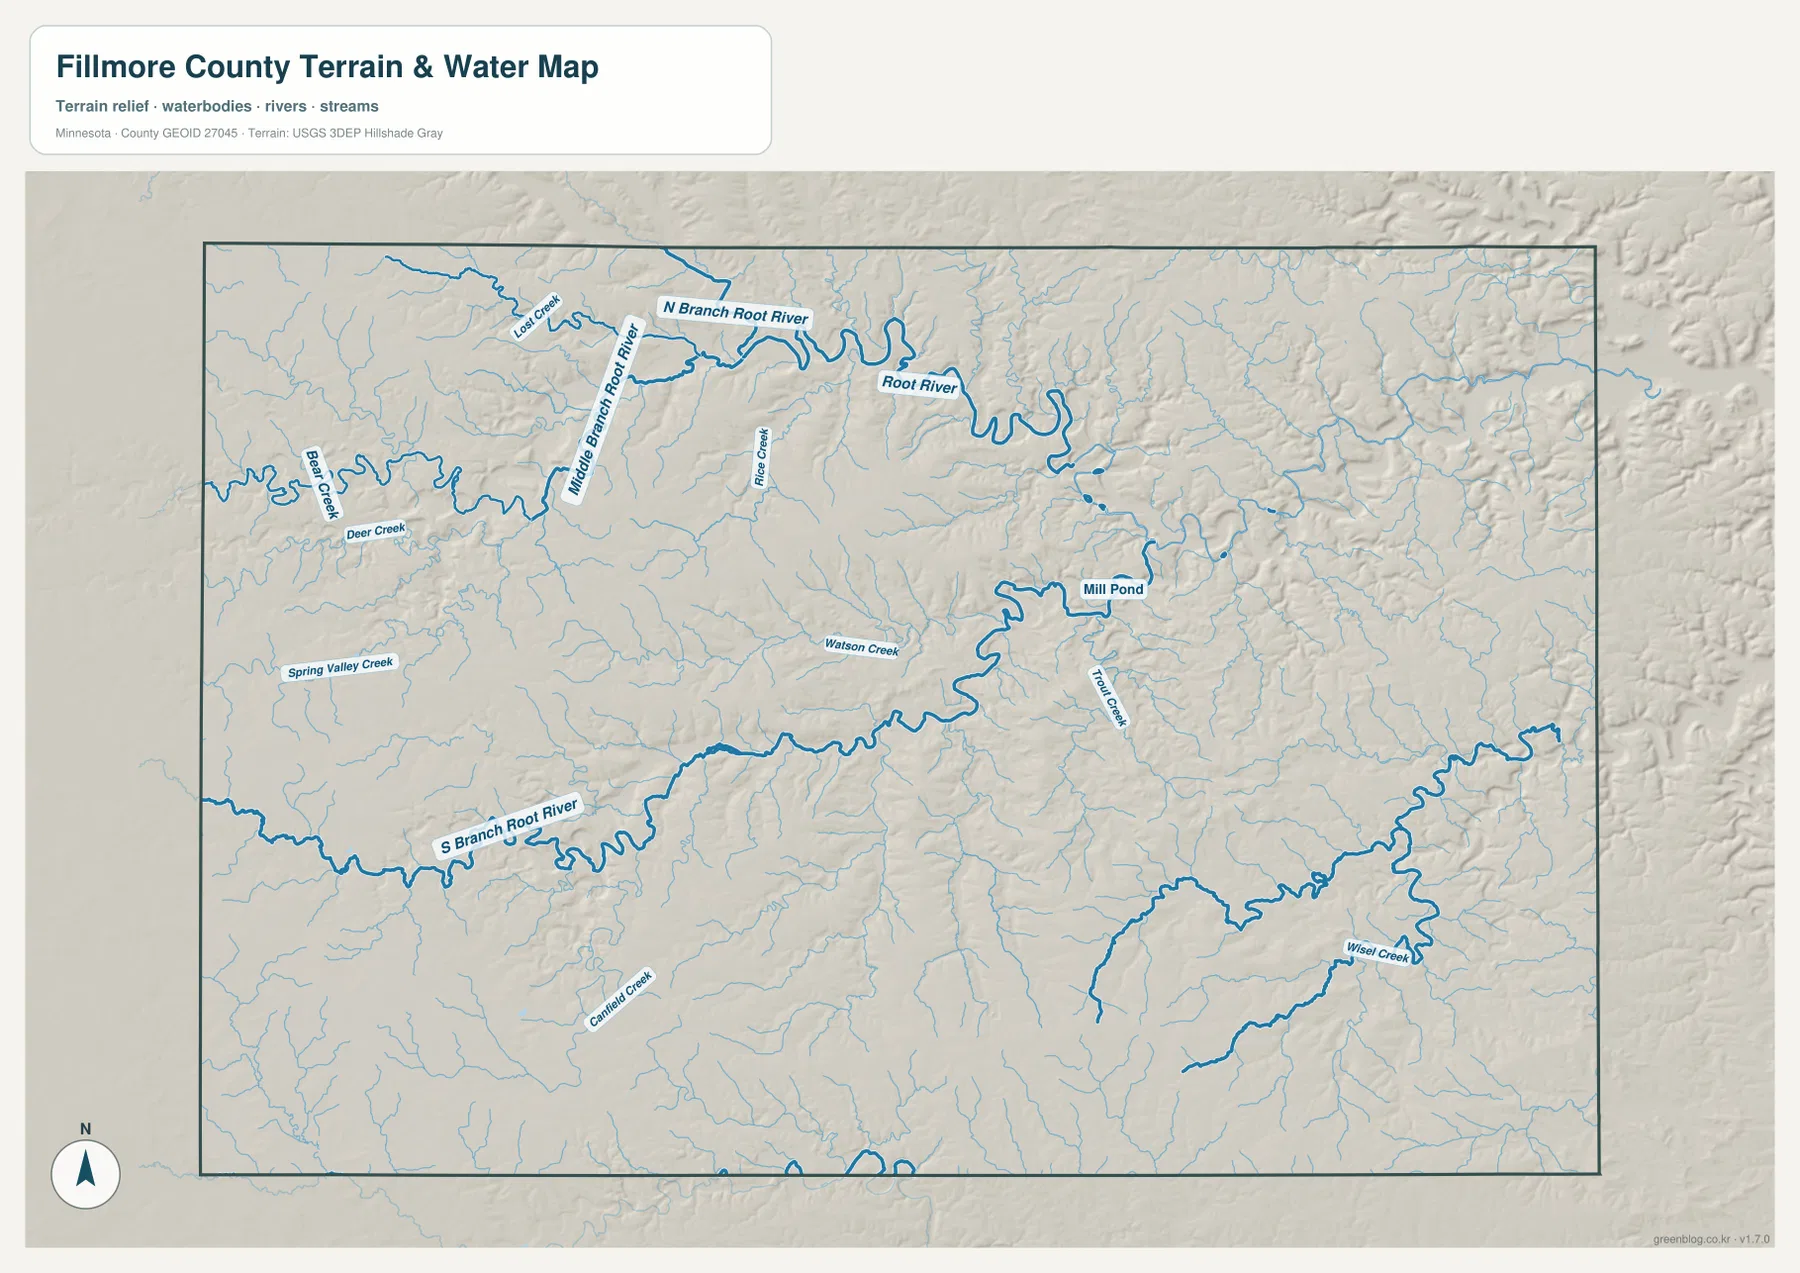
Several smaller named streams add detail to that larger pattern. Bear Creek and Deer Creek appear in the west, Spring Valley Creek runs through the western side, and Watson Creek lies closer to the central South Branch system. Trout Creek is labeled farther east, and Mill Pond appears within the eastern drainage network. Wisel Creek is shown in the southeast. These features make the county look far more dissected on the water map than on the road map, because small valleys that are visually quiet on the settlement map become the main structure of the hydrologic view.
The Root River setting also has a strong local recreational identity. The City of Preston describes the area as part of historic Bluff Country and points visitors toward the Root River State Trail and the Harmony-Preston Valley State Trail. That local context is useful when interpreting the maps, but the water map itself is only a geographic reference. It does not show current depth, velocity, flood conditions, paddling hazards, fishing regulations, or navigation status. Anyone using the river should consult current Minnesota DNR and local information before making on-the-water decisions.
A 217-425 meter relief range from uplands to entrenched valleys
The elevation map gives an actual county-scale range of about 217 to 425 meters, with a mean near 363 meters. Higher terrain is widespread in the west and southwest, where brown and tan colors cover broad areas. In contrast, the Root River valley and major tributary corridors in the northeast and east appear as dark green lowlands. Between those extremes, a dense network of lower tributary valleys cuts into higher surfaces, producing a striking branching pattern that is much harder to see on the general map.
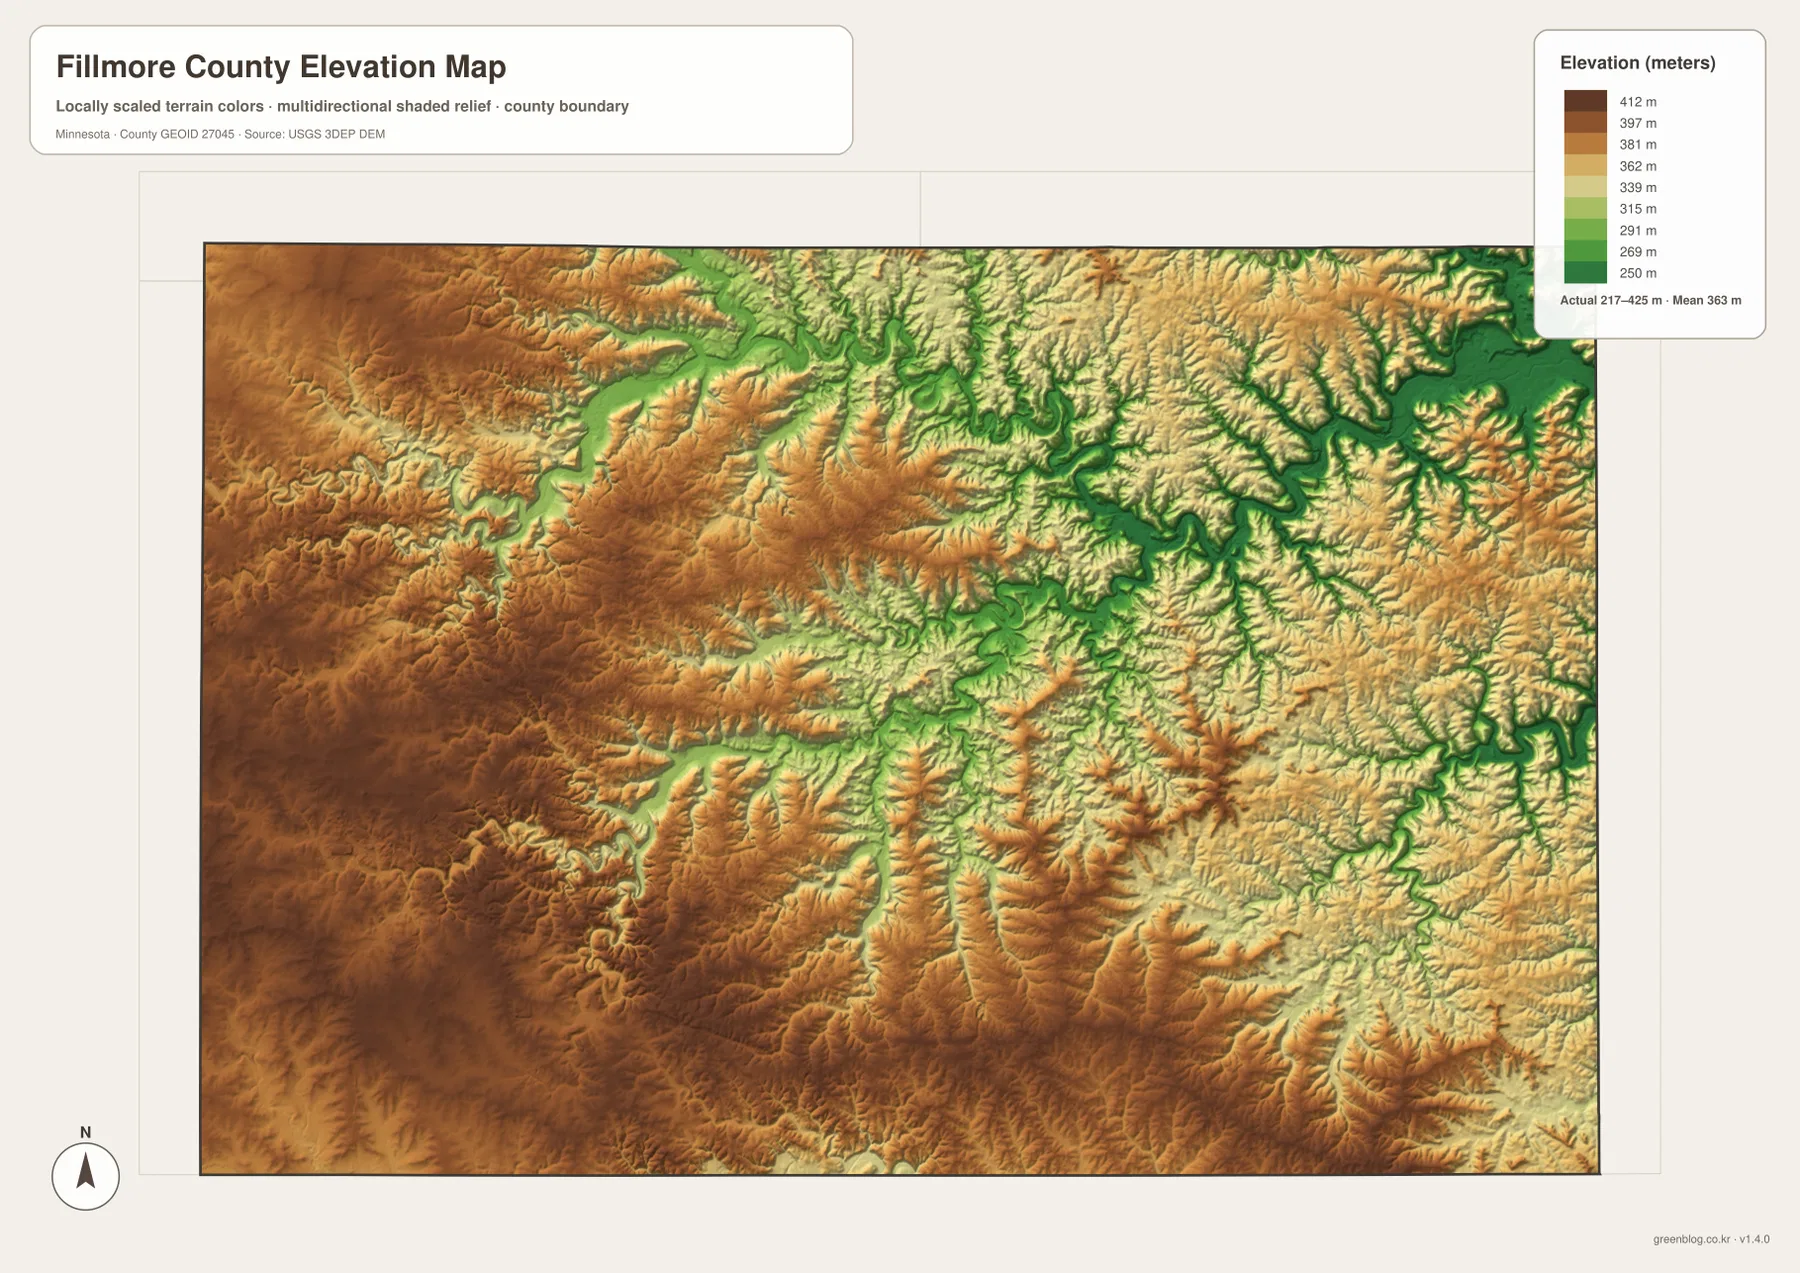
The lowest terrain follows the principal river valleys, especially in the east where the Root River system has carved a complex set of channels and side valleys. North-central parts of the county also show green corridors along stream courses, separated by higher ridges and upland surfaces. The west is higher overall but still contains narrow lower strips along smaller creeks. This explains why the landscape can feel relatively open around Spring Valley or Wykoff yet become much more enclosed and bluff-lined around Rushford, Peterson, and the Root River corridor.
This elevation map is intended for broad geographic comparison, not precise engineering or property work. It is useful for identifying which parts of the county are generally higher or lower and for connecting river valleys with relief. It should not be used to determine a parcel elevation, design drainage, calculate a road grade, or substitute for a survey. Those tasks require detailed source data such as the U.S. Geological Survey 3D Elevation Program products or professional field measurements.
From Spring Valley uplands to the Rushford valley country
The strongest county-wide contrast appears when the western and northeastern areas are compared directly. Around Spring Valley, the elevation map shows broad higher surfaces and the road network remains relatively regular. Around Rushford and Peterson, the Root River occupies a lower corridor and tributaries cut many side valleys into the surrounding higher ground. Roads respond to that topography by bending with the valleys rather than crossing the landscape in a simple grid. This difference is one of the clearest local characteristics visible across the map set.
Preston sits between these two broad settings. Westward, the terrain opens toward Wykoff and Spring Valley. Northeastward, the route toward Lanesboro enters increasingly dissected valley country. South toward Harmony, broad high ground becomes more prominent again, while the southeast around Mabel is broken by smaller valleys. As a result, describing Fillmore County simply as flat farmland or simply as bluff country would miss much of the internal variation shown by the maps.
This contrast also changes which map is most informative for a particular question. The general map is enough when the goal is to find Preston, Harmony, Chatfield, or Spring Valley and see which numbered roads connect them. The water and elevation maps become much more useful when the question is why roads curve through the eastern part of the county or why communities such as Rushford and Peterson occupy narrow corridors. Switching between the maps adds explanation without forcing every layer of information into one crowded image.
Choosing a Fillmore County map by the question you need to answer
Choose the general county map when towns, roads, and the county boundary need to appear together. It is the most useful single image for locating Preston, Spring Valley, Chatfield, Lanesboro, Harmony, Mabel, and the principal numbered routes. Choose the city map when the main task is comparing selected settlement positions without the distraction of a detailed road or stream background. Its simplified format works well for presentations and quick regional orientation.
For natural geography, the water map provides the clearest view of the Root River network and named creeks. The elevation map adds the vertical dimension, showing that many of those watercourses occupy lower terrain between higher ridges and uplands. Pairing the water and elevation maps is especially useful for explaining the northeastern valley country around Rushford and the higher western landscape around Spring Valley.
For printing, it is usually better to use the map that matches the topic rather than shrinking every layer into a single page. A road-focused handout can use the general map, while a landscape lesson can pair the water and elevation versions. The ZIP below contains the same four map types shown in the article as high-resolution JPG files, making them more suitable than the web previews for archiving, large-format viewing, or layout work.
Frequently Asked Questions
Which map is best for comparing Preston with Rushford?
The general county map is the best choice when both town location and road context matter. Preston is near the center of the county, while Rushford lies in the northeastern Root River valley area with Lanesboro between the two. If only the relative positions of selected cities are needed, the simplified city map is easier to scan.
What are the main waterways shown in Fillmore County?
The Root River and its North Branch, Middle Branch, and South Branch are the dominant named features. The map also labels smaller waterways including Bear Creek, Deer Creek, Spring Valley Creek, Watson Creek, Trout Creek, and Wisel Creek, helping show how many separate valleys feed the larger river system.
Can the 217-425 meter elevation range be used for surveying or construction?
No. The elevation map is a county-scale reference for comparing higher uplands with lower river valleys. Surveying, construction design, drainage calculations, and parcel-level elevation work require more detailed source data or professional field measurements.
Map File Information
The four high-resolution JPG maps used in this article are available together in one ZIP file.
- Included Files: county map, city map, water map, elevation map
- Printable Size: 3638 × 2572 px for each JPG
- File Type: ZIP containing 4 JPG images
Related Maps
Sources and references
- Fillmore County official website – county government and local information
- City of Preston Tourism – local Root River, Bluff Country, trail, and visitor context
- U.S. Census Bureau TIGER/Line Shapefiles – boundary, road, and place data
- USGS National Hydrography – rivers, streams, and water features
- USGS 3D Elevation Program – elevation data and products
Green Map creates custom-edited map images using open geographic data sources such as geoBoundaries, Natural Earth, OpenStreetMap, and government open data. These maps are edited visual materials, not raw data files, and are provided for education, documents, presentations, and graphic reference.