Private gross fixed capital formation takes very different shares of GDP across economies. World Bank indicator NE.GDI.FPRV.ZS supplies the most recent non-empty observation for 109 countries and territories. Across those latest observations, the median is 16.00% of GDP and the simple mean is 16.59%. Bhutan has the highest latest value at 35.54% in 2024, followed by China at 33.48% in 2023 and Belarus at 32.64% in 2013. Because the observations do not share one reference year, this is not a synchronized 2025 world ranking.
The indicator measures gross fixed capital formation by the private sector as a percentage of GDP. The World Bank description includes outlays by private nonprofit agencies as part of the private sector and defines gross fixed capital formation around acquisitions less disposals of fixed assets, along with specified expenditures that add value to non-produced assets. It is a real-economy fixed-capital measure, not a measure of purchases of stocks, bonds, or financial assets in general.
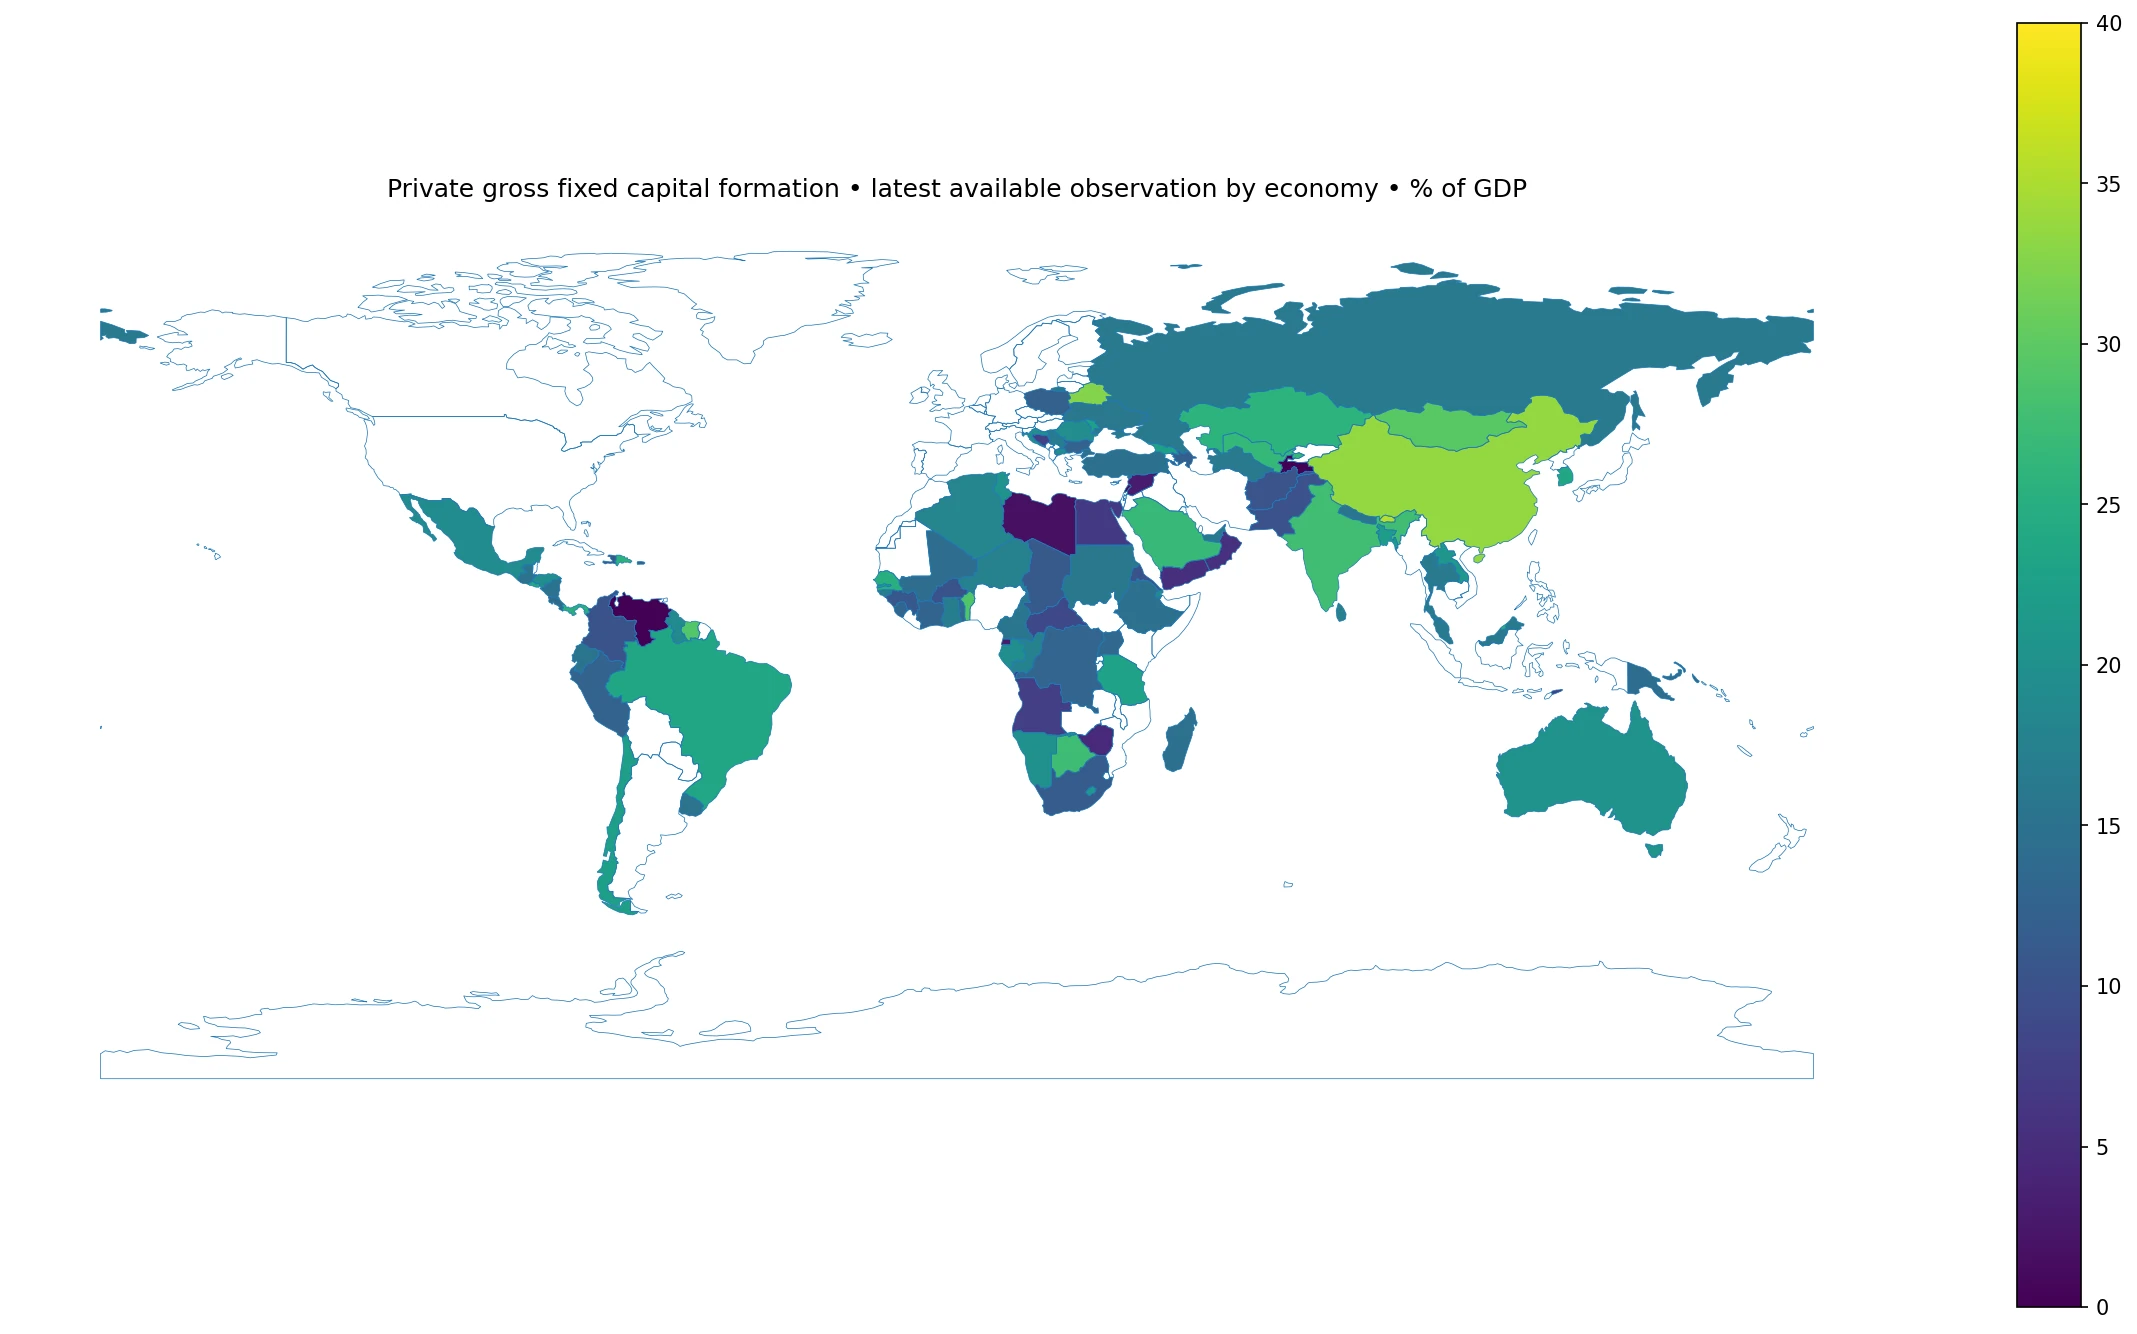
Table of Contents
The median latest observation is 16.00% of GDP
The first quartile is 11.46% and the third quartile is 22.03%, placing the middle half of economies between roughly 11.5% and 22.0% of GDP. Thirty-two observations are at least 20%, 18 are at least 25%, and 18 are below 10%. The distribution therefore spans a wide range of private fixed-capital formation intensity.
The 16.59% mean and 16.00% median are unweighted descriptive statistics across economies. They are not a World Bank estimate of the global private-investment ratio weighted by GDP. A very large economy and a small economy each contribute one country observation, so these figures summarize the country distribution rather than the world total.
The highest latest available observations
| Country or territory | Observation year | Private GFCF as % of GDP |
|---|---|---|
| Bhutan | 2024 | 35.54% |
| China | 2023 | 33.48% |
| Belarus | 2013 | 32.64% |
| Curacao | 2018 | 31.01% |
| Mongolia | 2007 | 29.54% |
| Guam | 2022 | 29.13% |
| Suriname | 2010 | 29.07% |
| Benin | 2025 | 28.97% |
| India | 2023 | 27.73% |
| Botswana | 2013 | 27.54% |
Bhutan is highest at 35.54% in 2024, followed by China at 33.48% in 2023. Belarus records 32.64% in 2013, Curaçao 31.01% in 2018, and Mongolia 29.54% in 2007. Guam is at 29.13% in 2022, Suriname 29.07% in 2010, Benin 28.97% in 2025, India 27.73% in 2023, and Botswana 27.54% in 2013.
The observation year beside each value is essential. A 2007 value for Mongolia and a 2024 value for Bhutan do not describe the same global investment environment. The table is useful for identifying notable latest available ratios, but direct contemporary comparisons are strongest when the reference years are similar.
The lowest latest available observations
| Country or territory | Observation year | Private GFCF as % of GDP |
|---|---|---|
| Tajikistan | 1999 | 0.00% |
| Venezuela, RB | 2011 | 0.00% |
| Lebanon | 2024 | 1.21% |
| Libya | 2005 | 1.63% |
| Equatorial Guinea | 2025 | 2.85% |
| Syrian Arab Republic | 2022 | 2.99% |
| Zimbabwe | 2024 | 4.53% |
| Yemen, Rep. | 2018 | 5.35% |
| Oman | 1997 | 5.50% |
| American Samoa | 2022 | 6.08% |
Tajikistan in 1999 and Venezuela in 2011 have official values of 0.00%. Lebanon records 1.21% in 2024, Libya 1.63% in 2005, Equatorial Guinea 2.85% in 2025, and the Syrian Arab Republic 2.99% in 2022. Zimbabwe is at 4.53% in 2024, Yemen 5.35% in 2018, Oman 5.50% in 1997, and American Samoa 6.08% in 2022.
The zero observations are retained as official source values and are not imputed missing data. Even so, a 0% entry should not be simplified into a claim that the private sector made literally no investment of any kind. The indicator is a national-accounts measure with a specific scope and historical context, and older observations may be especially poor descriptions of today’s economy.
Observation-year differences are central to interpreting the map
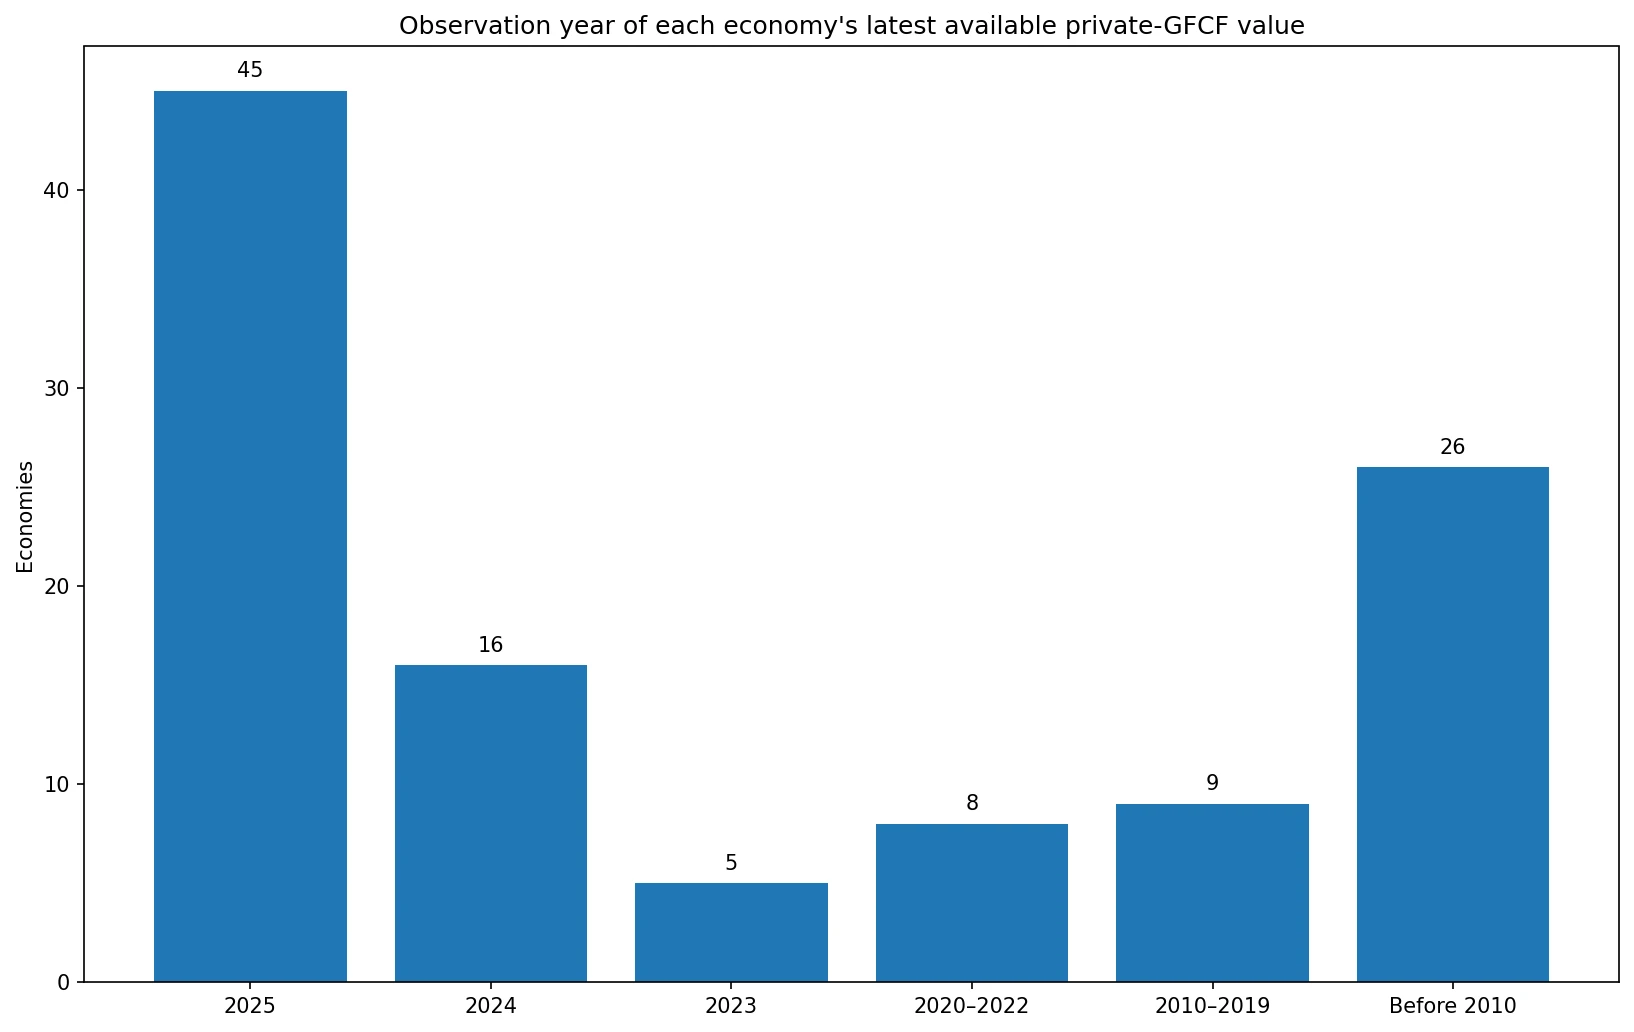
Of the 109 latest observations, 45 are from 2025, 16 from 2024, and five from 2023. Together, 66 observations—60.6%—come from 2023 through 2025. Eight are from 2020–2022, nine from 2010–2019, and 26 are from before 2010. The oldest latest observation in the dataset is from 1981.
The broad map should therefore be understood as a coverage-maximizing latest-value view. It does not compare all economies under the same interest rates, business cycle, price environment, or national-accounts vintage. The older the observation, the more cautiously it should be used as evidence about current private investment.
The 2025 subset gives a same-year comparison for 45 economies
Restricting the data to 2025 leaves 45 economies. Their median is 15.67% of GDP, the mean is 16.51%, the first quartile is 12.93%, and the third quartile is 19.89%. Values range from 2.85% to 28.97%. This same-year subset is more comparable in time, but it covers fewer economies and is not a representative sample of the world.
| Highest 2025 observations | Private GFCF as % of GDP |
|---|---|
| Benin | 28.97% |
| Saudi Arabia | 26.87% |
| Brunei Darussalam | 25.57% |
| Senegal | 25.26% |
| El Salvador | 24.11% |
Benin has the highest 2025 value at 28.97%, followed by Saudi Arabia at 26.87%, Brunei Darussalam at 25.57%, Senegal at 25.26%, and El Salvador at 24.11%. The list shows that relatively high private fixed-capital formation ratios appear in economies with very different sizes, income levels, and production structures.
| Lowest 2025 observations | Private GFCF as % of GDP |
|---|---|
| Equatorial Guinea | 2.85% |
| Egypt, Arab Rep. | 6.61% |
| Macao SAR, China | 7.30% |
| Central African Republic | 8.63% |
| Pakistan | 9.90% |
The lowest 2025 values are Equatorial Guinea at 2.85%, Egypt at 6.61%, Macao SAR China at 7.30%, Central African Republic at 8.63%, and Pakistan at 9.90%. A low ratio means private fixed-capital formation was small relative to GDP in that year; it is not by itself a score of investment quality or future growth prospects.
Private gross fixed capital formation is not the same as foreign direct investment
Private GFCF records the formation of fixed assets within the economy by the private sector. Foreign direct investment is a cross-border financial concept centered on a lasting interest or significant influence in an enterprise. Some foreign-owned firms can contribute to domestic fixed-capital formation, but the two statistics have different boundaries and accounting logic.
A high private-GFCF ratio therefore does not automatically imply large FDI inflows, and strong FDI inflows do not automatically produce a high private-GFCF share in the same period. Analysts interested in foreign capital and domestic asset formation should examine the two indicators separately rather than treating one as a substitute for the other.
The GDP denominator matters as much as the investment numerator
Because the indicator is expressed as a percentage of GDP, changes can come from the numerator, the denominator, or both. If private fixed-capital formation stays constant while GDP falls, the ratio can rise. If private investment grows but GDP grows even faster, the ratio can fall. The percentage is therefore not identical to the growth rate of private investment.
The same ratio also represents very different absolute amounts across economies. Twenty percent of GDP in a large economy can correspond to vastly more capital formation than 20% in a small economy. Questions about market size, construction volume, or machinery investment require absolute-value data in addition to this ratio.
Gross fixed capital formation is not net capital accumulation
The word ‘gross’ means capital consumption or depreciation has not been deducted. Replacement of worn-out buildings, machinery, and equipment can be part of gross fixed capital formation even when the net increase in productive capital is smaller. A high GFCF ratio therefore does not mean productive capacity increased by the same percentage of GDP.
Net capital accumulation requires information on consumption of fixed capital and, ideally, changes in the capital stock. The current indicator is best interpreted as the scale of private-sector fixed-asset formation relative to the economy during the accounting period.
The private-sector boundary includes private nonprofit agencies
The World Bank description explicitly includes private nonprofit agencies in private investment. That makes ‘private business equipment spending’ too narrow as a label. The indicator covers a broader private-sector fixed-capital concept and excludes government fixed-capital formation from the numerator.
This distinction can matter in countries where the public sector is responsible for a large share of infrastructure investment. A low private ratio can coexist with high total national investment if government capital formation is substantial. To study total investment intensity, a broader gross fixed capital formation indicator that includes all sectors is needed.
A high ratio is not automatically better
Fixed-capital formation can support future productive capacity, but more investment is not automatically more efficient or more sustainable. The quality of projects, capacity utilization, financing costs, debt, technology, and expected demand all affect the eventual return on capital. Large construction or resource projects can temporarily raise the ratio without guaranteeing higher long-run productivity.
Mature economies can also sustain high productivity with a lower investment ratio if their capital stock is already large and capital is used efficiently. The indicator is therefore descriptive: it shows private fixed-capital formation relative to GDP, not whether the investment was optimal.
Descriptive regional medians show differences but not causal rankings
Grouping the latest observations geographically gives simple medians of about 17.89% in Europe, 17.21% in North America, 16.49% in Asia, 15.41% in South America, 14.95% in Oceania, and 14.70% in Africa. These are not official World Bank regional weighted averages; each economy is counted once.
The observation years also differ across and within regions. Some European and South American values are decades old, while many African and Asian observations are from 2025. The regional medians are useful for exploratory context, but they should not be used to claim that one region currently has a definitively stronger private-investment environment.
Older latest observations may not represent today’s investment environment
Latest available means there is no later non-empty observation in this extraction, not that the observation is current. A value from 1989, 1999, or 2007 can reflect an economic structure, financial system, and national-accounts framework that has changed substantially.
For current comparisons, restricting the data to 2023–2025 or to the 2025 subset is more defensible. For broad geographic coverage, the full latest-value map is useful. The two approaches answer different questions and should not be blended without disclosing the period mismatch.
How to use the map without over-reading it
The map is most useful for locating economies with relatively high or low latest ratios and for seeing broad spatial patterns. It is less suitable for deciding which economy is a better investment destination. The indicator says nothing directly about expected returns, political risk, market access, financing conditions, or project quality.
The year-distribution chart and tables are therefore important companions to the map. They make it possible to distinguish a recent 2025 observation from an old latest value that happens to receive a similar color on the choropleth.
Data source and calculation method
The source is World Bank indicator NE.GDI.FPRV.ZS, ‘Gross fixed capital formation, private sector (% of GDP).’ The verified file contains the most recent non-empty official observation for each of 109 countries and territories. The unit is percent of GDP and the reference years span 1981 through 2025.
The median, mean, quartiles, rankings, observation-year counts, regional descriptive medians, and 2025 subset statistics are calculated directly from those 109 observations. Missing values are not filled with zero; the two published zeros are preserved. ISO3 codes are joined to a low-resolution global boundary layer, producing 96 direct polygon matches.
Frequently Asked Questions
Is private gross fixed capital formation the same as foreign direct investment?
No. GFCF measures fixed-asset formation within the economy, while foreign direct investment is a cross-border financial concept based on lasting ownership or influence.
Are all values on the map from 2025?
No. The map uses each economy's latest non-empty observation, ranging from 1981 to 2025. Forty-five economies have a 2025 value.
Does a higher ratio mean a better investment environment?
Not necessarily. The ratio describes private fixed-capital formation relative to GDP; efficiency, returns, risk, financing, and project quality require separate measures.
Related Articles
Green Map creates custom-edited map images using open geographic data sources such as geoBoundaries, Natural Earth, OpenStreetMap, and government open data. These maps are edited visual materials, not raw data files, and are provided for education, documents, presentations, and graphic reference.