Livingston County sits in southeastern Michigan’s Lower Peninsula, where Howell anchors the middle of the county while Brighton, Fowlerville, Pinckney, and Hartland occupy distinct corners of the local road network. I-96 provides the main east–west line through Fowlerville, Howell, and the Brighton area, while US-23 runs north–south along the eastern side. Between those corridors is a dense landscape of small lakes, headwater streams, rolling ridges, and residential areas. This page separates those features into four readable maps, and the high-resolution JPG originals can be downloaded together from the map box below. High-resolution map files are available for download in the section below.
The county is easiest to understand by using Howell as a central reference point. Brighton lies to the southeast near the I-96 and US-23 interchange, Fowlerville is west along I-96, Hartland is northeast near US-23, and Pinckney is south in the lake-rich interior. M-59 extends east from Howell toward Hartland, while M-36 crosses the southern part of the county through Pinckney toward the Whitmore Lake and US-23 area. The result is not a simple hub-and-spoke pattern: different parts of Livingston County orient toward different freeways, lakes, and neighboring counties.
Table of Contents
I-96 links Fowlerville, Howell, and Brighton while US-23 defines the eastern corridor
I-96 is the clearest first line to follow on the county map. It enters from the west near Fowlerville, passes south of central Howell, and continues toward Brighton before leaving the county to the east. That route places Howell and Brighton on the same broad east–west corridor even though their local street patterns and surrounding landscapes are different. Howell is positioned near the junction of I-96 and M-59, while Brighton sits closer to the I-96 and US-23 interchange, making the southeastern part of the county especially important for regional travel.
US-23 creates a second strong line on the map. It comes south from the Fenton area, passes the Hartland side of the county, crosses I-96 near Brighton, and continues toward Whitmore Lake and Ann Arbor. M-59 runs from Howell toward Hartland and meets US-23, while M-36 crosses the southern county through Pinckney before reaching the US-23 corridor. Livingston County’s current master-plan material also identifies M-36 and M-59 as important state trunklines and describes M-59 as a connection between Howell and the US-23 area.
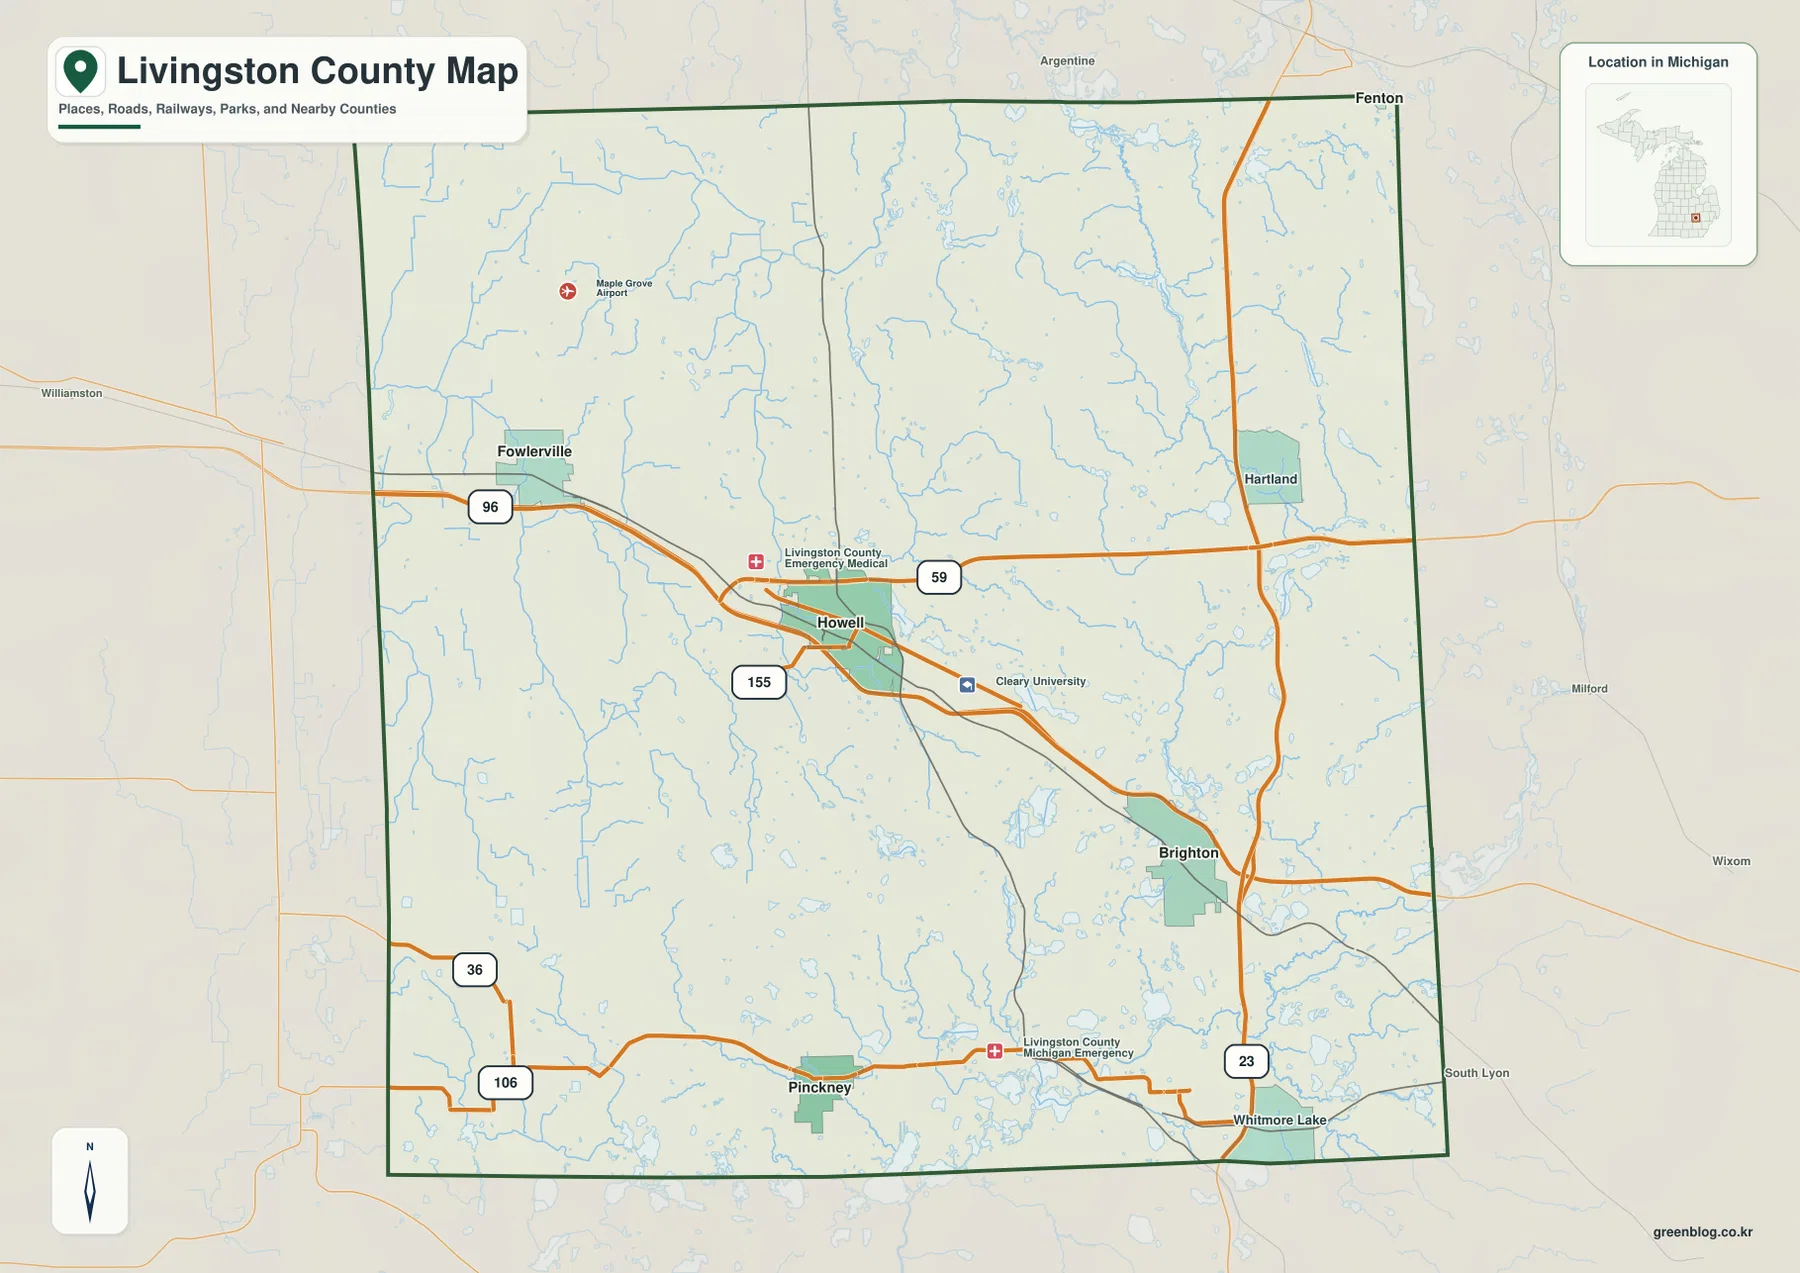
The general map is also useful for seeing how Livingston County fits among its neighbors. Shiawassee and Genesee counties lie to the north, Oakland County is to the east, Washtenaw County is to the south, and the Ingham and Jackson County directions are to the west and southwest. The map is not intended to replace an engineering road plan or live traffic service, but it works well for answering the basic geographic questions that usually come first: which city is closest to which highway, which side of the county a destination occupies, and how the principal communities relate to one another.
Howell forms the center of a four-place pattern with Brighton, Fowlerville, and Pinckney
The city-connections map simplifies the county to four labeled places, using Howell as the hub. Fowlerville is shown about 8 miles away in a straight line, Brighton about 10 miles, and Pinckney about 11 miles. Those numbers are close enough that the three destinations can look equally near to Howell, but their road access is quite different. Fowlerville lies almost directly west along I-96, Brighton is southeast on the same freeway corridor, and Pinckney requires a more southerly trip through a network of state and local roads.
The four-place layout also helps explain why Livingston County does not have one uniform development pattern. Howell and Brighton are the most prominent urban centers on these maps, yet the space between them contains Thompson Lake, Chemung Lake, smaller lakes, and dispersed residential areas. West of Howell, the landscape around Fowlerville opens into a broader rural road grid with headwater streams. South toward Pinckney, water becomes even more visible as the Portage Lake and Huron River systems approach the county line. A straight-line city diagram is therefore best used as an orientation aid rather than a substitute for a driving map.
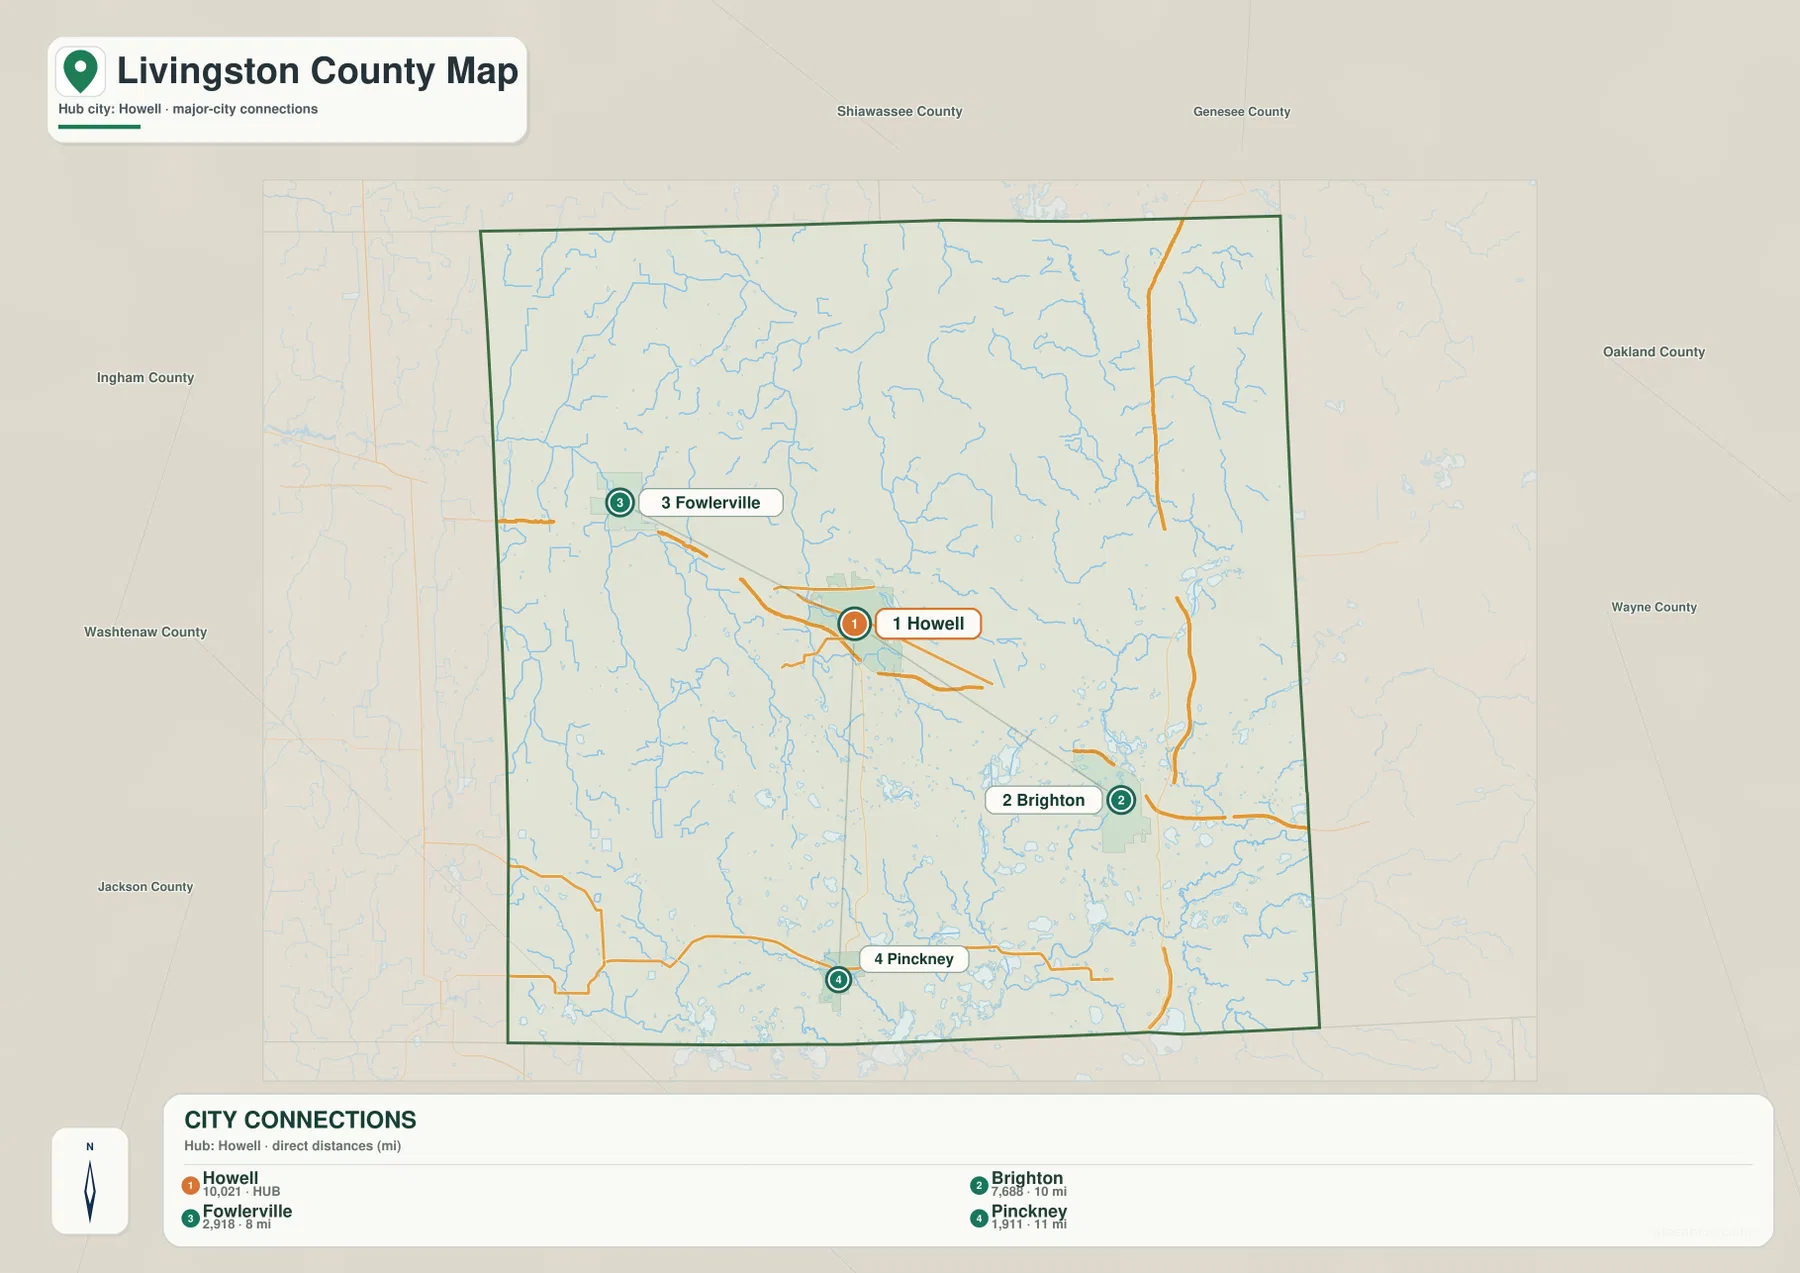
The distances on this map should not be interpreted as road mileage. A direct line does not account for freeway ramps, local street patterns, lakes, curves, or the direction in which a route must first travel. I-96 makes the Fowlerville and Brighton directions comparatively easy to visualize, while trips toward Pinckney can be less direct because southern Livingston County has more lakes and a less linear road pattern. Hartland, Whitmore Lake, and numerous township communities are not part of the four-place comparison, so the general county map remains important for a broader view.
Thompson, Chemung, and Portage lakes sit between three different headwater systems
The terrain-and-water map reveals a feature that is easy to miss on the road map: Livingston County contains several drainage directions within a relatively compact area. Thompson Lake lies beside Howell, with Chemung Lake farther east and Woodland Lake farther southeast. Near the southern edge, Portage Lake and Whitmore Lake form part of a much denser lake landscape, and the Huron River appears in the southeast. Rather than one large river valley dominating the entire county, lakes and small streams are distributed across multiple basins.
In the west, the Red Cedar River system is represented by the West Branch and Middle Branch Red Cedar River along with the main river course. Near the center-north, the South Branch Shiawassee River runs through a different drainage area, while smaller creeks occupy the northeastern part of the county. The Huron River system reaches the southeast around the lake country near Pinckney and Whitmore Lake. Seeing these waterways together helps explain why low ground and wetlands can appear in several separate parts of Livingston County instead of following one single valley from north to south.
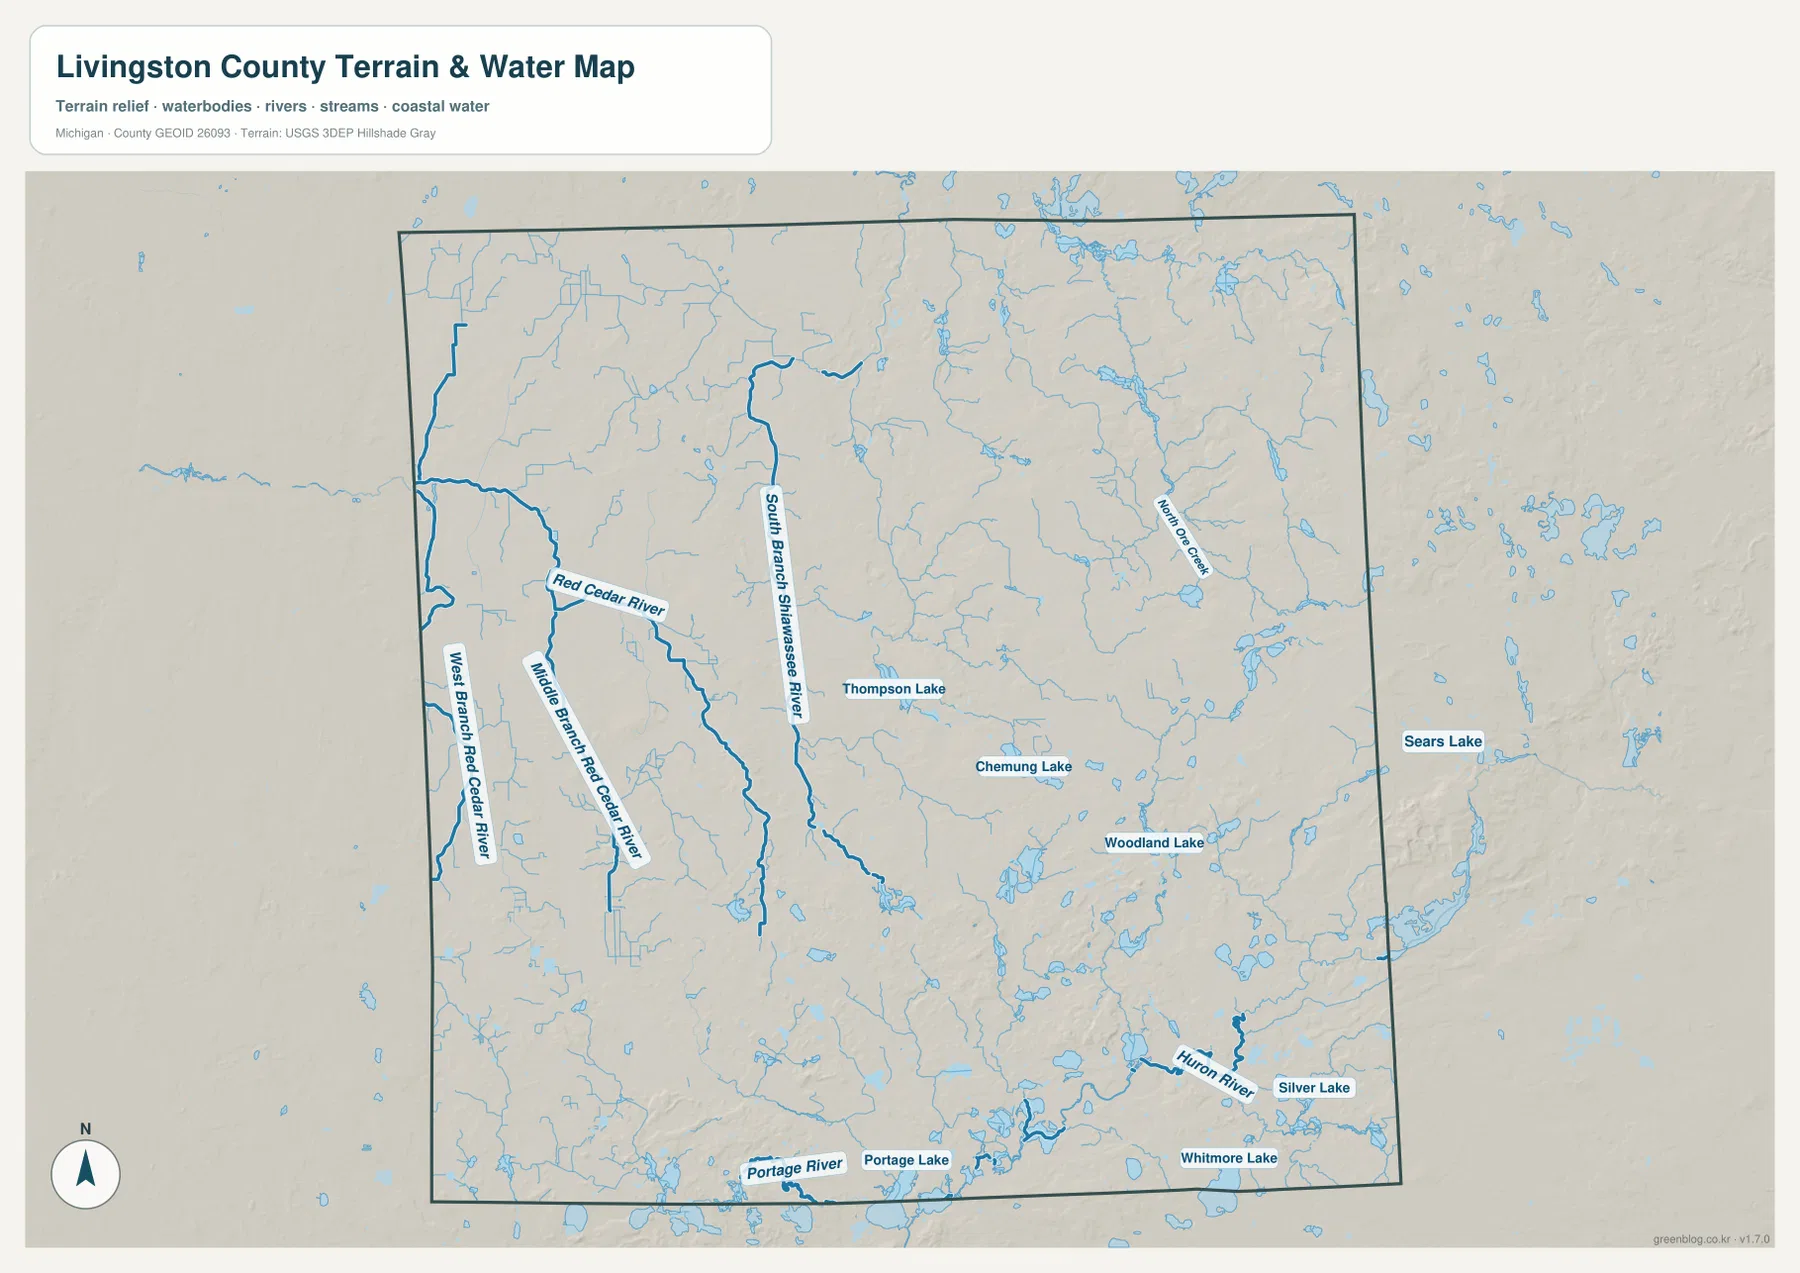
The contrast between the Howell area and the southern lake country is especially useful. Thompson Lake and Chemung Lake sit close to the central and eastern urban corridor, so water and developed areas appear side by side. Farther south, the Pinckney–Portage Lake area contains a more intricate mix of lakes, connecting streams, and low ground. In the west, the Red Cedar tributaries cross broader rural terrain. This water map is intended for geographic reference only; it does not show legal wetland boundaries, flood elevations, water depth, navigability, or parcel ownership.
Higher northeastern hills rise above lower western and southern valleys
The elevation map gives Livingston County a very different appearance from the road map. The mapped surface has an actual elevation range of roughly 254 to 371 meters, with a mean near 283 meters. The strongest brown tones occur in the northeast and along parts of the eastern side, where higher rounded hills stand out near the Hartland and Oakland County side of the map. Central Livingston County also contains many smaller ridges, so the transition from Howell toward Brighton is not a broad, completely level plain.
Lower green areas are broader in the west and appear again along river and lake corridors in the south and southeast. The Red Cedar tributaries occupy lower channels in the western part of the county, while the Huron River and lake country create another lowland pattern near the southern edge. Between those lower zones are repeated ridges and knolls, producing a rolling landscape rather than one continuous high plateau. The relief is moderate on a statewide scale, but the short-distance changes are large enough to influence where lakes, wetlands, roads, and residential areas sit.
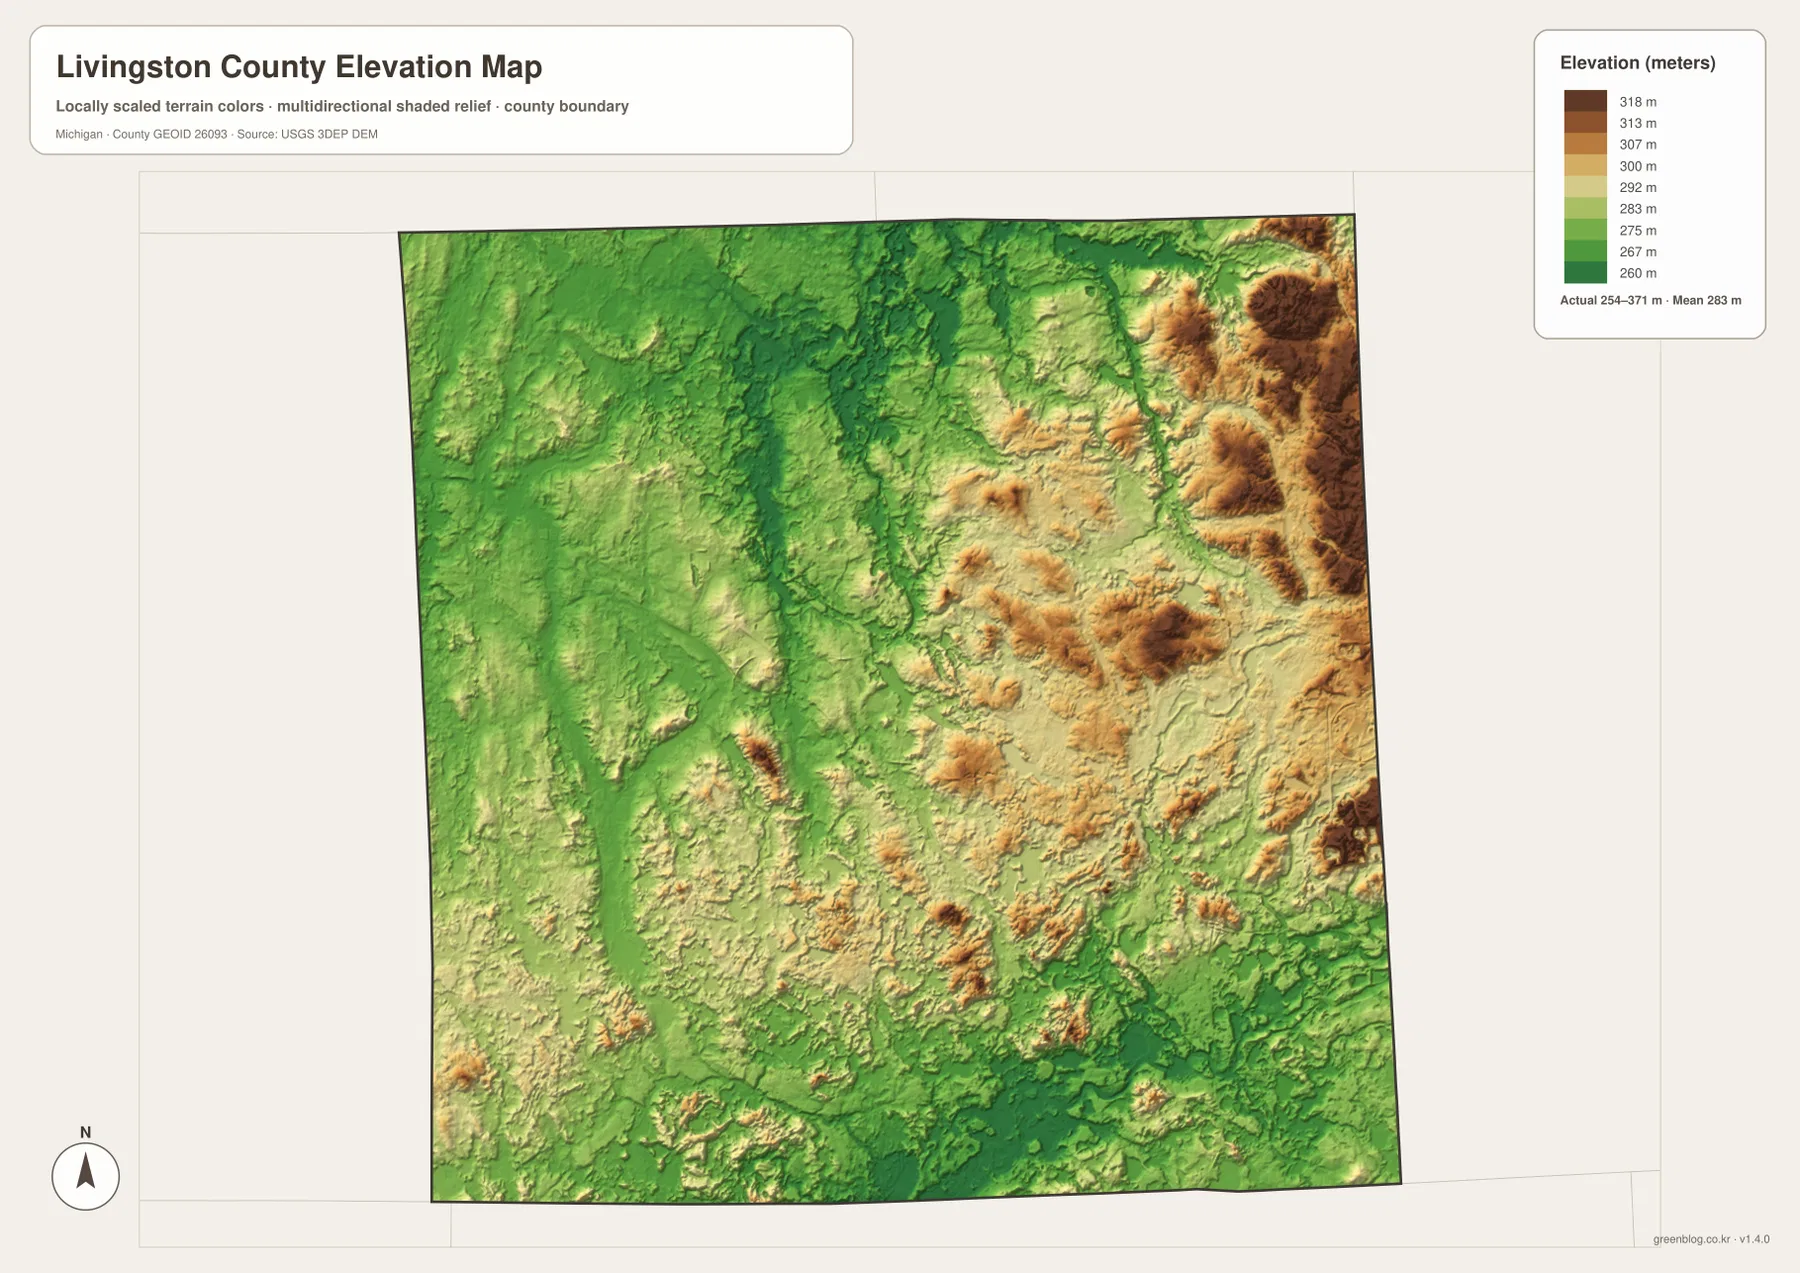
This elevation surface is generalized for county-scale comparison. It is useful for seeing which broad areas are higher or lower and for relating ridges to waterways, but it should not be used as survey-grade elevation data for a building lot, drainage design, road construction, or engineering calculation. For those tasks, the underlying USGS elevation products and site-specific surveying are the appropriate sources. For general geographic reading, however, the elevation map becomes much more informative when compared directly with the water map: many named lakes and streams occupy the lower green corridors between higher ridges.
Start with Howell, then compare roads, lakes, and relief in separate layers
A practical way to read the set is to begin at Howell on the general map. Trace I-96 west to Fowlerville and southeast to Brighton, then follow M-59 northeast toward Hartland and US-23. Next, move south to Pinckney and the M-36 corridor. That sequence establishes the principal communities and gives each side of the county a memorable road reference. The city-connections map can then be used to reduce the same geography to a simple comparison of Howell, Brighton, Fowlerville, and Pinckney.
Once the settlement pattern is clear, the water map adds the details that explain why some areas feel more fragmented. Thompson Lake and Chemung Lake show how close major water bodies are to the Howell–Brighton corridor, while Portage Lake, Whitmore Lake, and the Huron River make the south more visibly lake-oriented. The Red Cedar branches in the west and the South Branch Shiawassee River in the north-central area point in different drainage directions. Comparing those features with the elevation map shows that the county’s waterways repeatedly occupy lower corridors between rolling uplands.
Each map is therefore suited to a different task. The general county map is the best starting point for roads, boundaries, and place names. The city-connections map is useful when the goal is simply to compare the relative position of the four highlighted communities. The terrain-and-water map is better for locating named lakes and river systems, while the elevation map makes the northeast-to-west relief contrast easier to see. Keeping the themes separate prevents the smaller water and terrain features from disappearing under a dense road layer.
The WebP images embedded in the article are optimized for web viewing. For printing, large-screen presentation, classroom use, or closer inspection, use the 2572 × 3638 pixel JPG originals in the downloadable archive. The maps are suitable for general orientation and educational reference, but they are not legal boundary surveys, parcel maps, flood maps, navigation charts, or engineering elevation products. Current official sources should always be used for property, regulatory, construction, or live transportation decisions.
Frequently Asked Questions
Are the distances from Howell to Brighton, Fowlerville, and Pinckney road distances?
No. The city-connections map shows straight-line distances from Howell: about 8 miles to Fowlerville, 10 miles to Brighton, and 11 miles to Pinckney. Actual driving distance depends on the highway and local-road network, ramps, curves, and the many lakes that affect routing in southern Livingston County.
Where should I look for Thompson Lake and Chemung Lake?
Both are easiest to locate from Howell. Thompson Lake is immediately adjacent to the Howell area, while Chemung Lake lies farther east toward the Brighton side of the county. Find Howell and I-96 on the general map first, then use the water map to compare the two lakes with nearby streams and smaller water bodies.
Can the 254–371 m elevation range be used for surveying or construction?
No. The elevation map is a generalized county-scale surface designed to compare broad hills and lowlands. Exact parcel elevations, slopes, drainage grades, and construction measurements require the original USGS elevation data and, where appropriate, a professional site survey.
Map File Information
The ZIP contains high-resolution JPG originals of the Livingston County general map, city-connections map, terrain-and-water map, and elevation map. These files are larger than the WebP images displayed in the article and are better for printing or close inspection.
- Included Files: Use only the versions confirmed in the article and supplied images
- File Type: Use the confirmed download contents
- Intended Use: Printing, education, presentations, and map-based projects
Related Maps
Sources and references
- Livingston County 2026 Master Plan: official county planning material covering transportation and major state highways.
- U.S. Census Bureau QuickFacts – Livingston County, Michigan: county population, area, and basic statistics.
- U.S. Census Bureau TIGER/Line Shapefiles: reference data for county boundaries and roads.
- USGS National Hydrography: reference information for rivers, streams, and lakes.
- USGS 3D Elevation Program: elevation-data reference.
Green Map creates custom-edited map images using open geographic data sources such as geoBoundaries, Natural Earth, OpenStreetMap, and government open data. These maps are edited visual materials, not raw data files, and are provided for education, documents, presentations, and graphic reference.