Rockdale County is almost evenly divided between forest and developed land. Forest covers 42.09% of the supplied 2025 classification, while developed land reaches 41.15%. Conyers and the central-southern suburbs form a broad built footprint, but the north retains much more forest and farmland. This Rockdale County Georgia Land Cover Map shows how Metro Atlanta growth and greener outer areas fit inside one compact county.
The page includes four WebP views for current land cover, vegetation, impervious surface, and the 1985–2025 endpoint comparison. Four original 2480 × 1754 JPG maps are available in one ZIP for county profiles, growth analysis, lessons, and presentations.
Table of Contents
Conyers and the I-20 side form a broad suburban hard-surface core
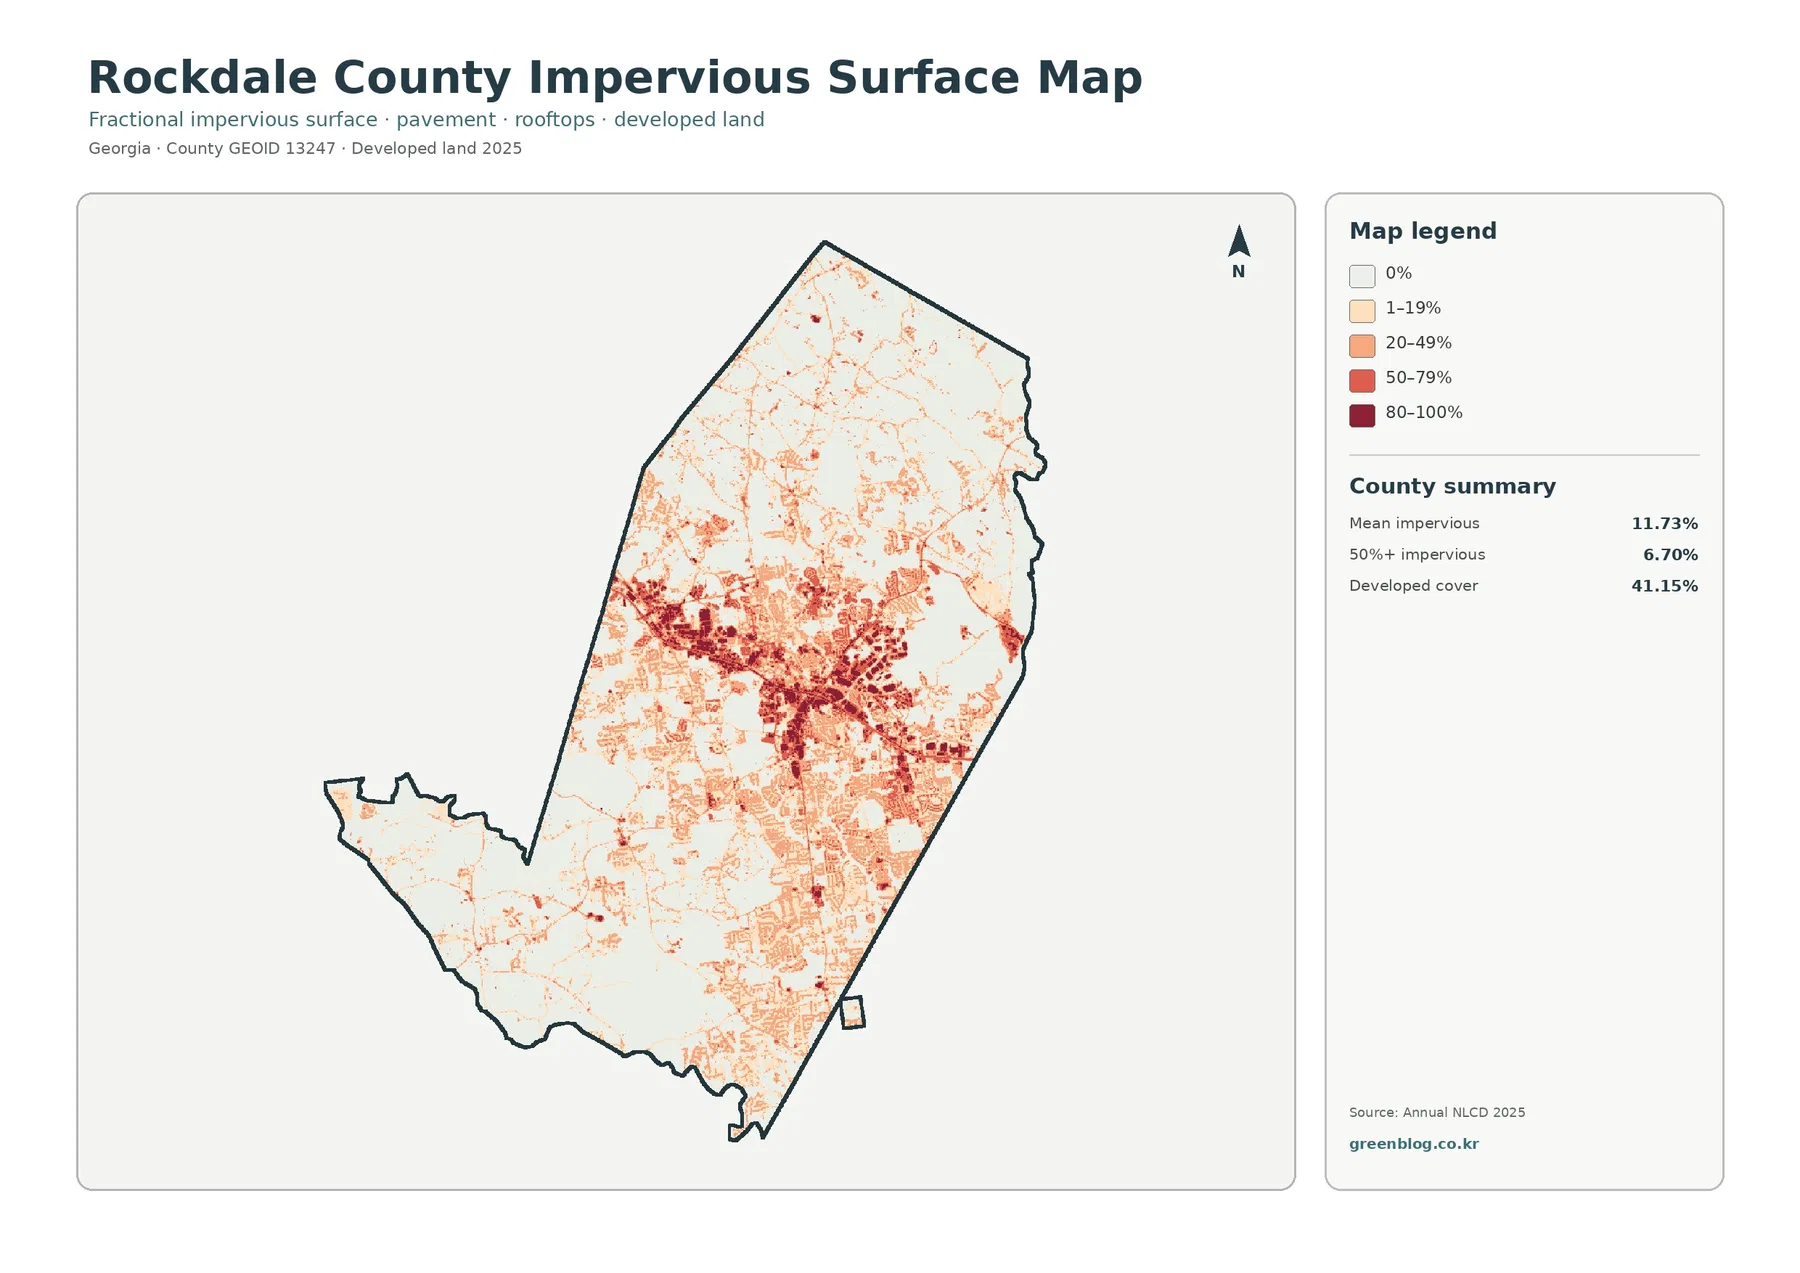
The strongest hard-surface area spans the center and southeast rather than appearing as one small downtown. Dense impervious cells form a west-east band and branch through large residential and commercial areas. Rockdale County’s transportation planning has long treated access to I-20 and cross-county connectivity as major priorities, giving that broad corridor a useful official context.
Conyers’ 2023 comprehensive plan also frames the city within continued Metro Atlanta growth. The map reflects a city whose built footprint extends into surrounding suburban neighborhoods and activity areas. Development is therefore better understood as a connected central county pattern than as a single compact municipal center.
Mean impervious cover is 11.73%, and 6.70% of Rockdale County reaches 50% impervious surface or higher. Developed land is much broader at 41.15% because developed classes can include yards, trees, lawns, and exposed soil as well as roofs and pavement.
Forest remains slightly larger than developed land countywide
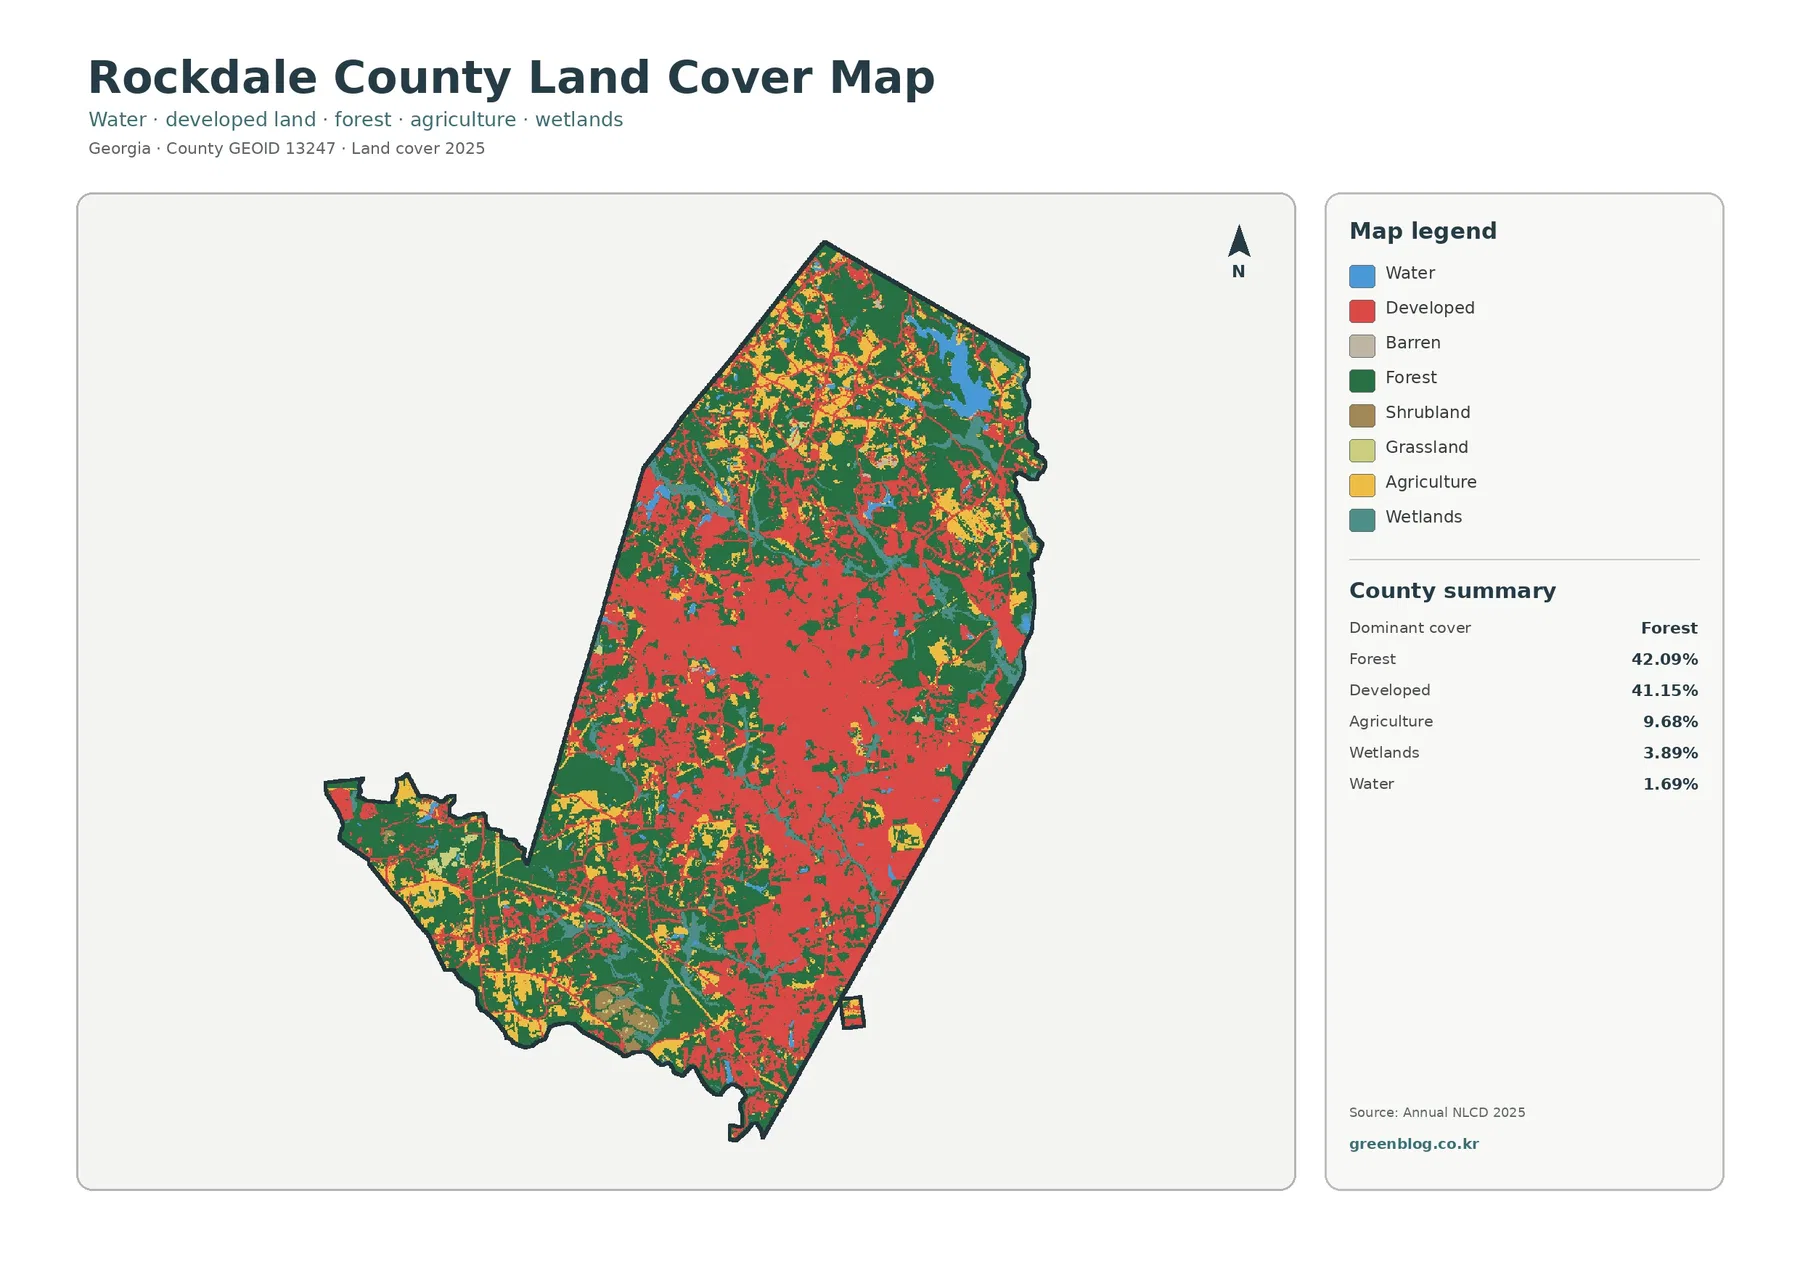
Forest is the largest class at 42.09%, but only narrowly. The broadest dark-green areas occur across the north and northeast and in the southwestern extension of the county. Smaller forest blocks remain throughout the built center, breaking up residential and road networks rather than disappearing completely.
Developed land follows at 41.15%. Red cover dominates much of the central and southeastern county and reaches outward through road-oriented residential patterns. The near tie between forest and developed land is one of Rockdale County’s most distinctive statistics: neither a purely urban description nor a purely wooded description captures the whole map.
Agriculture accounts for 9.68%, wetlands 3.89%, and open water 1.69%. Farm cover is most noticeable in the north and northwest, with smaller pockets elsewhere. Wetlands and water occupy limited total area, but a large northeastern reservoir creates a strong local feature.
The northern county has a more rural mix of woods, farms, and low-density settlement
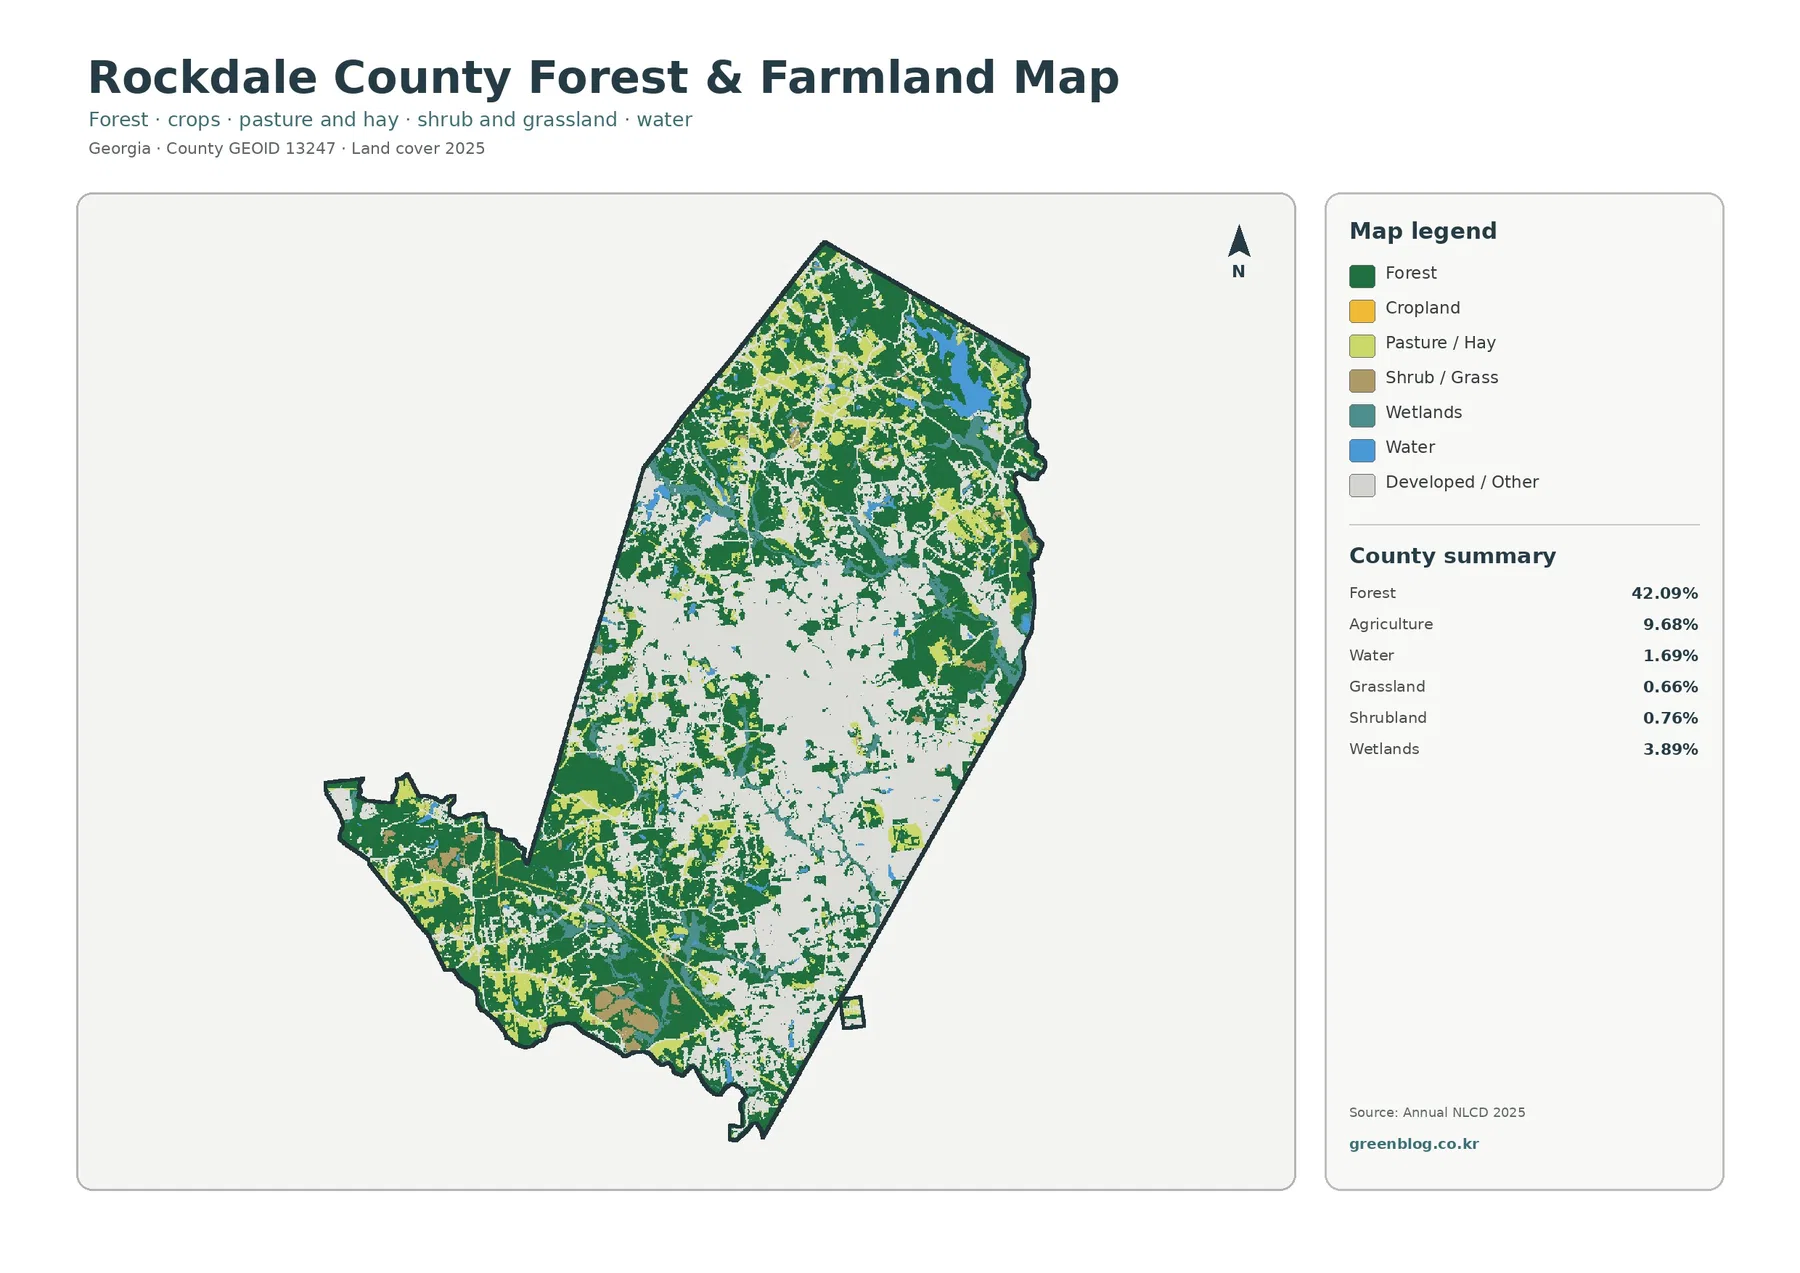
When developed cover is muted, the north looks markedly different from central Conyers. Forest fills large areas, yellow farm blocks become easier to see, and the remaining built or other surfaces break into smaller pieces. The southwestern extension also retains substantial woodland and rural open land.
Rockdale County’s 2023 comprehensive plan describes an Estate Residential area north of Conyers where rural residential and agricultural-residential character remain important. It also notes a notable concentration of granite outcrops in that character area. The land-cover raster is not a geology map, but the plan confirms that the northern county has a distinct rural and open-space identity.
UGA Extension Rockdale County serves farmers, homeowners, gardeners, and businesses with soil and water testing, plant and insect diagnosis, and agriculture and horticulture guidance. That range fits a county where farm land, suburban yards, and forest edges all occur close together.
Black Shoals adds a large water-and-forest feature to the northeast
A large blue water body stands out near the northeastern edge. Rockdale County’s Parks and Trails page identifies Randy Poynter Lake at Black Shoals Park as a 650-acre lake, providing a verified local reference for this part of the county. The surrounding map is much more wooded than central Conyers.
Water is only 1.69% countywide, so the reservoir has an outsized visual effect compared with its total share. Forest and wetlands around the lake create a useful contrast with the dense developed cover farther south. Exact park and reservoir boundaries, however, should come from official recreation mapping rather than the generalized land-cover pixels.
The impervious map separates suburban density from the broader developed class
The 41.15% developed statistic can make Rockdale County sound almost fully urban, but the impervious map adds an important distinction. Many developed cells contain substantial lawn, tree, or yard cover, so only a smaller portion reaches the darkest hard-surface categories.
High impervious values are concentrated around the main commercial and transportation corridors, while northern residential and rural areas are much lighter. This map is therefore better than the general developed class for comparing pavement intensity, though it is not a flood-risk model. Drainage also depends on terrain, streams, soils, rainfall, and infrastructure.
The 1985–2025 comparison records 17.90% classified to developed
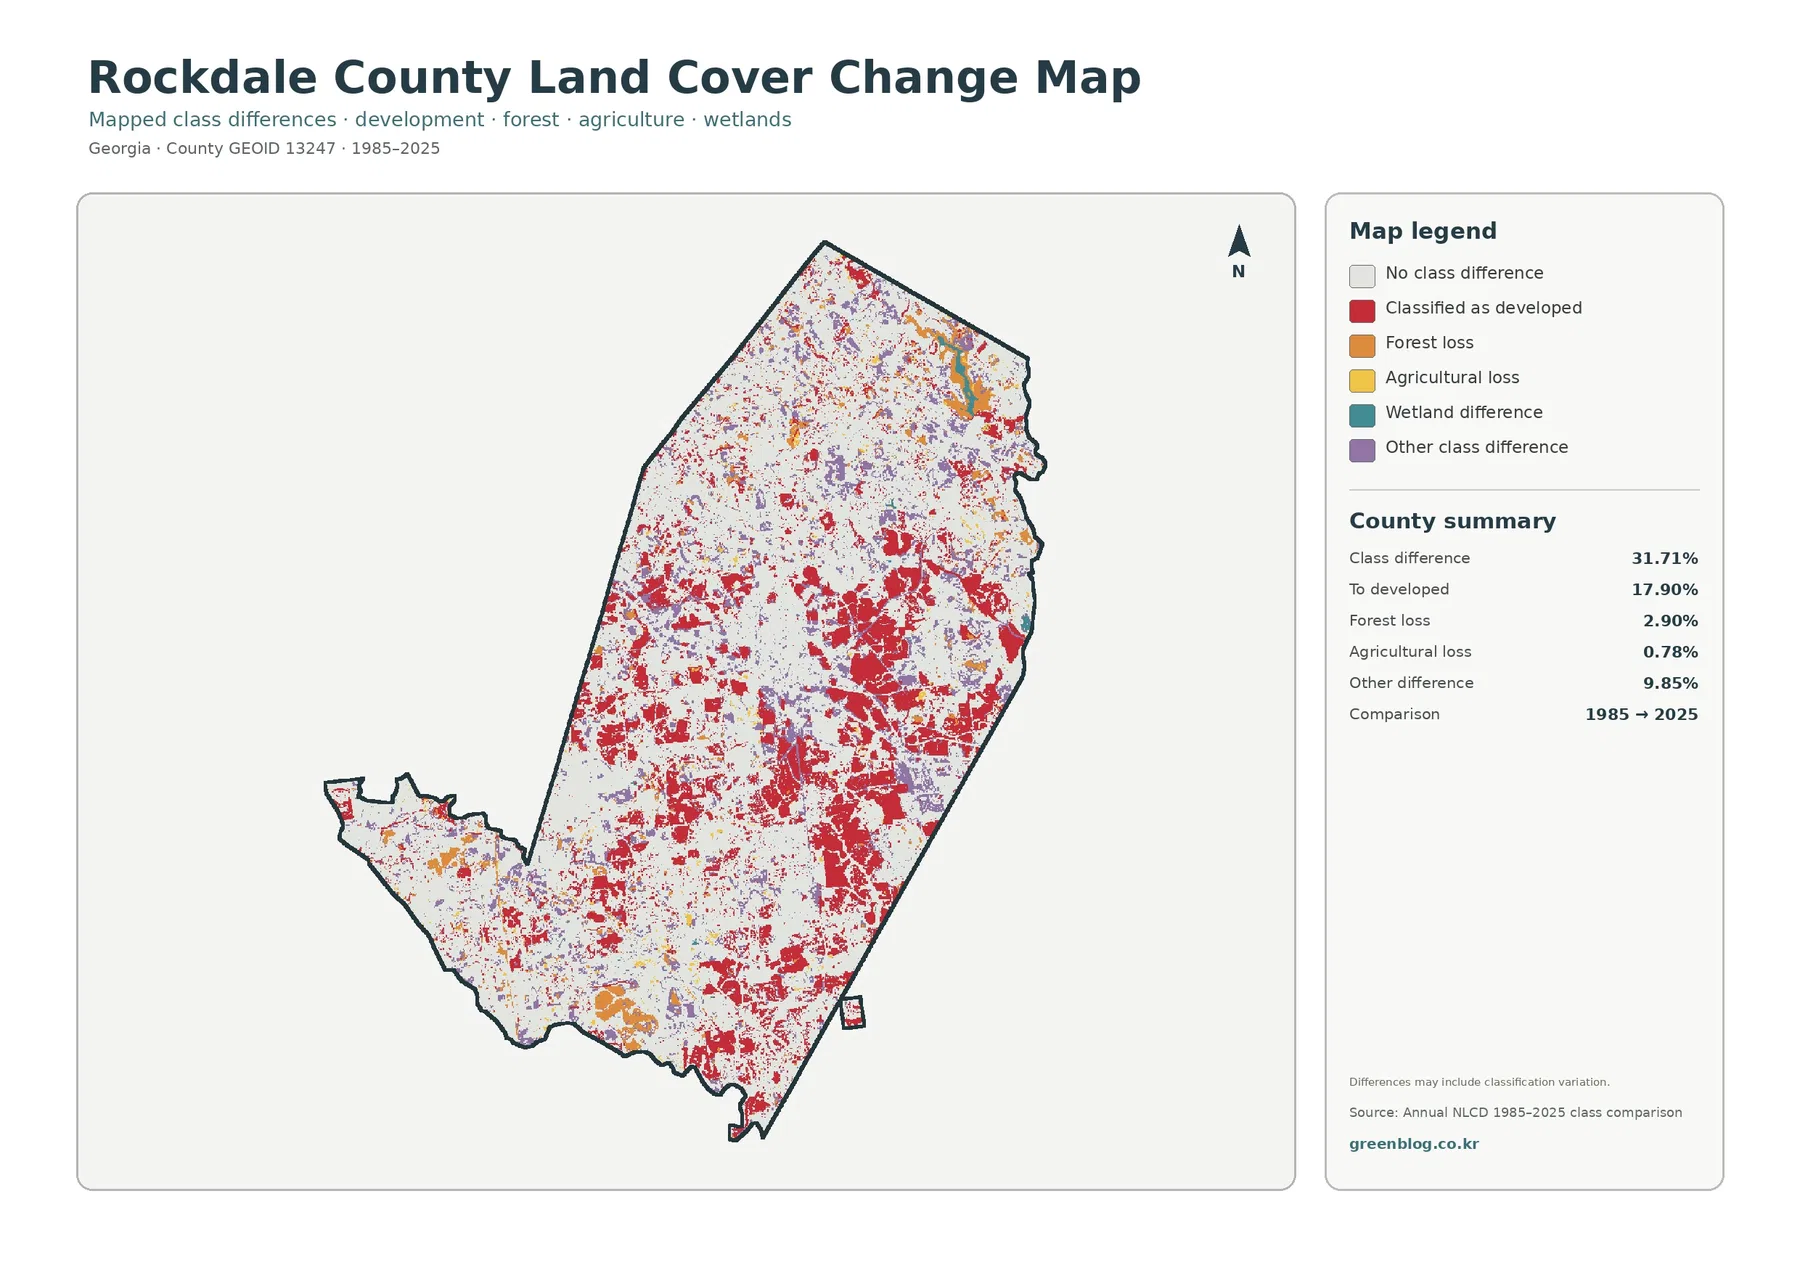
The total endpoint class difference is 31.71%. That number counts cells assigned different land-cover classes in 1985 and 2025. It is not a damage rate and should not be added to or subtracted from the current developed percentage to recreate an earlier county map.
The printed summary lists 17.90% classified to developed, 9.85% other difference, 2.90% forest loss, and 0.78% agricultural loss. Developed-change red is widespread across the central and southeastern suburban footprint and also appears in expanding residential areas farther north and west.
Wetland difference appears in the legend without its own printed percentage. The missing rate should not be reconstructed by subtraction. Classification variation may also contribute to some patches, so intermediate imagery and local development or land-management records are needed before assigning a cause to a specific location.
Land cover is not zoning, a parcel boundary, or a city-limit map
Annual NLCD assigns one predominant class to each 30-meter raster cell. A suburban cell may contain a house, road, lawn, trees, and bare soil while displaying one category. Mixed neighborhoods, narrow streams, small fields, and reservoir edges can therefore appear simplified.
Red developed cover does not define Conyers city limits or zoning. Green forest does not establish ownership, yellow agriculture does not identify a farm parcel, and teal wetland cover is not a regulatory wetland determination. Legal and property questions require current county, city, Census, state, or federal records.
Choosing the four JPG maps for Rockdale County
Use the 2025 countywide map first to show the near-even split between forest and developed land. The vegetation view is better for the greener north and agriculture. Choose the impervious map for Conyers and corridor density, and reserve the endpoint map for 1985–2025 suburban expansion and other class differences.
Each JPG measures 2480 × 1754 pixels and suits reports, lessons, and presentations. Test a proof before large-format printing because the package does not mark the files as A3 high-resolution assets.
Frequently Asked Questions
Is forest or developed land the largest class in Rockdale County?
Forest is slightly larger at 42.09%, compared with 41.15% developed land. The difference is small, which is why both suburban development and large wooded areas are visually important in the county.
Why is mean impervious cover 11.73% when developed land covers 41.15%?
Developed classes can include lawns, trees, yards, and exposed ground. The impervious layer measures the harder surfaces such as roofs, pavement, and parking areas.
Does the 31.71% endpoint difference mean all of that area urbanized?
No. It counts every cell with a different class label in 1985 and 2025. The summary separately lists 17.90% classified to developed, 2.90% forest loss, 0.78% agricultural loss, and 9.85% other difference.
Sources and Reference Data
- MRLC Annual NLCD Data – official access to annual land-cover and comparison products
- USGS Annual NLCD Land Cover Classification – definitions for forest, developed land, agriculture, wetlands, and related classes
- U.S. Census Bureau TIGER/Line Shapefiles – authoritative county, city, and transportation layers for comparison
- Georgia DCA – Rockdale County Comprehensive Plan – official 2023 planning context for growth, land use, and rural character areas
- Rockdale County – Parks and Trails – official Black Shoals Park and 650-acre Randy Poynter Lake information
- UGA Extension – Rockdale County Agriculture & Natural Resources – local agriculture, horticulture, soil, water, and diagnostic resources
Map File Information
The ZIP contains four original JPG maps for comparing Rockdale County's 42.09% forest cover, 41.15% developed land, Conyers-I-20 suburban growth, Black Shoals water, impervious surfaces, and 1985–2025 class differences.
- Included Files: General land cover, forest and farmland, impervious/developed surface, and land-cover change maps
- File Type: Four original JPG map files bundled in one ZIP archive
- Intended Use: Printing, education, presentations, and map-based projects
Related Maps
- Appling County Georgia Land Cover Map
- Atkinson County Georgia Land Cover Map
- Bacon County Georgia Land Cover Map
Green Map creates custom-edited map images using open geographic data sources such as geoBoundaries, Natural Earth, OpenStreetMap, and government open data. These maps are edited visual materials, not raw data files, and are provided for education, documents, presentations, and graphic reference.