Eurostat’s 2025 business digitalisation data show large differences in the share of enterprises using at least one artificial-intelligence technology. Among 32 reporting countries, Denmark records the highest value at 42.03%, followed by Finland at 37.82%, Sweden at 35.04%, Belgium at 34.54% and Luxembourg at 33.61%. Romania has the lowest value at 5.21%.
The simple mean across the 32 national percentages is 19.59% and the median is 18.08%. The first quartile is 10.31% and the third quartile 26.70%, placing the middle half of countries between roughly 10.31% and 26.70%. The gap between the maximum and minimum is 36.82 percentage points.
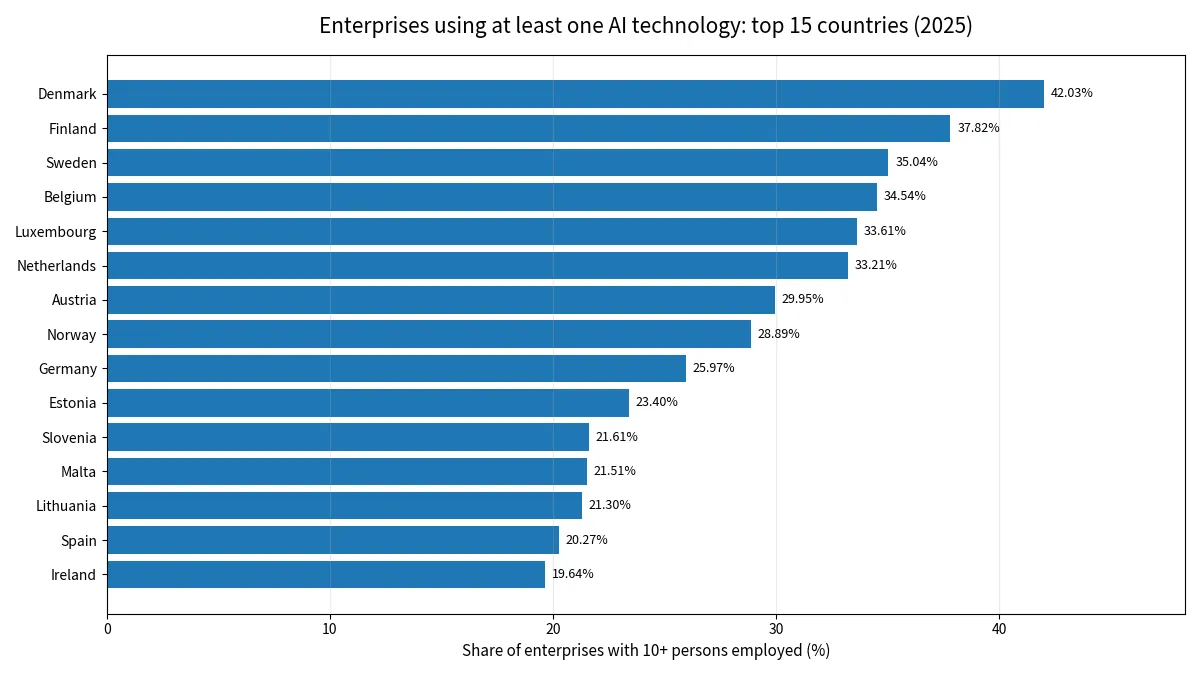
Table of Contents
The measure covers enterprises using at least one AI technology
E_AI_TANY is broader than indicators for a single AI application. An enterprise is counted when it uses at least one of the AI technology categories covered by Eurostat. That makes the measure a general adoption indicator rather than a measure of image recognition, natural-language generation, speech recognition, workflow automation or autonomous machines in isolation.
The enterprise-size class is GE10, meaning ten or more persons employed. The industry aggregate C10-S951_X_K covers the surveyed business activities while excluding the financial sector, and PC_ENT expresses the result as a percentage of enterprises. The measure does not report how many employees use AI, how much firms spend on AI, or how intensively systems are deployed.
Denmark leads, with Nordic countries concentrated near the top
Denmark records 42.03%, Finland 37.82% and Sweden 35.04%. Norway is also high at 28.89%. The simple average for Denmark, Finland, Norway and Sweden is 35.94%, well above the overall country mean of 19.59%.
The Benelux group is also high: Belgium records 34.54%, Luxembourg 33.61% and the Netherlands 33.21%, producing a simple three-country mean of 33.79%. These regional averages are unweighted and should not be read as enterprise-weighted regional adoption rates.
The clustering is descriptive rather than causal. Industry mix, cloud and software adoption, digital skills, firm size, data infrastructure, regulation and supplier ecosystems can all be related to AI adoption. The country percentages alone do not identify which factor is responsible for the observed differences.
The mean is 19.59% and the median 18.08%
The simple mean of 19.59% is only modestly above the median of 18.08%, although the upper group lifts the average. The interquartile range from 10.31% to 26.70% contains half of the countries and gives a useful picture of the central distribution.
By broad bands, 6 countries are at 30% or above, 8 are from 20% to below 30%, 12 are from 10% to below 20%, and 6 are below 10%. Most countries therefore sit between 10% and 30%, while a smaller group is substantially higher or lower.
The top eight observations average 34.39%, compared with 8.50% for the bottom eight. That is about 4.0 times as high. The contrast suggests that enterprises in the leading countries have reached a different stage of diffusion from those at the lower end.
Large European economies also occupy different positions
Germany records 25.97%, Spain 20.27%, France 18.16% and Italy 16.40%. Their simple average is 20.20%. Economic size alone does not determine the adoption rate, and countries with large enterprise populations can have lower percentages while still containing many AI-using firms.
The distinction between rate and count is important. A small economy with a high percentage does not necessarily have more AI-using enterprises in absolute terms than a large economy with a lower rate. The present indicator is designed to compare prevalence, not the total number of adopters.
The Baltic states and Central-Eastern Europe show substantial internal variation
Estonia is at 23.40%, Lithuania 21.30% and Latvia 12.21%, giving the Baltic states a simple average of 18.97%. Czechia records 17.60%, Slovakia 18.00%, Hungary 10.37% and Poland 8.36%.
Neighbouring countries can therefore have noticeably different adoption rates. Geography can help describe clusters, but it does not explain them. Sector composition, enterprise size, skills, technology vendors, digital infrastructure and investment patterns would need to be examined separately.
Six reporting countries are below 10%
Romania records 5.21%, Türkiye 7.41%, Poland 8.36%, Bulgaria 8.55%, Albania 8.99% and Cyprus 9.27%. In these six reporting countries, fewer than one in ten eligible enterprises report using at least one AI technology.
A low rate should not be interpreted as a complete measure of national technological capability. The survey excludes enterprises with fewer than ten persons employed and excludes the financial sector from this industry aggregate. Adoption may also be concentrated in particular industries or larger firms within a country.
Using AI is not the same as using it intensively
The indicator is binary at enterprise level: an eligible firm either reports using at least one covered AI technology or it does not. A company running a limited pilot and another integrating AI across multiple core processes can both be classified as users. The percentage therefore measures breadth of adoption rather than depth, maturity or business impact.
An enterprise can also use several AI technologies simultaneously, while E_AI_TANY records it as a single adopting enterprise. This is why separate technology percentages should not be added together to reconstruct the overall adoption rate. The categories overlap within firms.
All 32 comparable country observations for 2025
The table orders all 32 country observations from highest to lowest while holding year, enterprise-size class, sector aggregate and unit constant. The ranking is useful for data navigation but should not be treated as a composite score of innovation, competitiveness or productivity.
| Rank | Country | Share of enterprises using AI |
|---|---|---|
| 1 | Denmark | 42.03% |
| 2 | Finland | 37.82% |
| 3 | Sweden | 35.04% |
| 4 | Belgium | 34.54% |
| 5 | Luxembourg | 33.61% |
| 6 | Netherlands | 33.21% |
| 7 | Austria | 29.95% |
| 8 | Norway | 28.89% |
| 9 | Germany | 25.97% |
| 10 | Estonia | 23.40% |
| 11 | Slovenia | 21.61% |
| 12 | Malta | 21.51% |
| 13 | Lithuania | 21.30% |
| 14 | Spain | 20.27% |
| 15 | Ireland | 19.64% |
| 16 | France | 18.16% |
| 17 | Slovakia | 18.00% |
| 18 | Czechia | 17.60% |
| 19 | Italy | 16.40% |
| 20 | Croatia | 15.19% |
| 21 | Latvia | 12.21% |
| 22 | Portugal | 11.54% |
| 23 | Bosnia and Herzegovina | 10.78% |
| 24 | Hungary | 10.37% |
| 25 | Serbia | 10.12% |
| 26 | Montenegro | 10.05% |
| 27 | Cyprus | 9.27% |
| 28 | Albania | 8.99% |
| 29 | Bulgaria | 8.55% |
| 30 | Poland | 8.36% |
| 31 | Türkiye | 7.41% |
| 32 | Romania | 5.21% |
A single year does not show adoption speed
This comparison is a 2025 cross-section. A high current rate does not necessarily mean the country has the fastest growth in AI adoption, and a low rate does not imply that adoption is falling. Measuring change requires earlier observations under the same statistical definition.
Time-series comparisons should keep the indicator, size class, industry coverage and unit consistent. A change in survey scope can create an apparent change that is not caused by actual enterprise behaviour. The present analysis therefore stays focused on a like-for-like 2025 comparison.
Source and indicator definition
The source is Eurostat isoc_eb_ai for 2025. The indicator is E_AI_TANY, enterprise-size class GE10, sector aggregate C10-S951_X_K and unit PC_ENT. It measures the percentage of enterprises with ten or more persons employed using at least one AI technology in the covered activities excluding the financial sector. The mean, median and quartiles are calculated from the 32 country observations.
Frequently Asked Questions
Which country had the highest enterprise AI adoption rate in 2025?
Denmark had the highest share among the 32 reporting countries at 42.03%, followed by Finland and Sweden.
What does E_AI_TANY measure?
It measures the percentage of enterprises with ten or more persons employed that use at least one AI technology covered by Eurostat.
What are the mean and median across the 32 countries?
The simple mean is 19.59% and the median is 18.08%.
Can the percentages for separate AI technologies be added to obtain this rate?
No. Enterprises can use several AI technologies at the same time, so the separate technology indicators overlap at firm level.
Related Articles
Green Map creates custom-edited map images using open geographic data sources such as geoBoundaries, Natural Earth, OpenStreetMap, and government open data. These maps are edited visual materials, not raw data files, and are provided for education, documents, presentations, and graphic reference.