World Bank data for 2024 show that DPT immunization coverage among children ages 12–23 months is high in many reporting countries and economies, but substantial gaps remain. Across 192 reported observations, the simple mean is 86.55% and the median is 91%. The maximum is 99%, shared by 19 economies. Sudan records the lowest observed value at 39%, while Yemen, Papua New Guinea and the Central African Republic are each at 42%, 42% and 42% respectively.
The first quartile is 80% and the third quartile 96%, placing the middle half of reported coverage between roughly 80% and 96%. 65 observations are at 95% or above and 109 are at 90% or above. At the lower end, 46 are below 80%, 22 below 70% and 8 below 60%. The overall picture is therefore one of generally high coverage with meaningful national gaps.
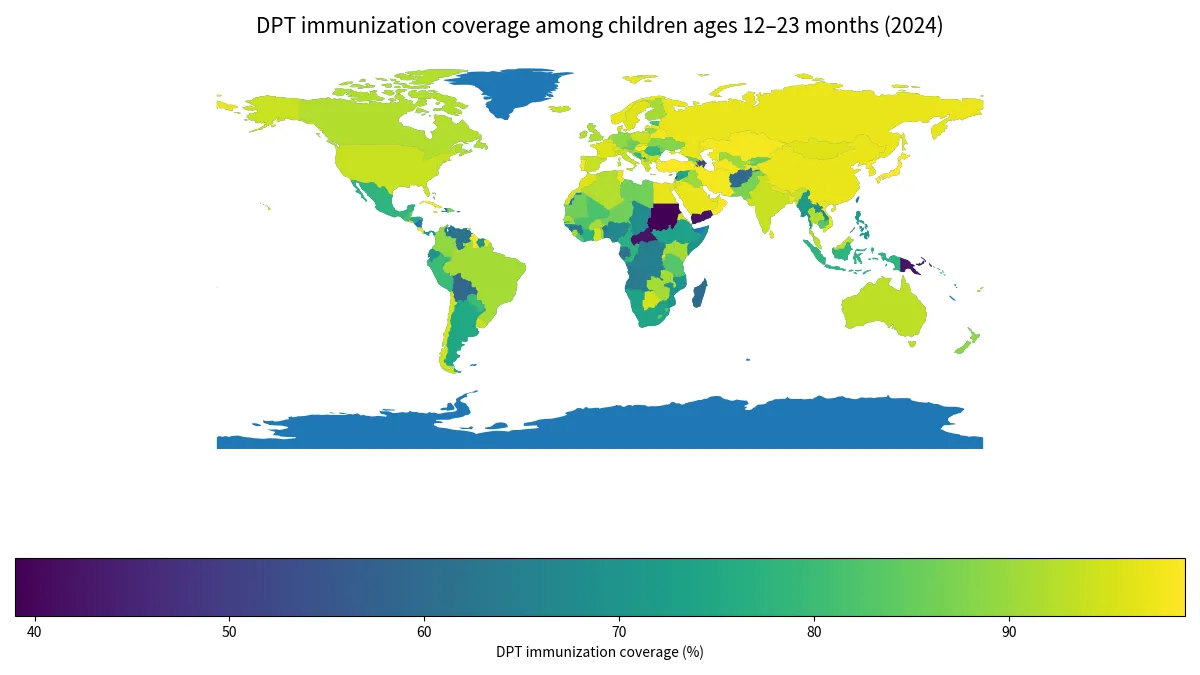
Table of Contents
What the DPT immunization indicator measures
DPT refers to immunization against diphtheria, pertussis and tetanus. World Bank indicator SH.IMM.IDPT measures the percentage of children ages 12–23 months who have received DPT immunization. It is widely used as a basic measure of childhood vaccination coverage and is commonly associated with completion of the standard DPT primary series.
The indicator is not an all-vaccine coverage rate. It applies to one vaccination series and one age range. Measles, hepatitis B, polio and other vaccines have separate indicators and schedules. Their percentages should not be added together to produce a general immunization score.
The top value of 99% is shared by many economies
In 2024, 19 reporting economies record 99%, so the data do not support naming one unique leader. Antigua and Barbuda, Brunei Darussalam, Costa Rica, Cuba, Türkiye, Tonga, Luxembourg, Japan, Jamaica, Kuwait, Hungary, Portugal and Oman are among the economies at this ceiling. Grouping observations into coverage bands is therefore more useful than treating tiny differences near the top as a strict ranking.
There are 65 observations at 95% or above. This shows broad high coverage across much of the reporting set. A difference between 97% and 99%, however, should not be turned into a broad judgment about the quality of an entire health system. DPT coverage is one service-coverage measure.
The 91% median hides large gaps at the lower end
The median is 91%, meaning half of the reported economies are at or above that level. The mean is lower at 86.55% because low observations pull the arithmetic average downward. The top twenty observations average 98.95%, whereas the bottom twenty average 57.55%. Coverage is tightly clustered near the ceiling for many economies but extends down to 39%.
Sudan is at 39%, Yemen 42%, Papua New Guinea 42%, the Central African Republic 42%, Lebanon 49%, Azerbaijan 51% and Afghanistan 59%. These values indicate large gaps in DPT coverage among young children, but the indicator alone cannot establish why coverage is low.
Lower coverage appears more often in parts of Africa and fragile settings
Among map-matched observations, Africa has 49 countries with a median of 83%. Asia has 45 observations with a median of 96%, Europe 38 with 94%, and South America 12 with 80%. These are unweighted country medians, not population-weighted regional vaccination rates.
The map suggests clusters of lower coverage in parts of sub-Saharan Africa and some fragile or conflict-affected settings. Access to clinics, health workers, vaccine supply, cold-chain capacity, mobility, conflict and local inequality can all matter. Those factors are plausible context rather than causal findings from this dataset.
Variation within Africa is also large. Rwanda is at 98%, while Nigeria is at 67%, the Central African Republic 42% and Sudan 39%. A continental label therefore cannot substitute for country-level evidence.
Large-population economies also differ
China records 97%, India 94%, the United States 94%, Brazil 91%, Germany 89%, France 96% and Japan 99%. These are percentages of children ages 12–23 months rather than counts of vaccinated children. A large population can mean that even a high percentage leaves a substantial number of children not fully covered.
That distinction matters for public-health planning. Rate comparisons are useful for prevalence and service coverage, while estimating the number of children needing vaccination requires the size of the relevant age cohort.
High DPT coverage does not summarize all childhood immunization
A high DPT rate shows strong coverage for this specific vaccination series, but it does not guarantee equally high coverage for every childhood vaccine. Other immunization indicators can differ, and national averages can conceal delays in timing or subnational gaps.
National coverage also cannot reveal urban-rural inequality, differences by household income, displacement status or access barriers in specific districts. A country above 95% can still contain pockets of under-immunized children. Country-level comparison is therefore a starting point rather than a complete assessment.
All 192 reported observations for 2024
The table lists the 192 countries and economies with a reported 2024 value, ordered from highest to lowest. The 25 source-missing rows are not replaced with zero. Missing data and genuinely low vaccination coverage remain separate states.
| Rank | Country or economy | DPT immunization coverage |
|---|---|---|
| 1 | Antigua & Barbuda | 99% |
| 2 | Brunei | 99% |
| 3 | Costa Rica | 99% |
| 4 | Cuba | 99% |
| 5 | Türkiye | 99% |
| 6 | St. Vincent & Grenadines | 99% |
| 7 | Tonga | 99% |
| 8 | North Korea | 99% |
| 9 | St. Lucia | 99% |
| 10 | Luxembourg | 99% |
| 11 | Maldives | 99% |
| 12 | Monaco | 99% |
| 13 | Japan | 99% |
| 14 | Jamaica | 99% |
| 15 | Kuwait | 99% |
| 16 | Hungary | 99% |
| 17 | Portugal | 99% |
| 18 | Nauru | 99% |
| 19 | Oman | 99% |
| 20 | Israel | 98% |
| 21 | Bhutan | 98% |
| 22 | Andorra | 98% |
| 23 | Belarus | 98% |
| 24 | Rwanda | 98% |
| 25 | Kazakhstan | 98% |
| 26 | Iran | 98% |
| 27 | Guyana | 98% |
| 28 | Turkmenistan | 98% |
| 29 | Egypt | 97% |
| 30 | China | 97% |
| 31 | Albania | 97% |
| 32 | Belgium | 97% |
| 33 | Sri Lanka | 97% |
| 34 | Latvia | 97% |
| 35 | South Korea | 97% |
| 36 | St. Kitts & Nevis | 97% |
| 37 | Singapore | 97% |
| 38 | Nepal | 97% |
| 39 | Norway | 97% |
| 40 | Malta | 97% |
| 41 | Tajikistan | 97% |
| 42 | Saudi Arabia | 97% |
| 43 | Tunisia | 97% |
| 44 | Bangladesh | 97% |
| 45 | Russia | 97% |
| 46 | Vietnam | 97% |
| 47 | Palau | 97% |
| 48 | Bahrain | 96% |
| 49 | Denmark | 96% |
| 50 | Slovakia | 96% |
| 51 | Qatar | 96% |
| 52 | Mongolia | 96% |
| 53 | Jordan | 96% |
| 54 | United Arab Emirates | 96% |
| 55 | Switzerland | 96% |
| 56 | Sweden | 96% |
| 57 | Morocco | 96% |
| 58 | France | 96% |
| 59 | Ghana | 95% |
| 60 | Eritrea | 95% |
| 61 | Chile | 95% |
| 62 | Serbia | 95% |
| 63 | Greece | 95% |
| 64 | Botswana | 95% |
| 65 | El Salvador | 95% |
| 66 | Italy | 94% |
| 67 | India | 94% |
| 68 | Iceland | 94% |
| 69 | Seychelles | 94% |
| 70 | Barbados | 94% |
| 71 | Bulgaria | 94% |
| 72 | Armenia | 94% |
| 73 | Cyprus | 94% |
| 74 | Spain | 94% |
| 75 | Fiji | 94% |
| 76 | Kiribati | 94% |
| 77 | Tuvalu | 94% |
| 78 | Uruguay | 94% |
| 79 | Poland | 94% |
| 80 | United States | 94% |
| 81 | Australia | 93% |
| 82 | Malaysia | 93% |
| 83 | Grenada | 93% |
| 84 | Cape Verde | 93% |
| 85 | Mauritius | 93% |
| 86 | Algeria | 92% |
| 87 | Canada | 92% |
| 88 | United Kingdom | 92% |
| 89 | Trinidad & Tobago | 92% |
| 90 | Croatia | 92% |
| 91 | Ireland | 92% |
| 92 | Thailand | 92% |
| 93 | Malawi | 91% |
| 94 | Finland | 91% |
| 95 | Brazil | 91% |
| 96 | Burkina Faso | 91% |
| 97 | Zimbabwe | 91% |
| 98 | Zambia | 91% |
| 99 | Sierra Leone | 91% |
| 100 | Senegal | 91% |
| 101 | Uganda | 91% |
| 102 | Netherlands | 91% |
| 103 | Kenya | 91% |
| 104 | Togo | 90% |
| 105 | Bahamas | 90% |
| 106 | Iraq | 90% |
| 107 | Uzbekistan | 90% |
| 108 | Dominica | 90% |
| 109 | Slovenia | 90% |
| 110 | North Macedonia | 89% |
| 111 | Lithuania | 89% |
| 112 | New Zealand | 89% |
| 113 | Germany | 89% |
| 114 | Burundi | 89% |
| 115 | Colombia | 89% |
| 116 | San Marino | 88% |
| 117 | Palestinian Territories | 88% |
| 118 | Ukraine | 88% |
| 119 | Belize | 88% |
| 120 | Dominican Republic | 87% |
| 121 | Solomon Islands | 87% |
| 122 | São Tomé & Príncipe | 87% |
| 123 | Pakistan | 87% |
| 124 | Niger | 86% |
| 125 | Georgia | 86% |
| 126 | Czechia | 86% |
| 127 | Mauritania | 86% |
| 128 | Libya | 86% |
| 129 | Moldova | 86% |
| 130 | Lesotho | 86% |
| 131 | Marshall Islands | 85% |
| 132 | Austria | 85% |
| 133 | Samoa | 85% |
| 134 | Kyrgyzstan | 85% |
| 135 | Eswatini | 84% |
| 136 | Cambodia | 83% |
| 137 | Timor-Leste | 83% |
| 138 | Tanzania | 83% |
| 139 | Liberia | 83% |
| 140 | Mali | 82% |
| 141 | Montenegro | 81% |
| 142 | Guatemala | 81% |
| 143 | Estonia | 81% |
| 144 | Paraguay | 80% |
| 145 | Gambia | 80% |
| 146 | Peru | 80% |
| 147 | Romania | 79% |
| 148 | Bosnia & Herzegovina | 79% |
| 149 | Congo – Brazzaville | 78% |
| 150 | Indonesia | 78% |
| 151 | Mexico | 78% |
| 152 | Djibouti | 77% |
| 153 | Cameroon | 77% |
| 154 | Côte d’Ivoire | 77% |
| 155 | Micronesia | 76% |
| 156 | Argentina | 75% |
| 157 | Comoros | 75% |
| 158 | Honduras | 75% |
| 159 | Namibia | 74% |
| 160 | South Africa | 74% |
| 161 | South Sudan | 73% |
| 162 | Ethiopia | 73% |
| 163 | Syria | 73% |
| 164 | Panama | 72% |
| 165 | Vanuatu | 71% |
| 166 | Myanmar (Burma) | 71% |
| 167 | Philippines | 71% |
| 168 | Mozambique | 70% |
| 169 | Ecuador | 70% |
| 170 | Somalia | 70% |
| 171 | Suriname | 69% |
| 172 | Chad | 68% |
| 173 | Equatorial Guinea | 68% |
| 174 | Guinea-Bissau | 68% |
| 175 | Nigeria | 67% |
| 176 | Laos | 67% |
| 177 | Congo – Kinshasa | 65% |
| 178 | Angola | 64% |
| 179 | Guinea | 63% |
| 180 | Benin | 63% |
| 181 | Venezuela | 62% |
| 182 | Gabon | 61% |
| 183 | Haiti | 60% |
| 184 | Madagascar | 60% |
| 185 | Bolivia | 59% |
| 186 | Afghanistan | 59% |
| 187 | Azerbaijan | 51% |
| 188 | Lebanon | 49% |
| 189 | Central African Republic | 42% |
| 190 | Papua New Guinea | 42% |
| 191 | Yemen | 42% |
| 192 | Sudan | 39% |
Blank map areas are not zero coverage
The low-resolution boundary matches 165 of the 192 reported observations. The other 27 observations, mostly small islands and territories, remain in the full table and statistics. A blank location on the map can therefore reflect missing geometry rather than zero immunization.
The source itself also contains 25 economies without a 2024 observation. They remain missing rather than being imputed. Preserving that distinction prevents a lack of data from being mistaken for a vaccination failure.
Source and indicator definition
The source is World Bank indicator SH.IMM.IDPT, “Immunization, DPT (% of children ages 12-23 months),” for 2024. The comparison uses the 192 reported observations out of 217 country and economy rows, while 25 source-missing rows remain missing. The mean, median, quartiles and ordering are calculated from the reported values only.
Frequently Asked Questions
Which country had the highest DPT immunization coverage in 2024?
The maximum is 99%, shared by 19 countries and economies, so there is no single unique leader.
What diseases does DPT vaccination cover?
DPT vaccination protects against diphtheria, pertussis and tetanus.
What are the 2024 median and mean?
Across the 192 reported observations, the median is 91% and the simple mean is 86.55%.
Are missing values treated as zero?
No. The 25 source-missing rows remain missing and are excluded from the mean and ranking.
Related Articles
Green Map creates custom-edited map images using open geographic data sources such as geoBoundaries, Natural Earth, OpenStreetMap, and government open data. These maps are edited visual materials, not raw data files, and are provided for education, documents, presentations, and graphic reference.