The 2025 state comparison of U.S. renewable electricity shows a highly uneven distribution of utility-scale net generation. The U.S. Energy Information Administration series used here is Utility Scale Electricity Net Generation · all renewables · Electric Power Sector Non-CHP. It is an annual generation measure reported in thousand megawatthours, with fueltypeid AOR and sectorid 90 held constant. The table contains all 50 states plus the District of Columbia, giving 51 comparable jurisdictions for the same year.
Across those 51 jurisdictions, the values sum to 791,746.916 thousand MWh, equivalent to about 791.747 TWh. Texas is first at 187,631.967 thousand MWh, followed by California at 84,379.756 and Iowa at 45,163.485. Texas alone contributes 23.7% of the 51-jurisdiction sum. Texas and California together reach 34.4%, while the top three reach 40.1%. These shares describe only this specific EIA series and should not be read as each state’s renewable percentage of total generation.
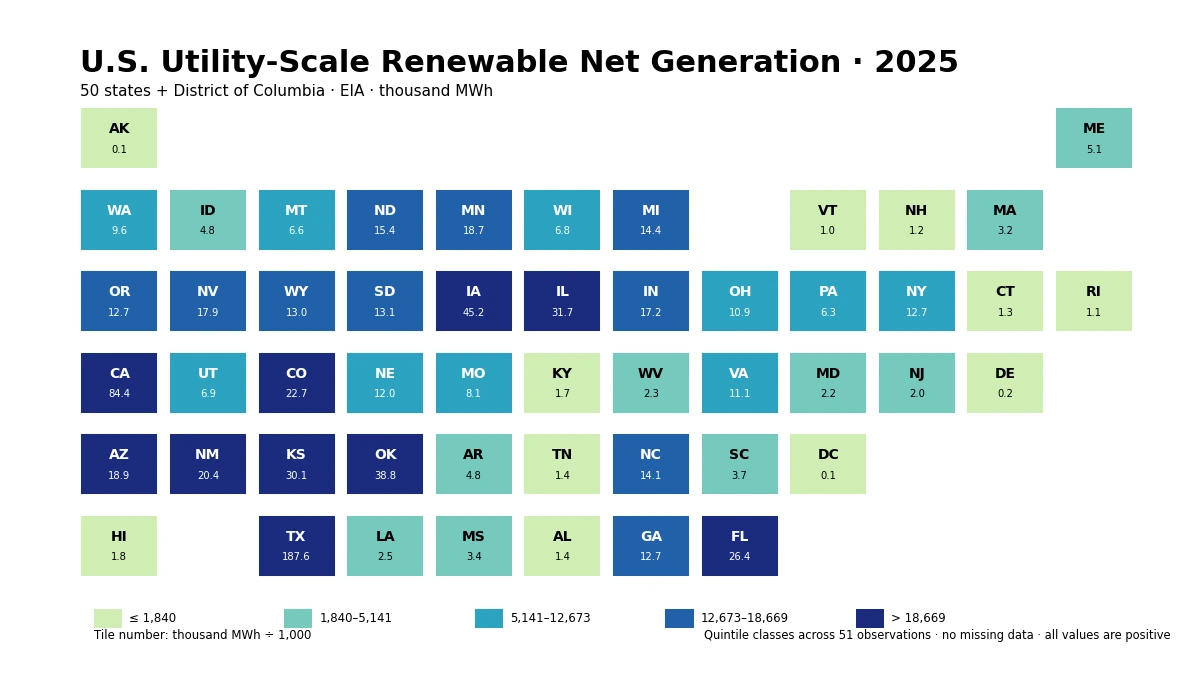
Table of Contents
What this EIA series measures
The measure is narrower than total electricity generation. It selects the EIA all-renewables fuel category and the Electric Power Sector Non-CHP sector within the utility-scale operational-data route. A state’s value can therefore differ substantially from its total net generation, fossil-fuel generation, solar-only generation, independent-power-producer output, or CHP output. A valid comparison requires the same year, generation field, AOR fuel facet, sectorid 90, annual frequency, geography level, and thousand-MWh unit.
The observations are absolute physical electricity quantities, not percentages or intensity measures. A high value does not automatically mean that renewables provide the highest share of a state’s electricity, that the state has the highest renewable capacity per resident, or that its system is more efficient. Those questions need an additional denominator such as total generation, population, installed capacity, or demand. The state table directly supports a comparison of scale within one defined EIA series.
Texas leads, with California and Iowa next
Texas records 187,631.967 thousand MWh, about 2.22 times California’s 84,379.756. Iowa ranks third at 45,163.485, followed by Oklahoma at 38,770.304 and Illinois at 31,731.045 thousand MWh. Kansas, Florida, Colorado, New Mexico, and Arizona complete the top ten. The leading jurisdictions are geographically dispersed across the South, West, Great Plains, Midwest, and Southwest rather than forming a single compact region.
| Rank | State or jurisdiction | 2025 net generation (thousand MWh) |
|---|---|---|
| 1 | Texas | 187,631.967 |
| 2 | California | 84,379.756 |
| 3 | Iowa | 45,163.485 |
| 4 | Oklahoma | 38,770.304 |
| 5 | Illinois | 31,731.045 |
| 6 | Kansas | 30,145.623 |
| 7 | Florida | 26,438.016 |
| 8 | Colorado | 22,705.197 |
| 9 | New Mexico | 20,374.064 |
| 10 | Arizona | 18,925.074 |
The top five account for about 49.0% of the 51-jurisdiction total, and the top ten account for 63.9%. Concentration is meaningful, but the remaining 41 jurisdictions still contribute about 36.1%. Texas is large enough to lift the arithmetic mean to 15,524.449 thousand MWh, while the median is only 8,135.165. That gap between mean and median is a clear sign that a small number of very large observations stretch the upper end of the distribution.
The median gives a different picture of a typical jurisdiction
After sorting all 51 observations, the median is 8,135.165 thousand MWh. The first quartile is 2,210.263 and the third quartile is 16,271.459, so the middle half of jurisdictions lies roughly between those two values. Texas and California sit far above that interquartile range. Describing the state pattern with only the mean would therefore make a typical jurisdiction appear larger than the median state-level observation actually is.
At the low end, the District of Columbia records 50.816 thousand MWh, Alaska 143.031, and Delaware 193.516. Vermont, Rhode Island, New Hampshire, and Connecticut also appear near the bottom. There are no missing observations and no exact-zero values in the 2025 table. Small numbers are therefore valid positive observations, not blanks that should be imputed, discarded, or converted to zero.
How to interpret the 791.747 TWh combined total
The 791,746.916-thousand-MWh total is simply the sum of the 51 observations under the same EIA definition. Texas contributes 23.7%, the top two 34.4%, the top three 40.1%, the top five 49.0%, and the top ten 63.9%. These ratios help describe concentration. They do not show market share for the entire U.S. power sector because the denominator excludes generation outside this selected all-renewables, Non-CHP series.
The same distinction matters within each state. Texas accounting for 23.7% of this 51-jurisdiction sum does not mean that 23.7% of Texas electricity is renewable. To calculate a state renewable share, the renewable numerator would need to be paired with a compatible total-generation denominator for the same period and scope. Absolute generation and generation share answer different questions and should not be substituted for one another.
The spatial pattern highlights the Great Plains and several western states
On the state tile map, Texas occupies the highest class and California is the second major standout. Iowa, Oklahoma, and Kansas place several Great Plains and Midwestern jurisdictions in the upper range, while Colorado, New Mexico, Arizona, and Nevada add sizable values across the West and Southwest. Some smaller northeastern jurisdictions and the District of Columbia fall into the lowest range. The map is useful for locating large and small observations, but geography alone does not establish the reasons behind them.
Explaining why one state has a higher all-renewables value would require more detailed evidence. Technology-specific generation, installed capacity, capacity factors, plant additions and retirements, hydrological conditions, weather, curtailment, and transmission conditions may all matter, but they are not variables in this 51-row table. Because AOR is an aggregate renewable category, the state total does not by itself reveal how much comes from wind, solar, hydropower, geothermal, or other renewable sources.
Texas and California have an outsized effect on the average
Texas and California together produce 272,011.723 thousand MWh in this series, or 34.4% of the combined total. Removing those two observations leaves about 519,735.193 thousand MWh across the other 49 jurisdictions. Their size means that year-to-year changes in either state could noticeably influence the combined total even if many smaller states moved only slightly. The current data, however, cover 2025 only, so they cannot establish whether either state increased or decreased from a prior year.
A trend analysis should retrieve the same generation field and the same AOR and sectorid 90 facets for multiple years. Mixing a different sector, fuel grouping, or generation concept into a time series can create an apparent change that is actually a change in definition. Rankings should also be treated as year-specific observations rather than permanent positions because plant operations, resource conditions, new capacity, retirements, and reporting boundaries can change over time.
The top ten include several different parts of the country
The top ten are Texas, California, Iowa, Oklahoma, Illinois, Kansas, Florida, Colorado, New Mexico, and Arizona. This group spans multiple regions, which is important when reading the map. The distribution is not a simple east-versus-west pattern and not a single contiguous high-output belt. Texas dominates in absolute terms, but the states ranked third through tenth still range from about 18,925 to 45,163 thousand MWh, so there is substantial renewable generation beyond the two largest jurisdictions.
Minnesota ranks eleventh at 18,669.054 thousand MWh, Nevada twelfth at 17,851.480, and Indiana thirteenth at 17,164.827. The third quartile is 16,271.459, so observations above that level sit roughly in the top quarter of the 51-jurisdiction distribution. This quartile is a descriptive statistical boundary rather than a policy benchmark. It helps show relative position without assigning a value judgment to a state’s generation level.
Low values are still real observations, not missing data
The District of Columbia, Alaska, and Delaware have the three smallest observations at 50.816, 143.031, and 193.516 thousand MWh. Vermont records 1,044.560, Rhode Island 1,121.703, New Hampshire 1,241.354, and Connecticut 1,335.736. Every one of these entries is positive. A pale map tile should therefore be interpreted as a low measured value within the selected EIA series, not as an absence of data.
A low absolute value also does not demonstrate that renewable electricity is unimportant in that jurisdiction. State size, overall power-system scale, plant ownership, sector classification, and the composition of generation can all affect an absolute quantity. Comparisons of intensity or importance need a denominator suited to the question, such as total net generation, population, capacity, or electricity consumption. The present series should remain an absolute-generation comparison.
What a single 2025 snapshot can and cannot tell us
The dataset directly supports statements about the 2025 values, ranks, sum, mean, median, quartiles, concentration shares, and geographic distribution under one fixed EIA identity. It shows that Texas is highest, California and Iowa follow, all 51 jurisdictions have positive observations, and the mean is substantially above the median because the distribution has a long upper tail.
It does not independently measure policy performance, electricity prices, emissions reductions, grid reliability, generation efficiency, or renewable output per resident. It also does not separate the all-renewables aggregate into technology contributions. Those questions can be studied, but only by joining additional compatible variables and keeping the period and scope aligned. Staying within the metric’s actual boundary prevents an absolute state ranking from being turned into a claim the data do not support.
Key numbers from the 2025 comparison
The 51-jurisdiction sum is 791,746.916 thousand MWh, the mean is 15,524.449, and the median is 8,135.165. The first quartile is 2,210.263 and the third quartile is 16,271.459. Texas is the maximum at 187,631.967, while the District of Columbia is the minimum at 50.816. Texas represents 23.7% of the total, the top three 40.1%, and the top ten 63.9%. There are no missing rows and no zero observations.
For reproducible comparisons, the defining dimensions should remain unchanged: annual frequency, 2025, generation, fueltypeid AOR, sectorid 90, state geography, and thousand megawatthours. The same identity can be extended to other years if a trend is needed. Keeping those dimensions fixed ensures that an observed difference reflects a change in the published value rather than a switch to a neighboring EIA series.
Frequently Asked Questions
How many jurisdictions are included in the 2025 comparison?
The table contains all 50 states plus the District of Columbia, for 51 jurisdictions. There are no missing or zero observations.
Does Texas’s 23.7% mean that 23.7% of Texas electricity is renewable?
No. It is Texas’s share of the 51-jurisdiction sum for this specific EIA all-renewables, Electric Power Sector Non-CHP series.
Can this series rank state renewable policy performance?
No. It reports absolute net generation. Policy or mix comparisons require additional measures such as total generation, capacity, or other compatible denominators.
Related Articles
Green Map creates custom-edited map images using open geographic data sources such as geoBoundaries, Natural Earth, OpenStreetMap, and government open data. These maps are edited visual materials, not raw data files, and are provided for education, documents, presentations, and graphic reference.