The U.S. Energy Information Administration state series for 2024 shows a highly uneven distribution of renewable energy consumption, measured in Btu, within the Electric Power Sector Non-CHP category. The dataset contains all 50 states plus the District of Columbia, giving 51 observed values with no missing entries. Summed across those observations, the series reaches 2,625.56 million MMBtu. Texas is the largest observation at 566.83 million MMBtu, followed by California at 301.48, Iowa at 154.88, Oklahoma at 130.86 and Kansas at 102.64. The unweighted mean is 51.48, while the median is only 29.41, a clear sign that a small upper tail pulls the average upward.
The metric needs careful labeling because it is not a megawatt-hour generation ranking. The EIA field is total-consumption-btu, the fuel facet is all renewables, and the sector facet is Electric Power Sector Non-CHP. The API reports the values in million MMBtu. Renewable technologies are converted into an energy-consumption accounting framework, so the numbers should not be treated as identical to renewable generation, nameplate capacity, or a state renewable share. Those measures answer different questions and use different denominators or physical units.
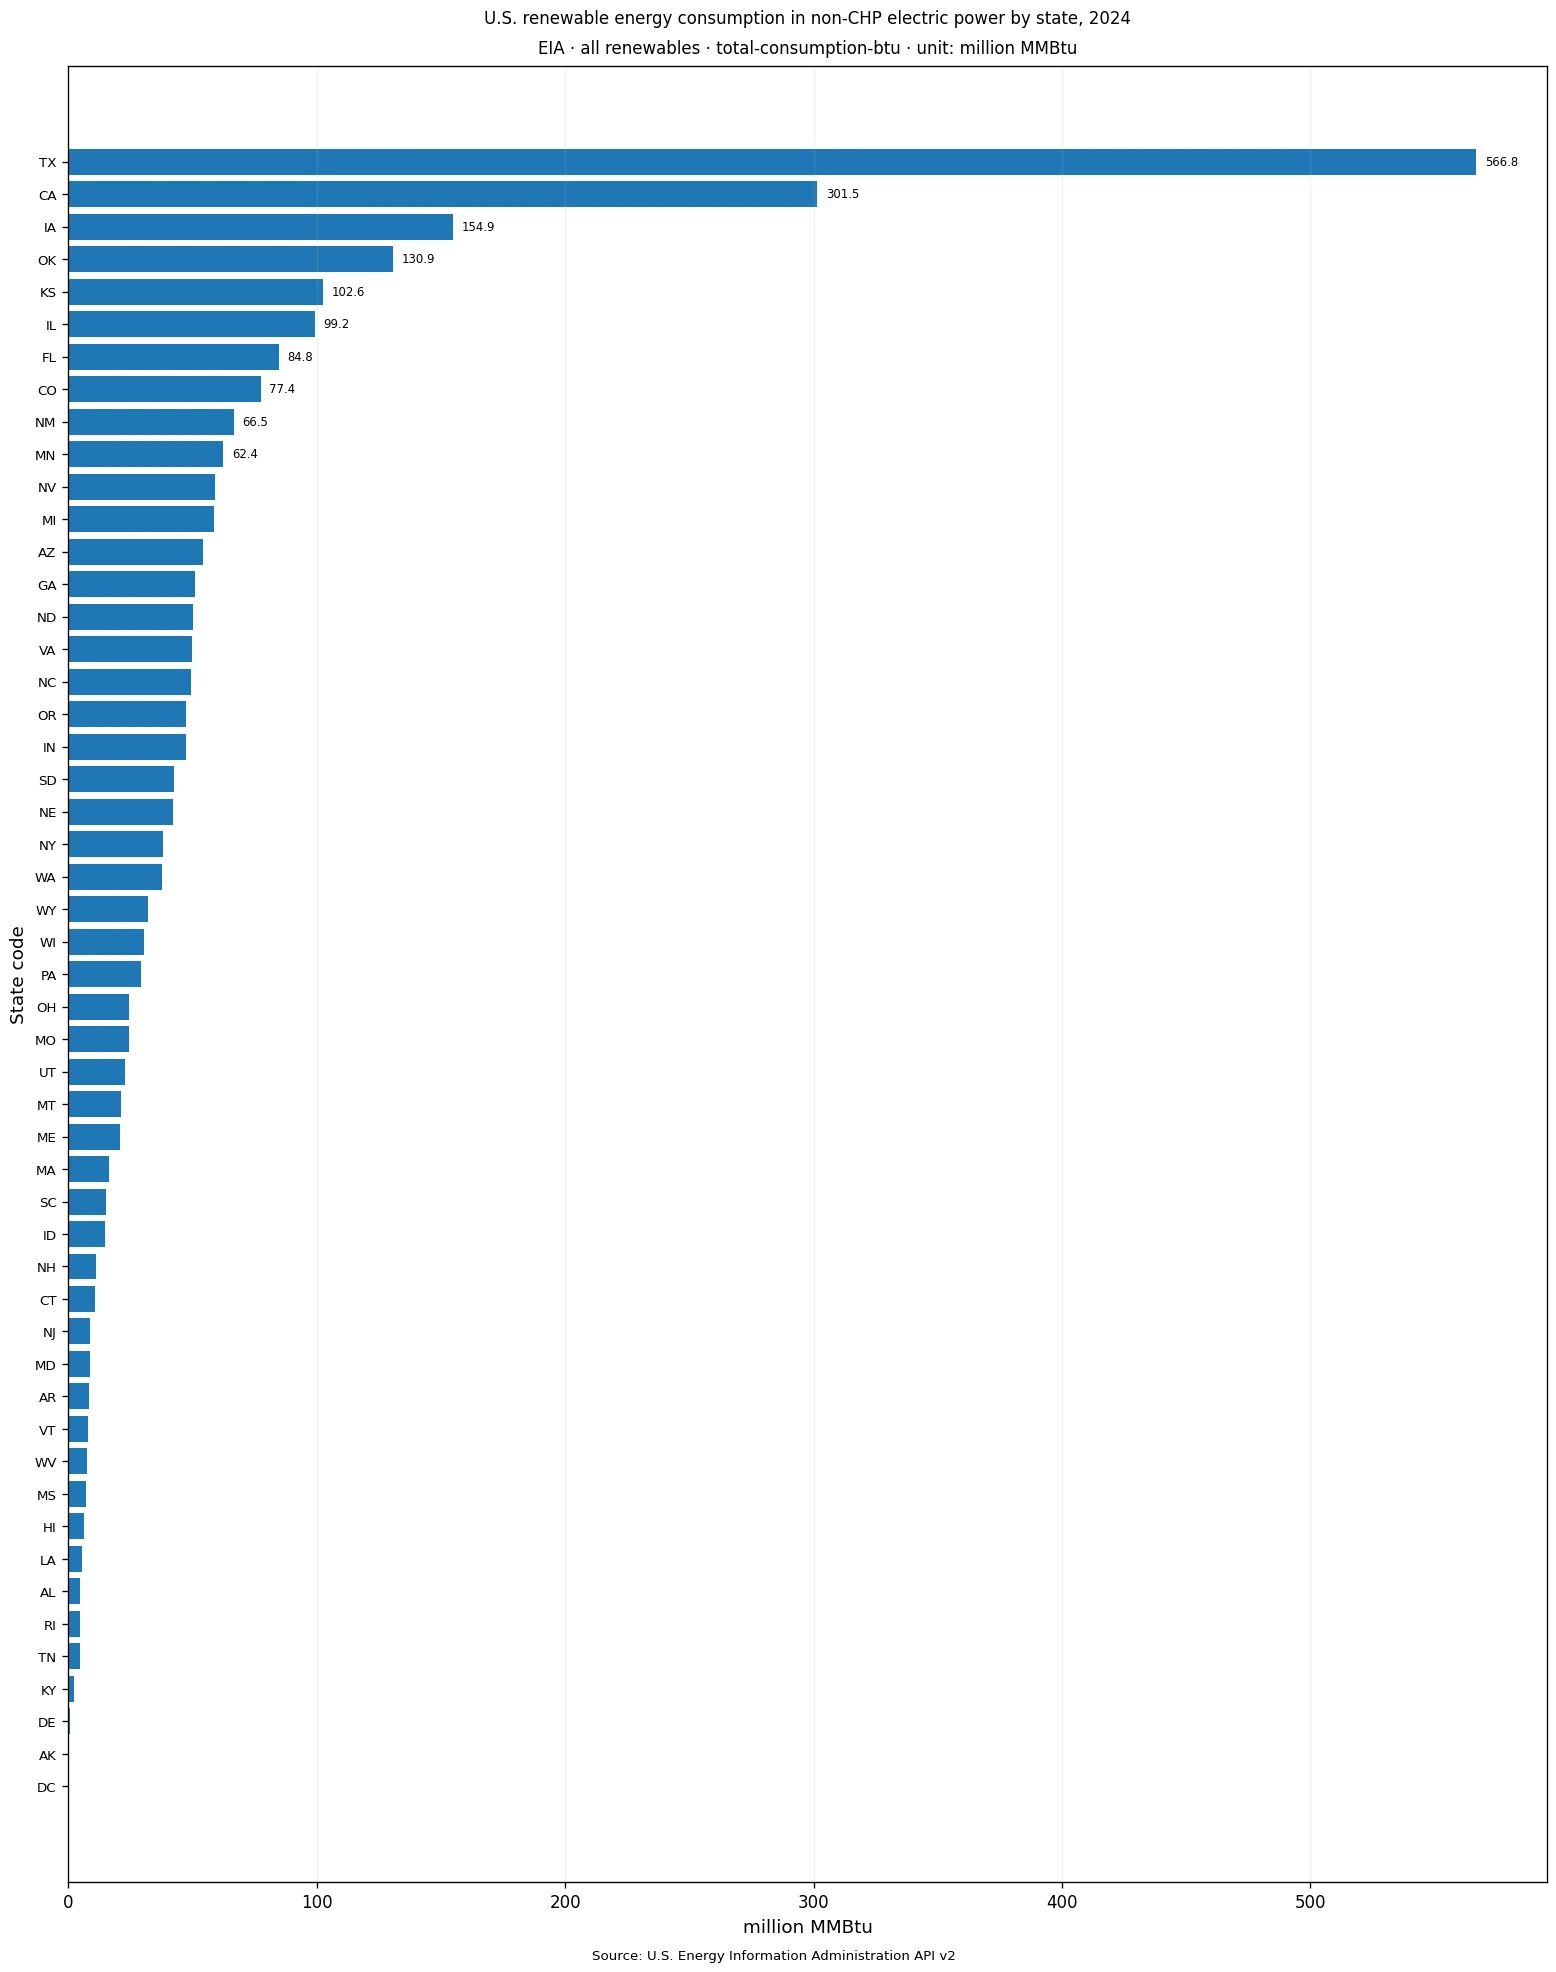
Table of Contents
Texas alone represented 21.6% of the sum of the 51 observations
Texas contributes 21.59% of the simple sum of the state and District of Columbia values. California adds another 11.48%, so the two largest observations together account for 33.07%. Adding Iowa raises the top-three share to 38.97%. The top five account for 47.86%, and the top ten reach 62.73%. This concentration is one of the most important statistical features of the 2024 slice: a substantial portion of the reported Btu value sits in a relatively small group of states.
These percentages use the sum of the 51 observations as an analytical denominator. They are not the renewable share of each state’s electricity, the states’ shares of U.S. final energy demand, or the EIA national series for another table. A 21.59% share for Texas means only that its reported value makes up that portion of the included state-level total. Keeping that denominator explicit prevents a concentration statistic from being mistaken for an electricity-mix percentage.
The upper tier is not simply a list of the most populous states
California ranks second, but Iowa, Oklahoma and Kansas occupy the next three positions. Illinois is sixth at 99.16 million MMBtu, followed by Florida at 84.78, Colorado at 77.43, New Mexico at 66.54 and Minnesota at 62.40. This ordering differs sharply from a population ranking. It also differs from what would be expected from economic size alone. The series reflects the EIA’s specific renewable-consumption measure in the non-CHP electric power sector rather than a general measure of state size.
That distinction matters when looking for explanations. The dataset establishes the measured values but does not by itself isolate the contribution of wind, hydroelectricity, solar, biomass, geothermal energy, weather, capacity factors, or state policy. Some of those factors may be relevant, but attributing the ranking to any one of them requires additional EIA series or other primary data. The present comparison is strongest when it stays descriptive: it identifies where the specified Btu measure is high or low in 2024.
| Rank | State / area | Code | 2024 value | Share of 51-value sum |
|---|---|---|---|---|
| 1 | Texas | TX | 566.83 | 21.59% |
| 2 | California | CA | 301.48 | 11.48% |
| 3 | Iowa | IA | 154.88 | 5.90% |
| 4 | Oklahoma | OK | 130.86 | 4.98% |
| 5 | Kansas | KS | 102.64 | 3.91% |
| 6 | Illinois | IL | 99.16 | 3.78% |
| 7 | Florida | FL | 84.78 | 3.23% |
| 8 | Colorado | CO | 77.43 | 2.95% |
| 9 | New Mexico | NM | 66.54 | 2.53% |
| 10 | Minnesota | MN | 62.40 | 2.38% |
The median and quartiles describe a very different “typical” state than the mean
The first quartile is 8.42 million MMBtu, the median is 29.41 and the third quartile is 52.73. Half of the observations therefore fall between roughly 8.4 and 52.7. The mean, at 51.48, sits close to the third quartile rather than the median because the very large values at the top stretch the distribution. When the goal is to place a state in context, the median is a more resistant benchmark than the average.
Five observations are at or above 100 million MMBtu, and 15 are at or above 50. At the other end, 15 are below 10 and three are below 1. This wide spread means that a simple high-versus-low split loses a great deal of information. A state near 30 is close to the median even though it is far below Texas. A state near 50 is already around the upper quartile, even though it may not appear visually dominant next to the largest two bars.
Western states span almost the full range of the distribution
Colorado reports 77.43 million MMBtu, New Mexico 66.54, Nevada 59.05 and Arizona 54.36, placing all four well above the median. Oregon is 47.28 and Washington 37.68, while Utah and Montana are in the low 20s. Alaska is only 0.45. The western states therefore do not form a single compact cluster in this metric. A regional label cannot substitute for the actual state observations.
The variation is also a reminder that “all renewables” is an aggregate fuel category. The underlying renewable mix can differ sharply from state to state, and energy accounting for different resources can interact with the Btu-based measure in ways that are not visible in this one column. The data are appropriate for comparing the published state values, but technology-level interpretation requires the associated fuel-specific or generation series.
The Southeast also contains both relatively high and very low observations
Florida is 84.78 million MMBtu, Georgia 51.10, Virginia 49.99 and North Carolina 49.28. In contrast, Alabama is 4.75, Tennessee 4.66, Louisiana 5.39 and Mississippi 7.03. Those differences are larger than a broad regional summary would suggest. They also show why state-level energy data are valuable: neighboring or nearby states can occupy very different positions even when grouped together in common regional discussions.
Nothing in the one-year series demonstrates the cause of those differences. The values could reflect multiple interacting factors, including the technology mix and the scale of electric-power operations, but the present metric alone cannot separate them. A causal explanation should be built from consistent additional variables, preferably using the same year and geography, rather than inferred from a rank order.
The smallest observations are measured values, not missing data
The District of Columbia is the minimum at 0.11 million MMBtu. Alaska follows at 0.45 and Delaware at 0.83. Kentucky is 2.16, Tennessee 4.66, Rhode Island 4.70, Alabama 4.75, Louisiana 5.39, Hawaii 6.27 and Mississippi 7.03. All 51 rows contain actual numeric observations, so the low end of the chart is not a missing-data artifact.
A low value should not be translated into a claim that a state has no renewable energy. The scope is narrower: all renewables within the Electric Power Sector Non-CHP and the total-consumption-btu field. Renewable activity in other sectors, CHP operations, distributed generation categories, or different EIA accounting series may not be represented in the same way. The correct interpretation remains tied to the exact series identity.
| Low rank | State / area | Code | 2024 value | Share of 51-value sum |
|---|---|---|---|---|
| 1 | District of Columbia | DC | 0.11 | 0.00% |
| 2 | Alaska | AK | 0.45 | 0.02% |
| 3 | Delaware | DE | 0.83 | 0.03% |
| 4 | Kentucky | KY | 2.16 | 0.08% |
| 5 | Tennessee | TN | 4.66 | 0.18% |
| 6 | Rhode Island | RI | 4.70 | 0.18% |
| 7 | Alabama | AL | 4.75 | 0.18% |
| 8 | Louisiana | LA | 5.39 | 0.21% |
| 9 | Hawaii | HI | 6.27 | 0.24% |
| 10 | Mississippi | MS | 7.03 | 0.27% |
Complete state coverage strengthens the comparison, but it does not make the metric universal
For the defined state scope, coverage is unusually clean: 51 rows, 51 values, and no imputation. That means rankings, quartiles and concentration shares can be calculated without deciding how to treat missing states. It does not mean the series covers every U.S. territory, balancing authority, utility, or end-use sector. “Complete” here refers specifically to the 50 states and District of Columbia included in this extracted state-level slice.
The sum of 2,625.56 million MMBtu is also a derived sum of these 51 state-level observations. It is useful for calculating the concentration shares in this article, but it should not automatically be substituted for an EIA national total published in a different table. National series can use their own aggregation, scope, or revisions. Comparing totals requires checking that the metric code, sector, fuel category, frequency, and geography treatment are identical.
This Btu series should not be substituted for renewable generation or capacity
Electricity generation is normally discussed in megawatt-hours, while capacity is normally reported in megawatts. The present field is energy consumption expressed in Btu. Those quantities are connected within the energy system, but one cannot be converted into the other by ranking alone. A state can move differently across a Btu consumption table, a generation table and a capacity table because each measure captures a different stage or accounting concept.
For readers asking which state generated the most renewable electricity, the appropriate response should come from a generation series. For readers asking how the EIA records all-renewable total consumption in the non-CHP electric power sector, this dataset is directly relevant. Keeping those questions separate is especially important for renewable technologies, where standard heat-rate conventions and physical fuel concepts do not map neatly onto every resource.
The top-ten concentration is useful, but it is not a policy score
The ten largest observations total about 1,647.00 million MMBtu, or 62.73% of the 51-value sum. The top 15 reach 73.15%, and the top 20 reach 82.14%. Those figures summarize statistical concentration. They do not measure competition, policy effectiveness, decarbonization progress, or renewable penetration. A state can have a large absolute Btu value and still have a modest renewable share if its overall electricity system is very large.
Normalization would answer a different question. Dividing by population could produce a per-capita measure; dividing by electricity sales or total generation could create an intensity or share-like measure. Neither transformation is performed here because the source slice provides a direct state-level observation with its own meaning. Mixing a new denominator into the result without labeling it would create a different indicator and make comparisons with the EIA field ambiguous.
A one-year snapshot cannot establish a trend
The data are for 2024 only. They show the state distribution in that year, but they cannot tell whether Texas has been rising, whether California’s value fell, or whether Iowa recently moved into the top tier. Trend statements require the same EIA series over multiple years. The strongest time-series design would keep the fuel facet, sector facet, field, geography and unit fixed while extending the annual range.
That identity discipline matters because EIA operational data contain many similar-looking series. CHP and non-CHP categories, individual fuel types, total renewables, generation fields and consumption fields can produce titles that sound related while measuring different things. A year-to-year comparison is only meaningful when the exact underlying dimensions remain constant.
Source and recommended interpretation
The source is the U.S. Energy Information Administration API v2 route electricity/electric-power-operational-data. This package fixes the observation year at 2024, fueltypeid=AOR for all renewables, sectorid=90 for Electric Power Sector Non-CHP, and the total-consumption-btu field. The unit carried by the source is million MMBtu. The 51 values are direct annual observations with no interpolation and no aggregation across other series.
The most defensible conclusion is therefore a statement about scale within this exact metric. Texas is the largest state observation and alone represents 21.59% of the 51-state-and-D.C. sum; California is second at 11.48%, and Iowa is third at 5.90%. The median is 29.41 million MMBtu and the third quartile is 52.73, underscoring how strongly the upper tail affects the average. Read as a Btu-based state comparison rather than a renewable-generation league table, the data provide a clear and useful picture of the 2024 distribution.
Frequently Asked Questions
Does Texas’s 21.6% mean 21.6% of Texas electricity was renewable?
No. It is Texas’s share of the simple sum of the 51 state/DC observations in this specific total-consumption-btu series, not a renewable electricity-mix percentage.
Are any 2024 state observations missing?
No. The extracted series contains numeric values for all 50 states and the District of Columbia, for 51 observed rows with no imputation.
Can this series be used as a renewable generation ranking?
Not directly. It reports total-consumption-btu in million MMBtu. Renewable generation in MWh and installed capacity in MW are different measures.
Related Articles
Green Map creates custom-edited map images using open geographic data sources such as geoBoundaries, Natural Earth, OpenStreetMap, and government open data. These maps are edited visual materials, not raw data files, and are provided for education, documents, presentations, and graphic reference.